
|
|||||
|
 | |
| |
| |
| |
| |
| |
|
Gene: BIRC2 |
Gene summary for BIRC2 |
| Gene information | Species | Human | Gene symbol | BIRC2 | Gene ID | 329 |
| Gene name | baculoviral IAP repeat containing 2 | |
| Gene Alias | API1 | |
| Cytomap | 11q22.2 | |
| Gene Type | protein-coding | GO ID | GO:0000003 | UniProtAcc | Q13490 |
Top |
Malignant transformation analysis |
| Identification of the aberrant gene expression in precancerous and cancerous lesions by comparing the gene expression of stem-like cells in diseased tissues with normal stem cells |
| Entrez ID | Symbol | Replicates | Species | Organ | Tissue | Adj P-value | Log2FC | Malignancy |
| 329 | BIRC2 | LZE4T | Human | Esophagus | ESCC | 9.73e-08 | 2.73e-01 | 0.0811 |
| 329 | BIRC2 | LZE5T | Human | Esophagus | ESCC | 1.43e-02 | 5.51e-02 | 0.0514 |
| 329 | BIRC2 | LZE7T | Human | Esophagus | ESCC | 2.17e-05 | 1.34e-01 | 0.0667 |
| 329 | BIRC2 | LZE8T | Human | Esophagus | ESCC | 3.02e-04 | 3.49e-01 | 0.067 |
| 329 | BIRC2 | LZE20T | Human | Esophagus | ESCC | 8.95e-08 | 1.45e-01 | 0.0662 |
| 329 | BIRC2 | LZE22D1 | Human | Esophagus | HGIN | 1.92e-10 | 3.21e-01 | 0.0595 |
| 329 | BIRC2 | LZE22T | Human | Esophagus | ESCC | 6.35e-04 | 8.67e-01 | 0.068 |
| 329 | BIRC2 | LZE24T | Human | Esophagus | ESCC | 1.77e-15 | 3.67e-01 | 0.0596 |
| 329 | BIRC2 | LZE6T | Human | Esophagus | ESCC | 1.86e-11 | 2.15e-01 | 0.0845 |
| 329 | BIRC2 | P2T-E | Human | Esophagus | ESCC | 5.22e-12 | 2.98e-01 | 0.1177 |
| 329 | BIRC2 | P4T-E | Human | Esophagus | ESCC | 1.21e-16 | 4.28e-01 | 0.1323 |
| 329 | BIRC2 | P5T-E | Human | Esophagus | ESCC | 1.86e-10 | 2.36e-01 | 0.1327 |
| 329 | BIRC2 | P8T-E | Human | Esophagus | ESCC | 2.66e-62 | 1.19e+00 | 0.0889 |
| 329 | BIRC2 | P9T-E | Human | Esophagus | ESCC | 3.09e-17 | 2.23e-01 | 0.1131 |
| 329 | BIRC2 | P10T-E | Human | Esophagus | ESCC | 4.44e-22 | 2.68e-01 | 0.116 |
| 329 | BIRC2 | P11T-E | Human | Esophagus | ESCC | 2.80e-15 | 7.44e-01 | 0.1426 |
| 329 | BIRC2 | P12T-E | Human | Esophagus | ESCC | 1.44e-28 | 4.94e-01 | 0.1122 |
| 329 | BIRC2 | P15T-E | Human | Esophagus | ESCC | 3.70e-58 | 1.66e+00 | 0.1149 |
| 329 | BIRC2 | P16T-E | Human | Esophagus | ESCC | 8.73e-23 | 4.37e-01 | 0.1153 |
| 329 | BIRC2 | P17T-E | Human | Esophagus | ESCC | 5.89e-03 | 3.93e-01 | 0.1278 |
| Page: 1 2 3 4 5 6 |
| Tissue | Expression Dynamics | Abbreviation |
| Esophagus |  | ESCC: Esophageal squamous cell carcinoma |
| HGIN: High-grade intraepithelial neoplasias | ||
| LGIN: Low-grade intraepithelial neoplasias | ||
| Liver | 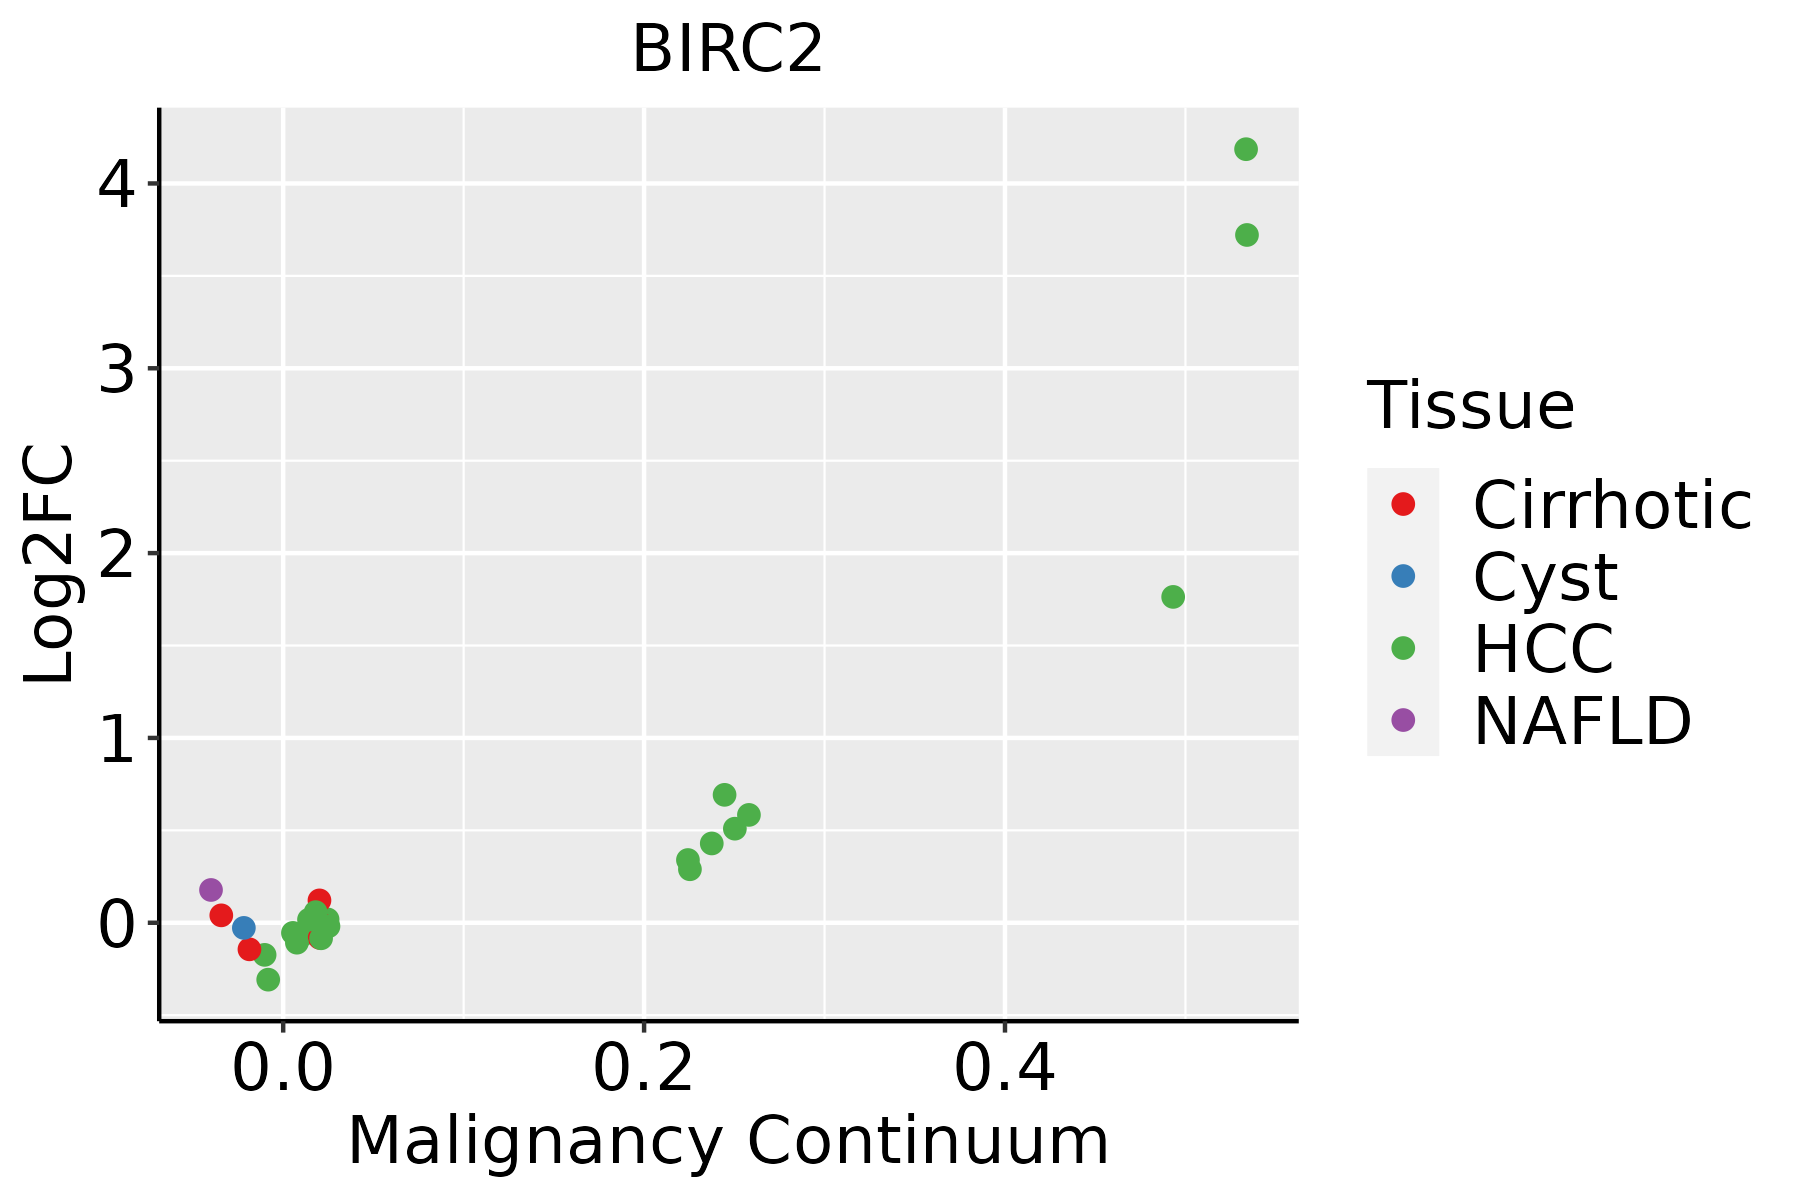 | HCC: Hepatocellular carcinoma |
| NAFLD: Non-alcoholic fatty liver disease | ||
| Oral Cavity |  | EOLP: Erosive Oral lichen planus |
| LP: leukoplakia | ||
| NEOLP: Non-erosive oral lichen planus | ||
| OSCC: Oral squamous cell carcinoma | ||
| Skin | 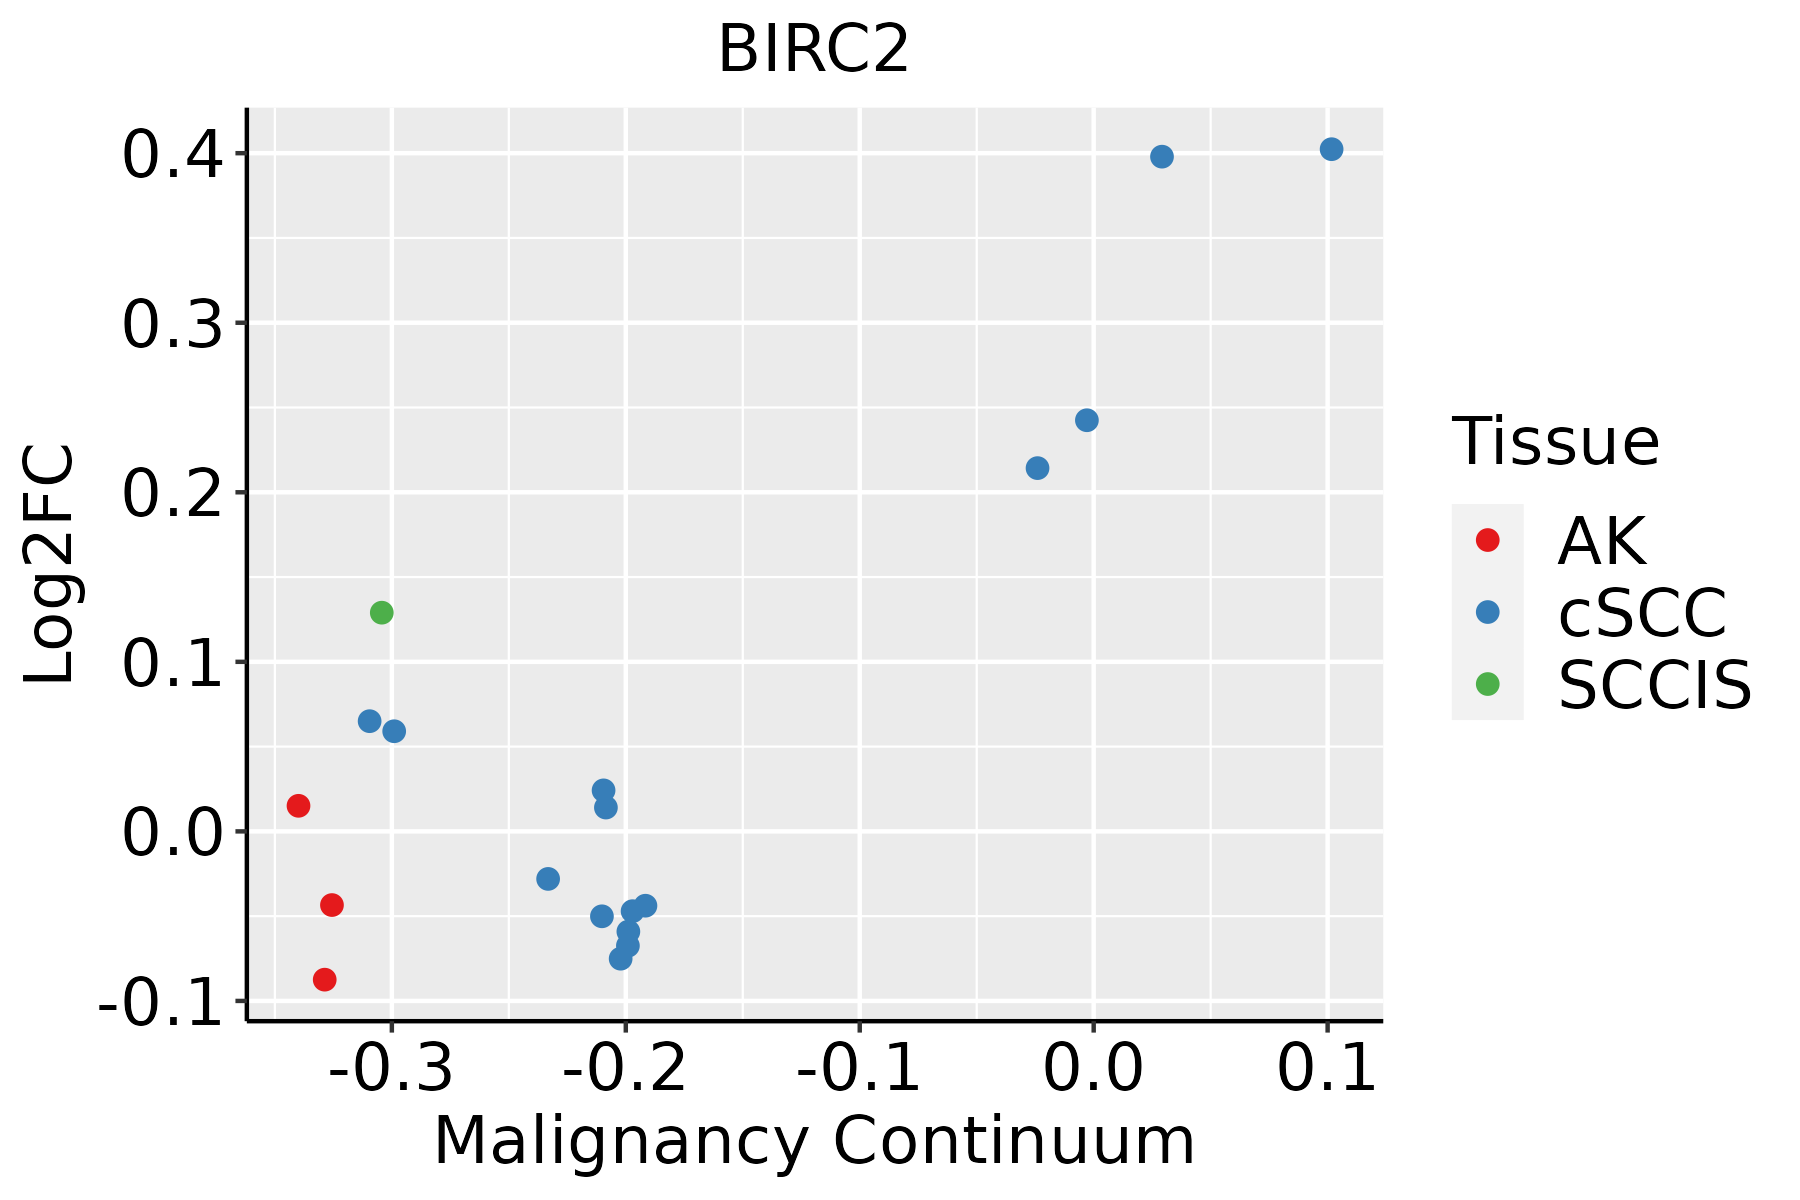 | AK: Actinic keratosis |
| cSCC: Cutaneous squamous cell carcinoma | ||
| SCCIS:squamous cell carcinoma in situ | ||
| Thyroid | 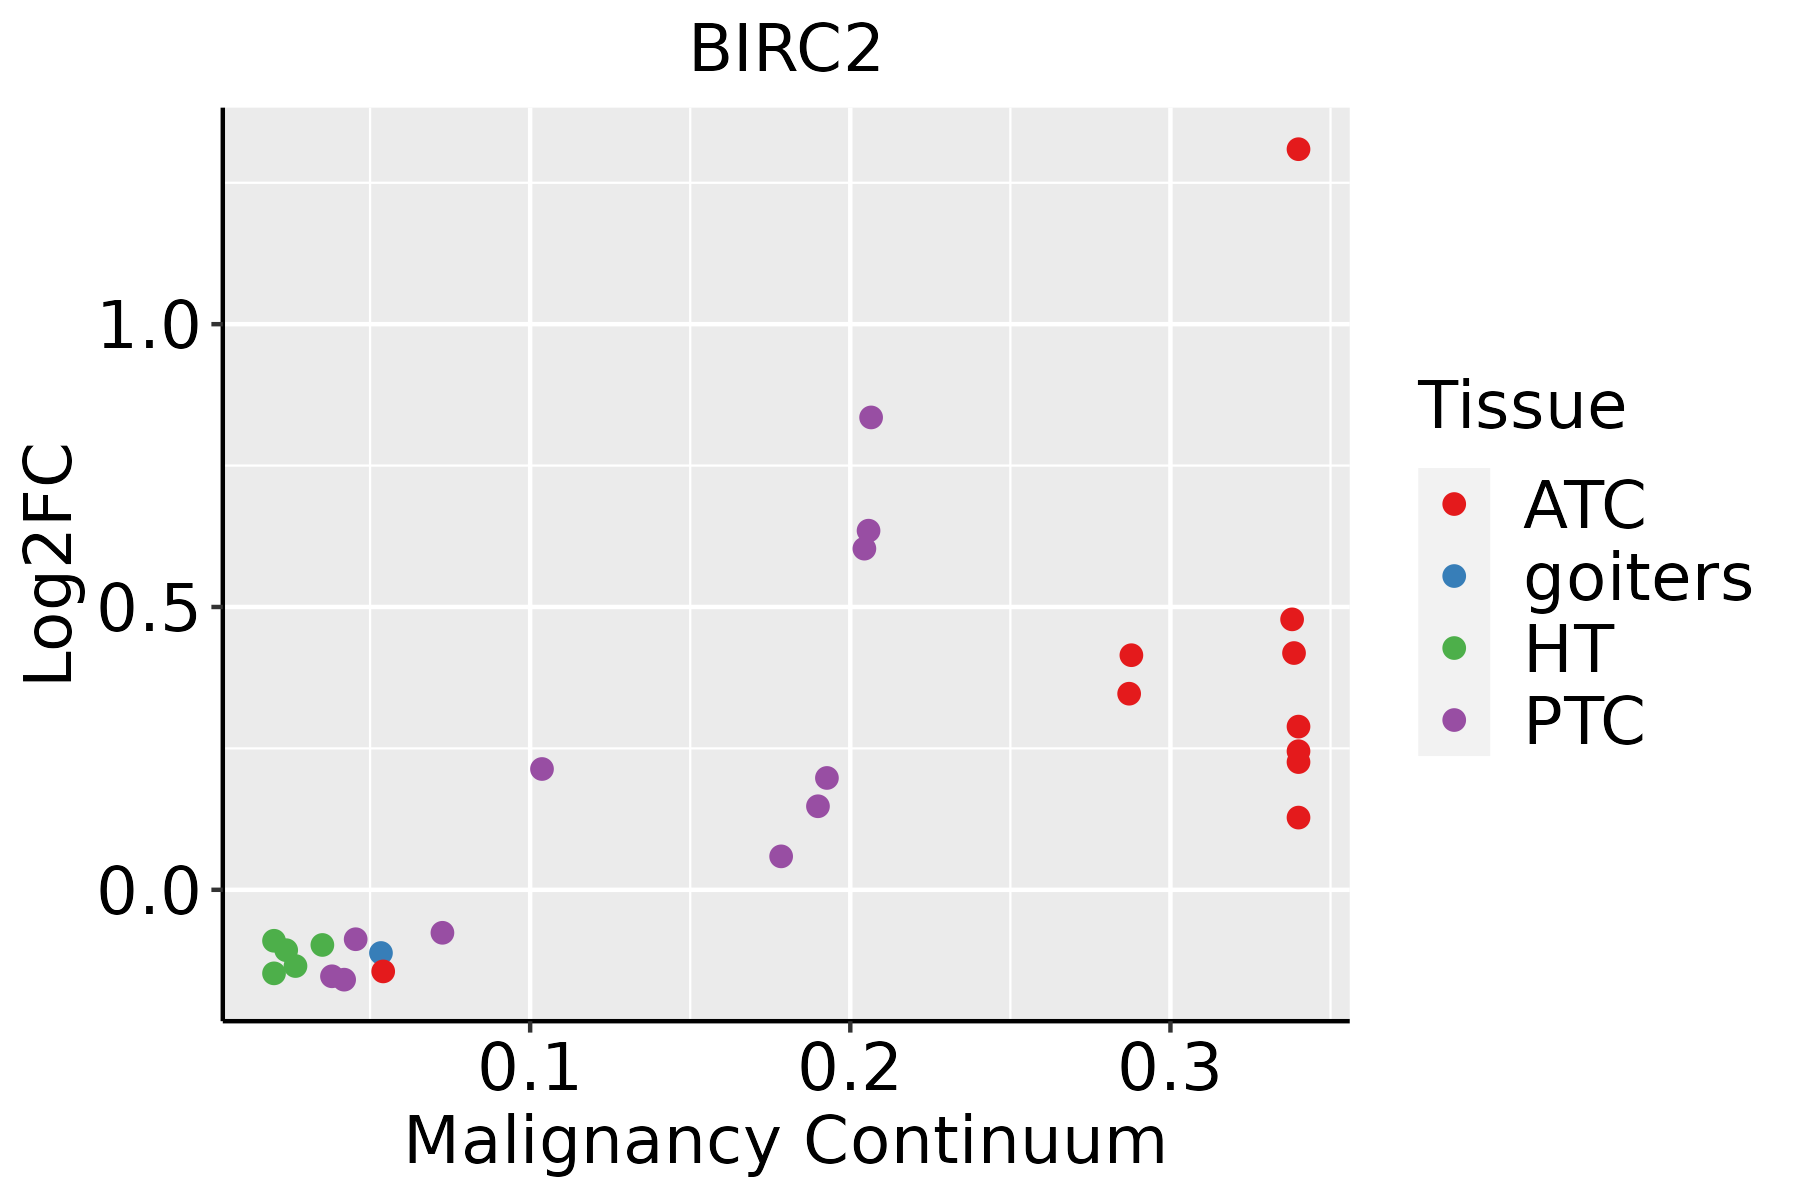 | ATC: Anaplastic thyroid cancer |
| HT: Hashimoto's thyroiditis | ||
| PTC: Papillary thyroid cancer |
| ∗log2FC in expression of this searched gene in stem-like cells from each diseased tissue sample relative to stem-like cells in normal samples in each tissue plotted against the malignancy continuum. Samples are colored based on if they are from different disease stage. |
Top |
Malignant transformation related pathway analysis |
| Find out the enriched GO biological processes and KEGG pathways involved in transition from healthy to precancer to cancer |
| Tissue | Disease Stage | Enriched GO biological Processes |
| Colorectum | AD |  |
| Colorectum | SER |  |
| Colorectum | MSS |  |
| Colorectum | MSI-H |  |
| Colorectum | FAP |  |
| ∗Top 15 enriched GO BP terms are showed in the bar plot of each disease state in each tissue. Each row represents a significant GO biological process which is colored according to the -log10(p.adjust). |
| Page: 1 2 3 4 5 6 7 8 9 |
| GO ID | Tissue | Disease Stage | Description | Gene Ratio | Bg Ratio | pvalue | p.adjust | Count |
| GO:007042312 | Oral cavity | EOLP | nucleotide-binding oligomerization domain containing signaling pathway | 13/2218 | 25/18723 | 1.14e-06 | 2.78e-05 | 13 |
| GO:004586125 | Oral cavity | EOLP | negative regulation of proteolysis | 72/2218 | 351/18723 | 1.96e-06 | 4.49e-05 | 72 |
| GO:000166624 | Oral cavity | EOLP | response to hypoxia | 65/2218 | 307/18723 | 2.00e-06 | 4.55e-05 | 65 |
| GO:003133324 | Oral cavity | EOLP | negative regulation of protein-containing complex assembly | 37/2218 | 141/18723 | 2.01e-06 | 4.57e-05 | 37 |
| GO:003587212 | Oral cavity | EOLP | nucleotide-binding domain, leucine rich repeat containing receptor signaling pathway | 13/2218 | 26/18723 | 2.03e-06 | 4.60e-05 | 13 |
| GO:000275312 | Oral cavity | EOLP | cytoplasmic pattern recognition receptor signaling pathway | 21/2218 | 60/18723 | 2.55e-06 | 5.64e-05 | 21 |
| GO:007048224 | Oral cavity | EOLP | response to oxygen levels | 70/2218 | 347/18723 | 5.00e-06 | 1.02e-04 | 70 |
| GO:003629324 | Oral cavity | EOLP | response to decreased oxygen levels | 66/2218 | 322/18723 | 5.31e-06 | 1.07e-04 | 66 |
| GO:006145824 | Oral cavity | EOLP | reproductive system development | 81/2218 | 427/18723 | 1.09e-05 | 1.93e-04 | 81 |
| GO:004860823 | Oral cavity | EOLP | reproductive structure development | 80/2218 | 424/18723 | 1.51e-05 | 2.50e-04 | 80 |
| GO:005160721 | Oral cavity | EOLP | defense response to virus | 55/2218 | 265/18723 | 2.16e-05 | 3.35e-04 | 55 |
| GO:014054621 | Oral cavity | EOLP | defense response to symbiont | 55/2218 | 265/18723 | 2.16e-05 | 3.35e-04 | 55 |
| GO:000222411 | Oral cavity | EOLP | toll-like receptor signaling pathway | 31/2218 | 121/18723 | 2.21e-05 | 3.37e-04 | 31 |
| GO:009730525 | Oral cavity | EOLP | response to alcohol | 53/2218 | 253/18723 | 2.31e-05 | 3.50e-04 | 53 |
| GO:006220713 | Oral cavity | EOLP | regulation of pattern recognition receptor signaling pathway | 28/2218 | 105/18723 | 2.46e-05 | 3.65e-04 | 28 |
| GO:004312322 | Oral cavity | EOLP | positive regulation of I-kappaB kinase/NF-kappaB signaling | 42/2218 | 186/18723 | 2.54e-05 | 3.75e-04 | 42 |
| GO:007042412 | Oral cavity | EOLP | regulation of nucleotide-binding oligomerization domain containing signaling pathway | 8/2218 | 13/18723 | 2.84e-05 | 4.12e-04 | 8 |
| GO:001095124 | Oral cavity | EOLP | negative regulation of endopeptidase activity | 52/2218 | 252/18723 | 4.21e-05 | 5.74e-04 | 52 |
| GO:190332221 | Oral cavity | EOLP | positive regulation of protein modification by small protein conjugation or removal | 33/2218 | 138/18723 | 5.51e-05 | 7.04e-04 | 33 |
| GO:005134625 | Oral cavity | EOLP | negative regulation of hydrolase activity | 70/2218 | 379/18723 | 9.98e-05 | 1.14e-03 | 70 |
| Page: 1 2 3 4 5 6 7 8 9 10 11 12 13 14 15 16 17 18 19 20 21 22 23 24 25 26 27 |
| Pathway ID | Tissue | Disease Stage | Description | Gene Ratio | Bg Ratio | pvalue | p.adjust | qvalue | Count |
| hsa0412026 | Esophagus | HGIN | Ubiquitin mediated proteolysis | 49/1383 | 142/8465 | 7.78e-08 | 1.33e-06 | 1.06e-06 | 49 |
| hsa0513239 | Esophagus | HGIN | Salmonella infection | 69/1383 | 249/8465 | 3.02e-06 | 4.47e-05 | 3.55e-05 | 69 |
| hsa0421020 | Esophagus | HGIN | Apoptosis | 36/1383 | 136/8465 | 1.67e-03 | 1.52e-02 | 1.20e-02 | 36 |
| hsa046219 | Esophagus | HGIN | NOD-like receptor signaling pathway | 45/1383 | 186/8465 | 3.40e-03 | 2.54e-02 | 2.02e-02 | 45 |
| hsa04120111 | Esophagus | HGIN | Ubiquitin mediated proteolysis | 49/1383 | 142/8465 | 7.78e-08 | 1.33e-06 | 1.06e-06 | 49 |
| hsa05132115 | Esophagus | HGIN | Salmonella infection | 69/1383 | 249/8465 | 3.02e-06 | 4.47e-05 | 3.55e-05 | 69 |
| hsa04210110 | Esophagus | HGIN | Apoptosis | 36/1383 | 136/8465 | 1.67e-03 | 1.52e-02 | 1.20e-02 | 36 |
| hsa0462114 | Esophagus | HGIN | NOD-like receptor signaling pathway | 45/1383 | 186/8465 | 3.40e-03 | 2.54e-02 | 2.02e-02 | 45 |
| hsa0412027 | Esophagus | ESCC | Ubiquitin mediated proteolysis | 122/4205 | 142/8465 | 6.53e-20 | 7.29e-18 | 3.74e-18 | 122 |
| hsa05132211 | Esophagus | ESCC | Salmonella infection | 191/4205 | 249/8465 | 6.51e-19 | 5.45e-17 | 2.79e-17 | 191 |
| hsa0466810 | Esophagus | ESCC | TNF signaling pathway | 89/4205 | 114/8465 | 3.36e-10 | 4.01e-09 | 2.06e-09 | 89 |
| hsa0421027 | Esophagus | ESCC | Apoptosis | 102/4205 | 136/8465 | 1.05e-09 | 1.21e-08 | 6.21e-09 | 102 |
| hsa052229 | Esophagus | ESCC | Small cell lung cancer | 69/4205 | 92/8465 | 5.40e-07 | 3.85e-06 | 1.97e-06 | 69 |
| hsa015247 | Esophagus | ESCC | Platinum drug resistance | 56/4205 | 73/8465 | 1.85e-06 | 1.13e-05 | 5.78e-06 | 56 |
| hsa0514525 | Esophagus | ESCC | Toxoplasmosis | 76/4205 | 112/8465 | 6.83e-05 | 2.90e-04 | 1.48e-04 | 76 |
| hsa0451020 | Esophagus | ESCC | Focal adhesion | 127/4205 | 203/8465 | 1.25e-04 | 4.99e-04 | 2.56e-04 | 127 |
| hsa0462122 | Esophagus | ESCC | NOD-like receptor signaling pathway | 116/4205 | 186/8465 | 2.90e-04 | 1.03e-03 | 5.30e-04 | 116 |
| hsa042156 | Esophagus | ESCC | Apoptosis - multiple species | 25/4205 | 32/8465 | 9.13e-04 | 2.92e-03 | 1.49e-03 | 25 |
| hsa040645 | Esophagus | ESCC | NF-kappa B signaling pathway | 67/4205 | 104/8465 | 1.62e-03 | 4.89e-03 | 2.50e-03 | 67 |
| hsa052028 | Esophagus | ESCC | Transcriptional misregulation in cancer | 116/4205 | 193/8465 | 2.08e-03 | 5.95e-03 | 3.05e-03 | 116 |
| Page: 1 2 3 4 5 6 7 |
Top |
Cell-cell communication analysis |
| Identification of potential cell-cell interactions between two cell types and their ligand-receptor pairs for different disease states |
| Ligand | Receptor | LRpair | Pathway | Tissue | Disease Stage |
| Page: 1 |
Top |
Single-cell gene regulatory network inference analysis |
| Find out the significant the regulons (TFs) and the target genes of each regulon across cell types for different disease states |
| TF | Cell Type | Tissue | Disease Stage | Target Gene | RSS | Regulon Activity |
| ∗The dot plots of a searched regulon are shown for all cell subpopulations in each disease state of each tissue based on the regulon specific score inferred using pySCENIC and by calculating the average expression. |
| Page: 1 |
Top |
Somatic mutation of malignant transformation related genes |
| Annotation of somatic variants for genes involved in malignant transformation |
| Hugo Symbol | Variant Class | Variant Classification | dbSNP RS | HGVSc | HGVSp | HGVSp Short | SWISSPROT | BIOTYPE | SIFT | PolyPhen | Tumor Sample Barcode | Tissue | Histology | Sex | Age | Stage | Therapy Types | Drugs | Outcome |
| BIRC2 | SNV | Missense_Mutation | novel | c.1039N>A | p.Glu347Lys | p.E347K | Q13490 | protein_coding | tolerated(0.08) | benign(0.025) | TCGA-5L-AAT1-01 | Breast | breast invasive carcinoma | Female | <65 | III/IV | Hormone Therapy | letrozol | SD |
| BIRC2 | SNV | Missense_Mutation | novel | c.907G>T | p.Asp303Tyr | p.D303Y | Q13490 | protein_coding | deleterious(0) | probably_damaging(1) | TCGA-AC-A23H-01 | Breast | breast invasive carcinoma | Female | >=65 | I/II | Unknown | Unknown | PD |
| BIRC2 | SNV | Missense_Mutation | rs779636887 | c.378N>T | p.Lys126Asn | p.K126N | Q13490 | protein_coding | tolerated(0.47) | benign(0.065) | TCGA-AN-A046-01 | Breast | breast invasive carcinoma | Female | >=65 | I/II | Unknown | Unknown | SD |
| BIRC2 | SNV | Missense_Mutation | novel | c.1356N>C | p.Glu452Asp | p.E452D | Q13490 | protein_coding | tolerated(0.08) | benign(0.04) | TCGA-AN-A046-01 | Breast | breast invasive carcinoma | Female | >=65 | I/II | Unknown | Unknown | SD |
| BIRC2 | SNV | Missense_Mutation | novel | c.898N>T | p.Arg300Cys | p.R300C | Q13490 | protein_coding | tolerated(0.07) | benign(0.075) | TCGA-2W-A8YY-01 | Cervix | cervical & endocervical cancer | Female | <65 | I/II | Chemotherapy | cisplatin | CR |
| BIRC2 | SNV | Missense_Mutation | c.1762C>G | p.His588Asp | p.H588D | Q13490 | protein_coding | deleterious(0) | probably_damaging(1) | TCGA-EK-A2RJ-01 | Cervix | cervical & endocervical cancer | Female | <65 | I/II | Unknown | Unknown | SD | |
| BIRC2 | SNV | Missense_Mutation | c.155N>T | p.Thr52Ile | p.T52I | Q13490 | protein_coding | deleterious(0) | probably_damaging(1) | TCGA-IR-A3L7-01 | Cervix | cervical & endocervical cancer | Female | <65 | I/II | Chemotherapy | cisplatin | CR | |
| BIRC2 | SNV | Missense_Mutation | novel | c.862N>A | p.Glu288Lys | p.E288K | Q13490 | protein_coding | tolerated(0.05) | benign(0.149) | TCGA-VS-A9UZ-01 | Cervix | cervical & endocervical cancer | Female | <65 | I/II | Unknown | Unknown | SD |
| BIRC2 | SNV | Missense_Mutation | novel | c.980C>T | p.Ala327Val | p.A327V | Q13490 | protein_coding | deleterious(0) | probably_damaging(1) | TCGA-AA-3947-01 | Colorectum | colon adenocarcinoma | Female | <65 | I/II | Unknown | Unknown | SD |
| BIRC2 | SNV | Missense_Mutation | c.62T>C | p.Ile21Thr | p.I21T | Q13490 | protein_coding | deleterious(0.03) | benign(0.001) | TCGA-AA-A022-01 | Colorectum | colon adenocarcinoma | Female | >=65 | I/II | Unknown | Unknown | SD |
| Page: 1 2 3 4 5 6 |
Top |
Related drugs of malignant transformation related genes |
| Identification of chemicals and drugs interact with genes involved in malignant transfromation |
| (DGIdb 4.0) |
| Entrez ID | Symbol | Category | Interaction Types | Drug Claim Name | Drug Name | PMIDs |
| 329 | BIRC2 | TUMOR SUPPRESSOR, KINASE, DRUGGABLE GENOME | PMID25980951-Compound-1 | |||
| 329 | BIRC2 | TUMOR SUPPRESSOR, KINASE, DRUGGABLE GENOME | HGS1029 | |||
| 329 | BIRC2 | TUMOR SUPPRESSOR, KINASE, DRUGGABLE GENOME | inhibitor | 252827512 | CHEMBL481422 | |
| 329 | BIRC2 | TUMOR SUPPRESSOR, KINASE, DRUGGABLE GENOME | PMID25980951-Compound-43 | |||
| 329 | BIRC2 | TUMOR SUPPRESSOR, KINASE, DRUGGABLE GENOME | BESTATIN METHYL ESTER | BESTATIN METHYL ESTER | 21515062 | |
| 329 | BIRC2 | TUMOR SUPPRESSOR, KINASE, DRUGGABLE GENOME | PMID25980951-Compound-4 | |||
| 329 | BIRC2 | TUMOR SUPPRESSOR, KINASE, DRUGGABLE GENOME | Birinapant | BIRINAPANT | ||
| 329 | BIRC2 | TUMOR SUPPRESSOR, KINASE, DRUGGABLE GENOME | PMID25980951-Compound-37 | |||
| 329 | BIRC2 | TUMOR SUPPRESSOR, KINASE, DRUGGABLE GENOME | antagonist | AT-406 | AT-406 | |
| 329 | BIRC2 | TUMOR SUPPRESSOR, KINASE, DRUGGABLE GENOME | PMID25980951-Compound-18 |
| Page: 1 2 3 4 5 |

Copyright 2023-Present -The University of Texas Health Science Center at Houston |