
|
|||||
|
 | |
| |
| |
| |
| |
| |
|
Gene: ATIC |
Gene summary for ATIC |
| Gene information | Species | Human | Gene symbol | ATIC | Gene ID | 471 |
| Gene name | 5-aminoimidazole-4-carboxamide ribonucleotide formyltransferase/IMP cyclohydrolase | |
| Gene Alias | AICAR | |
| Cytomap | 2q35 | |
| Gene Type | protein-coding | GO ID | GO:0003360 | UniProtAcc | P31939 |
Top |
Malignant transformation analysis |
| Identification of the aberrant gene expression in precancerous and cancerous lesions by comparing the gene expression of stem-like cells in diseased tissues with normal stem cells |
| Entrez ID | Symbol | Replicates | Species | Organ | Tissue | Adj P-value | Log2FC | Malignancy |
| 471 | ATIC | HTA11_1391_2000001011 | Human | Colorectum | AD | 3.70e-05 | 4.05e-01 | -0.059 |
| 471 | ATIC | HTA11_7696_3000711011 | Human | Colorectum | AD | 9.80e-03 | 3.39e-01 | 0.0674 |
| 471 | ATIC | HTA11_99999970781_79442 | Human | Colorectum | MSS | 1.13e-05 | 4.89e-01 | 0.294 |
| 471 | ATIC | HTA11_99999965062_69753 | Human | Colorectum | MSI-H | 4.05e-04 | 1.01e+00 | 0.3487 |
| 471 | ATIC | HTA11_99999971662_82457 | Human | Colorectum | MSS | 2.10e-10 | 6.50e-01 | 0.3859 |
| 471 | ATIC | A015-C-203 | Human | Colorectum | FAP | 2.10e-08 | -1.53e-01 | -0.1294 |
| 471 | ATIC | A001-C-108 | Human | Colorectum | FAP | 2.52e-02 | -5.31e-02 | -0.0272 |
| 471 | ATIC | A002-C-205 | Human | Colorectum | FAP | 4.96e-02 | -9.22e-02 | -0.1236 |
| 471 | ATIC | A015-C-104 | Human | Colorectum | FAP | 1.53e-06 | -3.15e-02 | -0.1899 |
| 471 | ATIC | A002-C-116 | Human | Colorectum | FAP | 1.68e-04 | -3.76e-02 | -0.0452 |
| 471 | ATIC | CRC-1-8810 | Human | Colorectum | CRC | 9.03e-03 | 3.33e-01 | 0.6257 |
| 471 | ATIC | LZE4T | Human | Esophagus | ESCC | 1.47e-06 | 3.67e-01 | 0.0811 |
| 471 | ATIC | LZE8T | Human | Esophagus | ESCC | 3.56e-04 | 2.96e-01 | 0.067 |
| 471 | ATIC | LZE24T | Human | Esophagus | ESCC | 2.53e-09 | 4.30e-01 | 0.0596 |
| 471 | ATIC | LZE6T | Human | Esophagus | ESCC | 8.91e-05 | 5.15e-01 | 0.0845 |
| 471 | ATIC | P1T-E | Human | Esophagus | ESCC | 1.89e-02 | 3.48e-01 | 0.0875 |
| 471 | ATIC | P2T-E | Human | Esophagus | ESCC | 2.71e-31 | 7.08e-01 | 0.1177 |
| 471 | ATIC | P4T-E | Human | Esophagus | ESCC | 9.17e-09 | 4.87e-01 | 0.1323 |
| 471 | ATIC | P5T-E | Human | Esophagus | ESCC | 9.39e-20 | 5.71e-01 | 0.1327 |
| 471 | ATIC | P8T-E | Human | Esophagus | ESCC | 4.10e-18 | 4.31e-01 | 0.0889 |
| Page: 1 2 3 4 5 6 |
| Tissue | Expression Dynamics | Abbreviation |
| Colorectum (GSE201348) |  | FAP: Familial adenomatous polyposis |
| CRC: Colorectal cancer | ||
| Colorectum (HTA11) |  | AD: Adenomas |
| SER: Sessile serrated lesions | ||
| MSI-H: Microsatellite-high colorectal cancer | ||
| MSS: Microsatellite stable colorectal cancer | ||
| Esophagus | 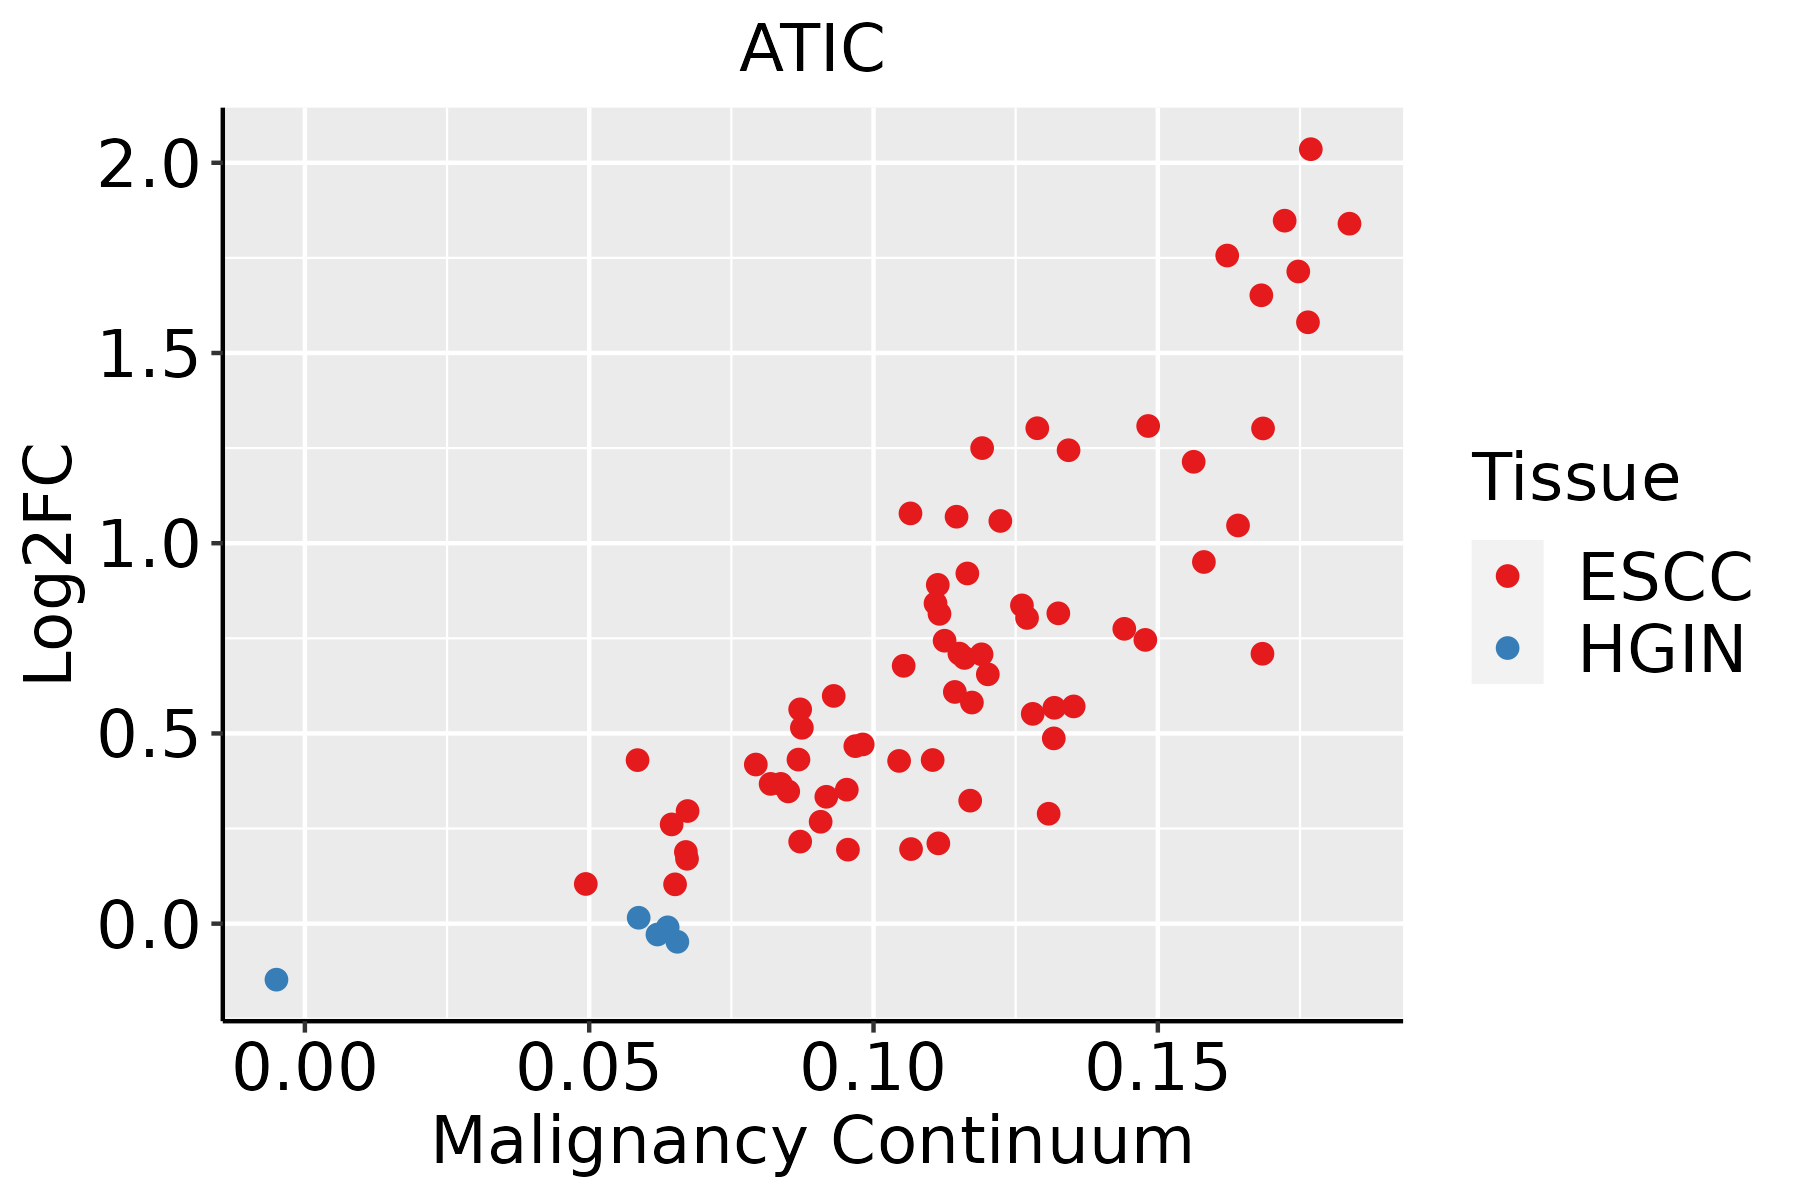 | ESCC: Esophageal squamous cell carcinoma |
| HGIN: High-grade intraepithelial neoplasias | ||
| LGIN: Low-grade intraepithelial neoplasias | ||
| Liver |  | HCC: Hepatocellular carcinoma |
| NAFLD: Non-alcoholic fatty liver disease | ||
| Oral Cavity | 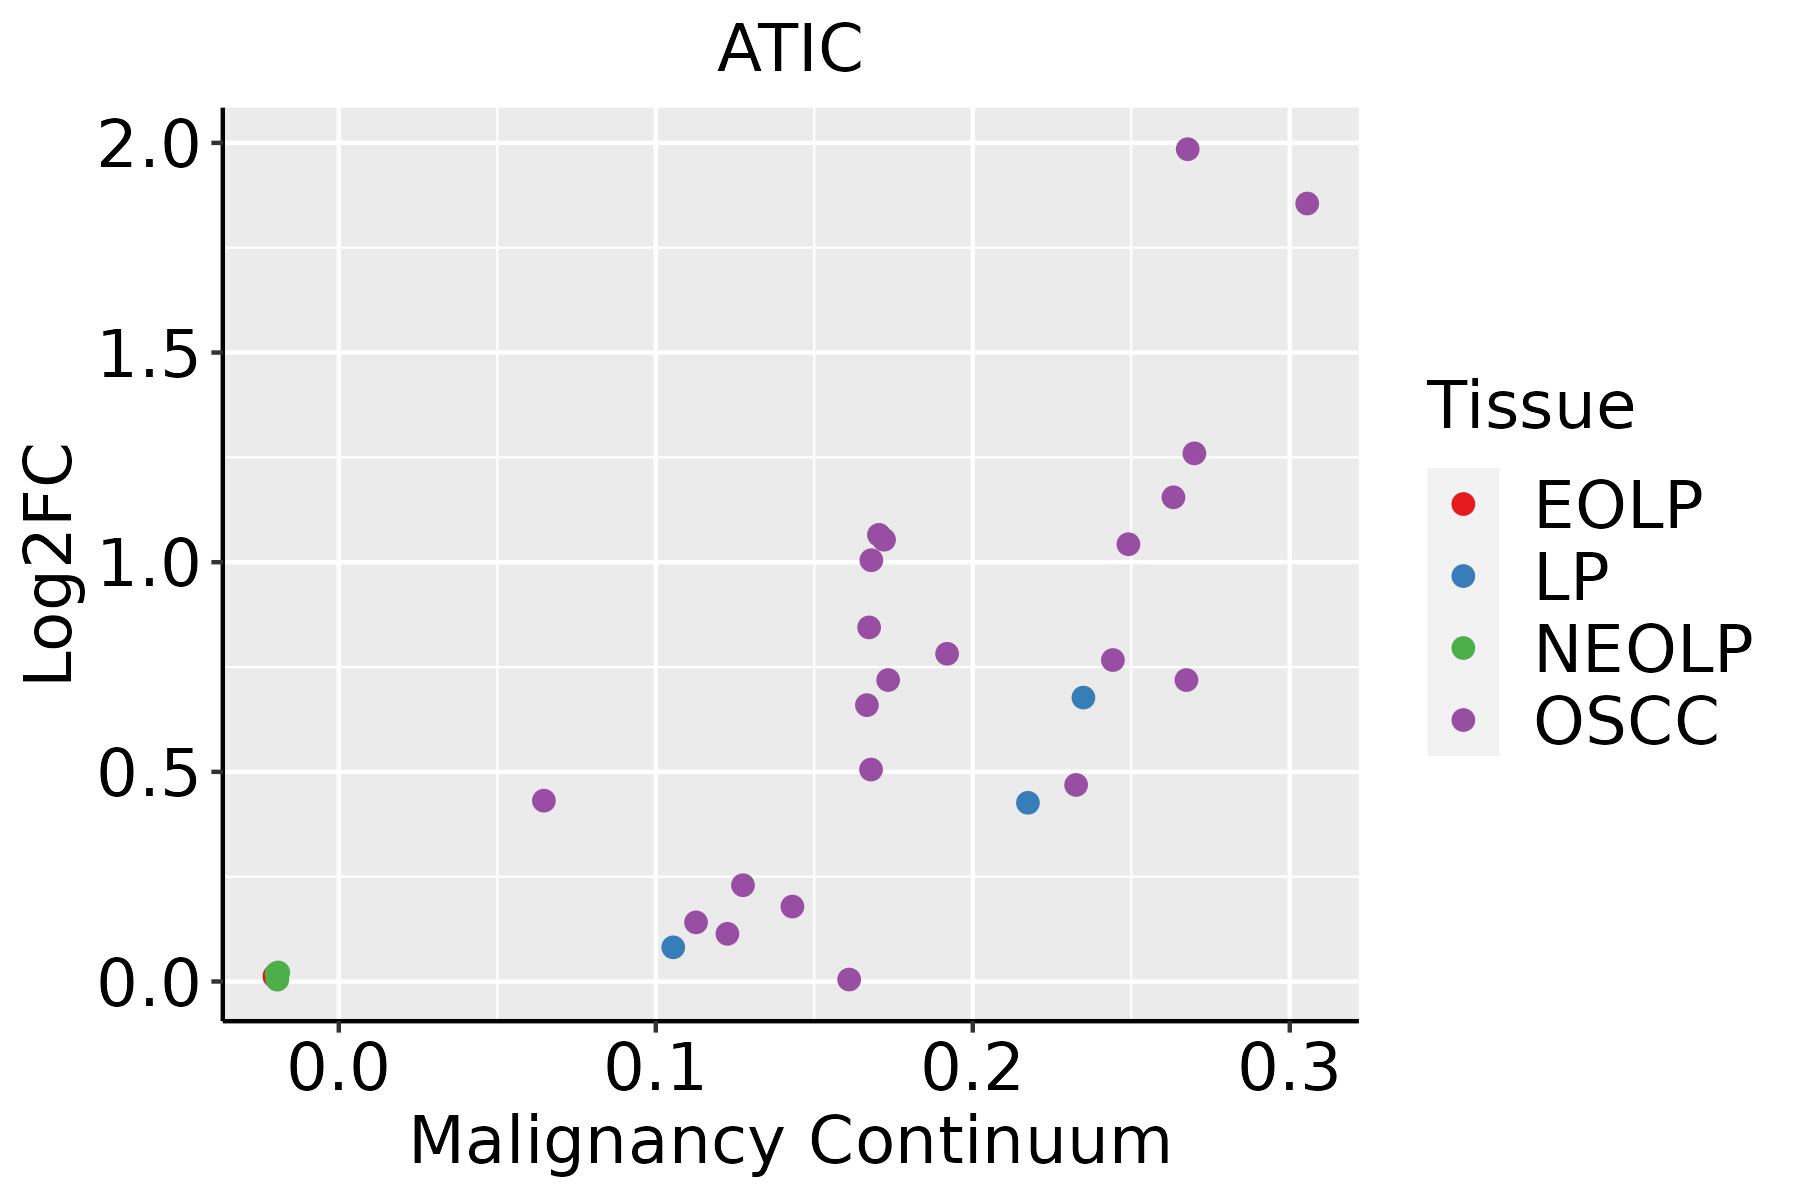 | EOLP: Erosive Oral lichen planus |
| LP: leukoplakia | ||
| NEOLP: Non-erosive oral lichen planus | ||
| OSCC: Oral squamous cell carcinoma | ||
| Skin | 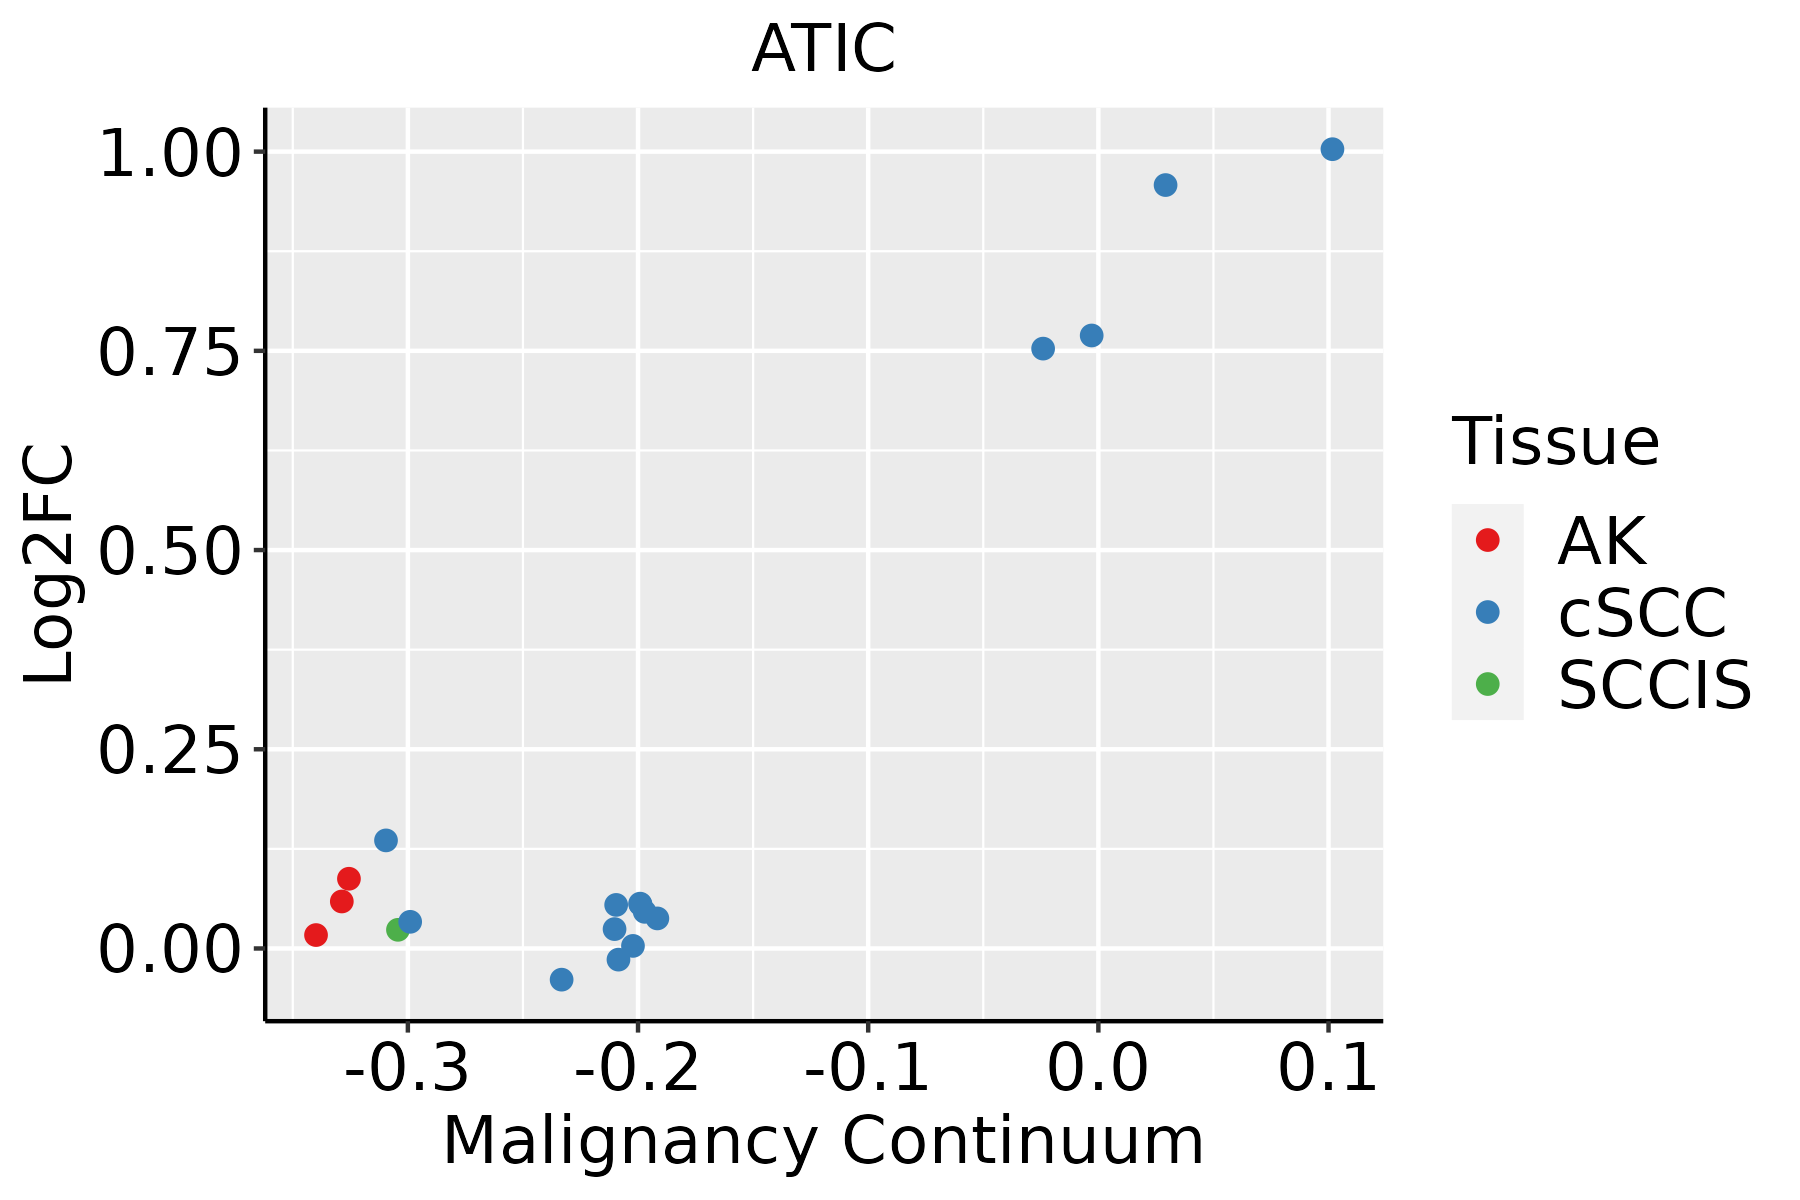 | AK: Actinic keratosis |
| cSCC: Cutaneous squamous cell carcinoma | ||
| SCCIS:squamous cell carcinoma in situ | ||
| Thyroid | 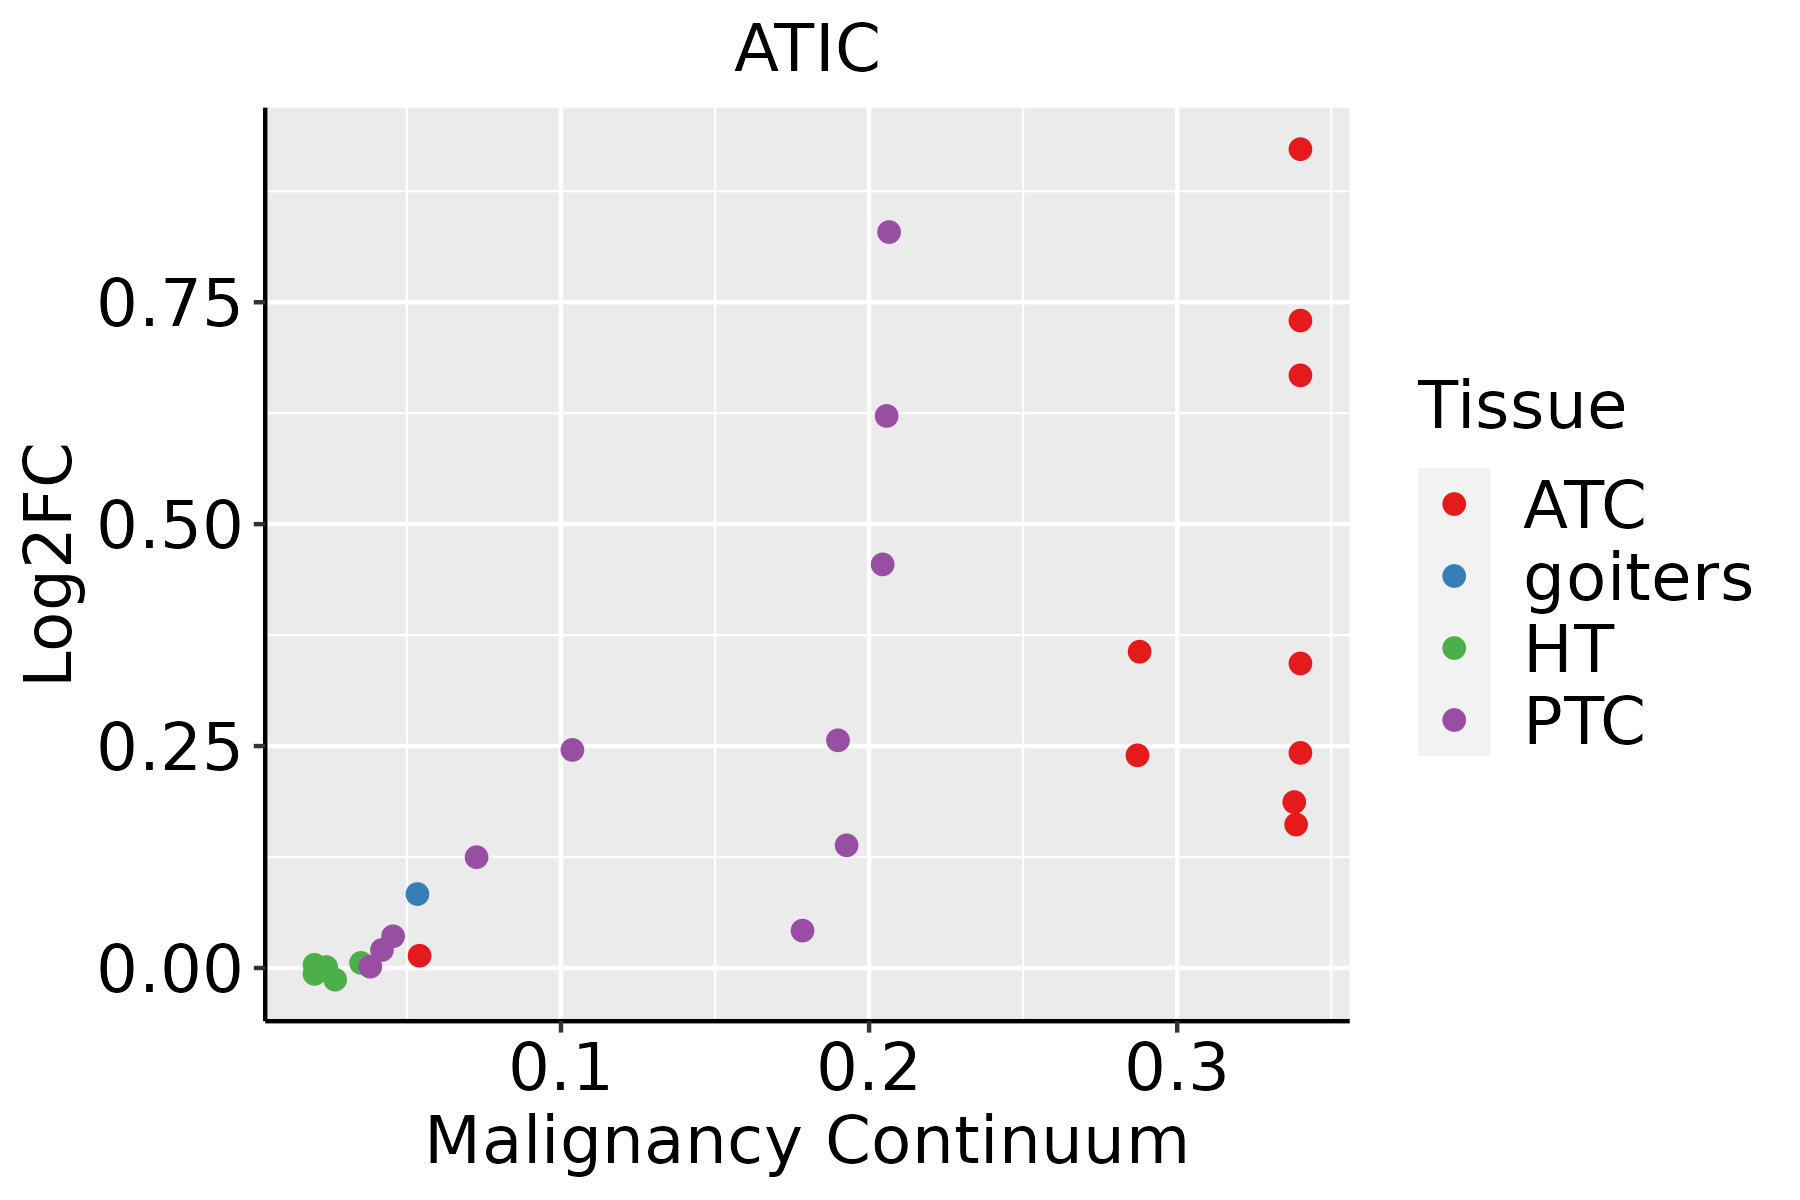 | ATC: Anaplastic thyroid cancer |
| HT: Hashimoto's thyroiditis | ||
| PTC: Papillary thyroid cancer |
| ∗log2FC in expression of this searched gene in stem-like cells from each diseased tissue sample relative to stem-like cells in normal samples in each tissue plotted against the malignancy continuum. Samples are colored based on if they are from different disease stage. |
Top |
Malignant transformation related pathway analysis |
| Find out the enriched GO biological processes and KEGG pathways involved in transition from healthy to precancer to cancer |
| Tissue | Disease Stage | Enriched GO biological Processes |
| Colorectum | AD |  |
| Colorectum | SER |  |
| Colorectum | MSS |  |
| Colorectum | MSI-H |  |
| Colorectum | FAP |  |
| ∗Top 15 enriched GO BP terms are showed in the bar plot of each disease state in each tissue. Each row represents a significant GO biological process which is colored according to the -log10(p.adjust). |
| Page: 1 2 3 4 5 6 7 8 9 |
| GO ID | Tissue | Disease Stage | Description | Gene Ratio | Bg Ratio | pvalue | p.adjust | Count |
| GO:000912614 | Thyroid | PTC | purine nucleoside monophosphate metabolic process | 25/5968 | 44/18723 | 5.43e-04 | 3.48e-03 | 25 |
| GO:007252219 | Thyroid | PTC | purine-containing compound biosynthetic process | 86/5968 | 200/18723 | 5.85e-04 | 3.72e-03 | 86 |
| GO:000916710 | Thyroid | PTC | purine ribonucleoside monophosphate metabolic process | 23/5968 | 41/18723 | 1.14e-03 | 6.65e-03 | 23 |
| GO:004239813 | Thyroid | PTC | cellular modified amino acid biosynthetic process | 25/5968 | 46/18723 | 1.31e-03 | 7.43e-03 | 25 |
| GO:000616419 | Thyroid | PTC | purine nucleotide biosynthetic process | 81/5968 | 191/18723 | 1.35e-03 | 7.65e-03 | 81 |
| GO:003110017 | Thyroid | PTC | animal organ regeneration | 37/5968 | 76/18723 | 1.64e-03 | 9.02e-03 | 37 |
| GO:00215438 | Thyroid | PTC | pallium development | 72/5968 | 169/18723 | 2.09e-03 | 1.11e-02 | 72 |
| GO:0031099110 | Thyroid | PTC | regeneration | 82/5968 | 198/18723 | 2.83e-03 | 1.40e-02 | 82 |
| GO:00215373 | Thyroid | PTC | telencephalon development | 100/5968 | 248/18723 | 2.90e-03 | 1.44e-02 | 100 |
| GO:002198713 | Thyroid | PTC | cerebral cortex development | 50/5968 | 114/18723 | 4.71e-03 | 2.21e-02 | 50 |
| GO:0098760111 | Thyroid | PTC | response to interleukin-7 | 10/5968 | 15/18723 | 5.94e-03 | 2.64e-02 | 10 |
| GO:0098761111 | Thyroid | PTC | cellular response to interleukin-7 | 10/5968 | 15/18723 | 5.94e-03 | 2.64e-02 | 10 |
| GO:00091236 | Thyroid | PTC | nucleoside monophosphate metabolic process | 35/5968 | 76/18723 | 6.68e-03 | 2.89e-02 | 35 |
| GO:00309007 | Thyroid | PTC | forebrain development | 143/5968 | 379/18723 | 8.47e-03 | 3.56e-02 | 143 |
| GO:001969328 | Thyroid | ATC | ribose phosphate metabolic process | 184/6293 | 396/18723 | 5.87e-08 | 1.05e-06 | 184 |
| GO:000915029 | Thyroid | ATC | purine ribonucleotide metabolic process | 172/6293 | 368/18723 | 9.58e-08 | 1.64e-06 | 172 |
| GO:000925928 | Thyroid | ATC | ribonucleotide metabolic process | 178/6293 | 385/18723 | 1.47e-07 | 2.39e-06 | 178 |
| GO:007252128 | Thyroid | ATC | purine-containing compound metabolic process | 189/6293 | 416/18723 | 2.83e-07 | 4.29e-06 | 189 |
| GO:0006753111 | Thyroid | ATC | nucleoside phosphate metabolic process | 219/6293 | 497/18723 | 5.92e-07 | 8.29e-06 | 219 |
| GO:0009117112 | Thyroid | ATC | nucleotide metabolic process | 215/6293 | 489/18723 | 9.09e-07 | 1.20e-05 | 215 |
| Page: 1 2 3 4 5 6 7 8 9 10 11 12 13 14 15 16 17 |
| Pathway ID | Tissue | Disease Stage | Description | Gene Ratio | Bg Ratio | pvalue | p.adjust | qvalue | Count |
| hsa015232 | Esophagus | ESCC | Antifolate resistance | 22/4205 | 30/8465 | 7.23e-03 | 1.76e-02 | 8.99e-03 | 22 |
| hsa0152311 | Esophagus | ESCC | Antifolate resistance | 22/4205 | 30/8465 | 7.23e-03 | 1.76e-02 | 8.99e-03 | 22 |
| hsa006702 | Liver | HCC | One carbon pool by folate | 17/4020 | 20/8465 | 6.04e-04 | 2.50e-03 | 1.39e-03 | 17 |
| hsa01523 | Liver | HCC | Antifolate resistance | 21/4020 | 30/8465 | 1.06e-02 | 2.71e-02 | 1.51e-02 | 21 |
| hsa0067011 | Liver | HCC | One carbon pool by folate | 17/4020 | 20/8465 | 6.04e-04 | 2.50e-03 | 1.39e-03 | 17 |
| hsa015231 | Liver | HCC | Antifolate resistance | 21/4020 | 30/8465 | 1.06e-02 | 2.71e-02 | 1.51e-02 | 21 |
| Page: 1 |
Top |
Cell-cell communication analysis |
| Identification of potential cell-cell interactions between two cell types and their ligand-receptor pairs for different disease states |
| Ligand | Receptor | LRpair | Pathway | Tissue | Disease Stage |
| Page: 1 |
Top |
Single-cell gene regulatory network inference analysis |
| Find out the significant the regulons (TFs) and the target genes of each regulon across cell types for different disease states |
| TF | Cell Type | Tissue | Disease Stage | Target Gene | RSS | Regulon Activity |
| ∗The dot plots of a searched regulon are shown for all cell subpopulations in each disease state of each tissue based on the regulon specific score inferred using pySCENIC and by calculating the average expression. |
| Page: 1 |
Top |
Somatic mutation of malignant transformation related genes |
| Annotation of somatic variants for genes involved in malignant transformation |
| Hugo Symbol | Variant Class | Variant Classification | dbSNP RS | HGVSc | HGVSp | HGVSp Short | SWISSPROT | BIOTYPE | SIFT | PolyPhen | Tumor Sample Barcode | Tissue | Histology | Sex | Age | Stage | Therapy Types | Drugs | Outcome |
| ATIC | SNV | Missense_Mutation | c.52N>A | p.Val18Met | p.V18M | P31939 | protein_coding | deleterious(0.01) | benign(0.425) | TCGA-AN-A0XS-01 | Breast | breast invasive carcinoma | Female | <65 | III/IV | Unknown | Unknown | SD | |
| ATIC | insertion | Frame_Shift_Ins | novel | c.708dupA | p.Phe237IlefsTer45 | p.F237Ifs*45 | P31939 | protein_coding | TCGA-AN-A0XW-01 | Breast | breast invasive carcinoma | Female | <65 | III/IV | Unknown | Unknown | SD | ||
| ATIC | SNV | Missense_Mutation | rs150438200 | c.784G>A | p.Ala262Thr | p.A262T | P31939 | protein_coding | deleterious(0) | probably_damaging(0.983) | TCGA-2W-A8YY-01 | Cervix | cervical & endocervical cancer | Female | <65 | I/II | Chemotherapy | cisplatin | CR |
| ATIC | SNV | Missense_Mutation | novel | c.1027G>A | p.Ala343Thr | p.A343T | P31939 | protein_coding | deleterious(0) | probably_damaging(0.999) | TCGA-2W-A8YY-01 | Cervix | cervical & endocervical cancer | Female | <65 | I/II | Chemotherapy | cisplatin | CR |
| ATIC | SNV | Missense_Mutation | novel | c.1405C>T | p.His469Tyr | p.H469Y | P31939 | protein_coding | deleterious(0.03) | possibly_damaging(0.663) | TCGA-C5-A902-01 | Cervix | cervical & endocervical cancer | Female | <65 | I/II | Chemotherapy | cisplatin | SD |
| ATIC | SNV | Missense_Mutation | novel | c.1608C>G | p.Ile536Met | p.I536M | P31939 | protein_coding | tolerated(0.05) | benign(0.007) | TCGA-VS-A8QA-01 | Cervix | cervical & endocervical cancer | Female | <65 | I/II | Unknown | Unknown | SD |
| ATIC | SNV | Missense_Mutation | novel | c.1579N>C | p.Trp527Arg | p.W527R | P31939 | protein_coding | deleterious(0) | probably_damaging(1) | TCGA-5M-AAT6-01 | Colorectum | colon adenocarcinoma | Female | <65 | III/IV | Unknown | Unknown | PD |
| ATIC | SNV | Missense_Mutation | rs766526084 | c.515N>A | p.Arg172His | p.R172H | P31939 | protein_coding | deleterious(0) | possibly_damaging(0.582) | TCGA-A6-2686-01 | Colorectum | colon adenocarcinoma | Female | >=65 | I/II | Unknown | Unknown | SD |
| ATIC | SNV | Missense_Mutation | c.1385N>T | p.Ala462Val | p.A462V | P31939 | protein_coding | tolerated(0.18) | benign(0.139) | TCGA-A6-6781-01 | Colorectum | colon adenocarcinoma | Male | <65 | III/IV | Chemotherapy | oxaliplatin | SD | |
| ATIC | SNV | Missense_Mutation | c.403N>A | p.Ala135Thr | p.A135T | P31939 | protein_coding | deleterious(0.02) | probably_damaging(0.999) | TCGA-AA-3492-01 | Colorectum | colon adenocarcinoma | Female | >=65 | I/II | Unknown | Unknown | SD |
| Page: 1 2 3 4 5 6 7 |
Top |
Related drugs of malignant transformation related genes |
| Identification of chemicals and drugs interact with genes involved in malignant transfromation |
| (DGIdb 4.0) |
| Entrez ID | Symbol | Category | Interaction Types | Drug Claim Name | Drug Name | PMIDs |
| 471 | ATIC | ENZYME, DRUGGABLE GENOME, CLINICALLY ACTIONABLE | FOLIC ACID | 9679969 | ||
| 471 | ATIC | ENZYME, DRUGGABLE GENOME, CLINICALLY ACTIONABLE | METHOTREXATE | METHOTREXATE | 3860829 | |
| 471 | ATIC | ENZYME, DRUGGABLE GENOME, CLINICALLY ACTIONABLE | PEMETREXED | PEMETREXED | 24256410 | |
| 471 | ATIC | ENZYME, DRUGGABLE GENOME, CLINICALLY ACTIONABLE | methotrexate | METHOTREXATE | 27885916,18322994,27217051,26799664,25084201,27676277,29520081,16947783,20847201,15457444 |
| Page: 1 |

Copyright 2023-Present -The University of Texas Health Science Center at Houston |