| Tissue | Expression Dynamics | Abbreviation |
| Cervix | 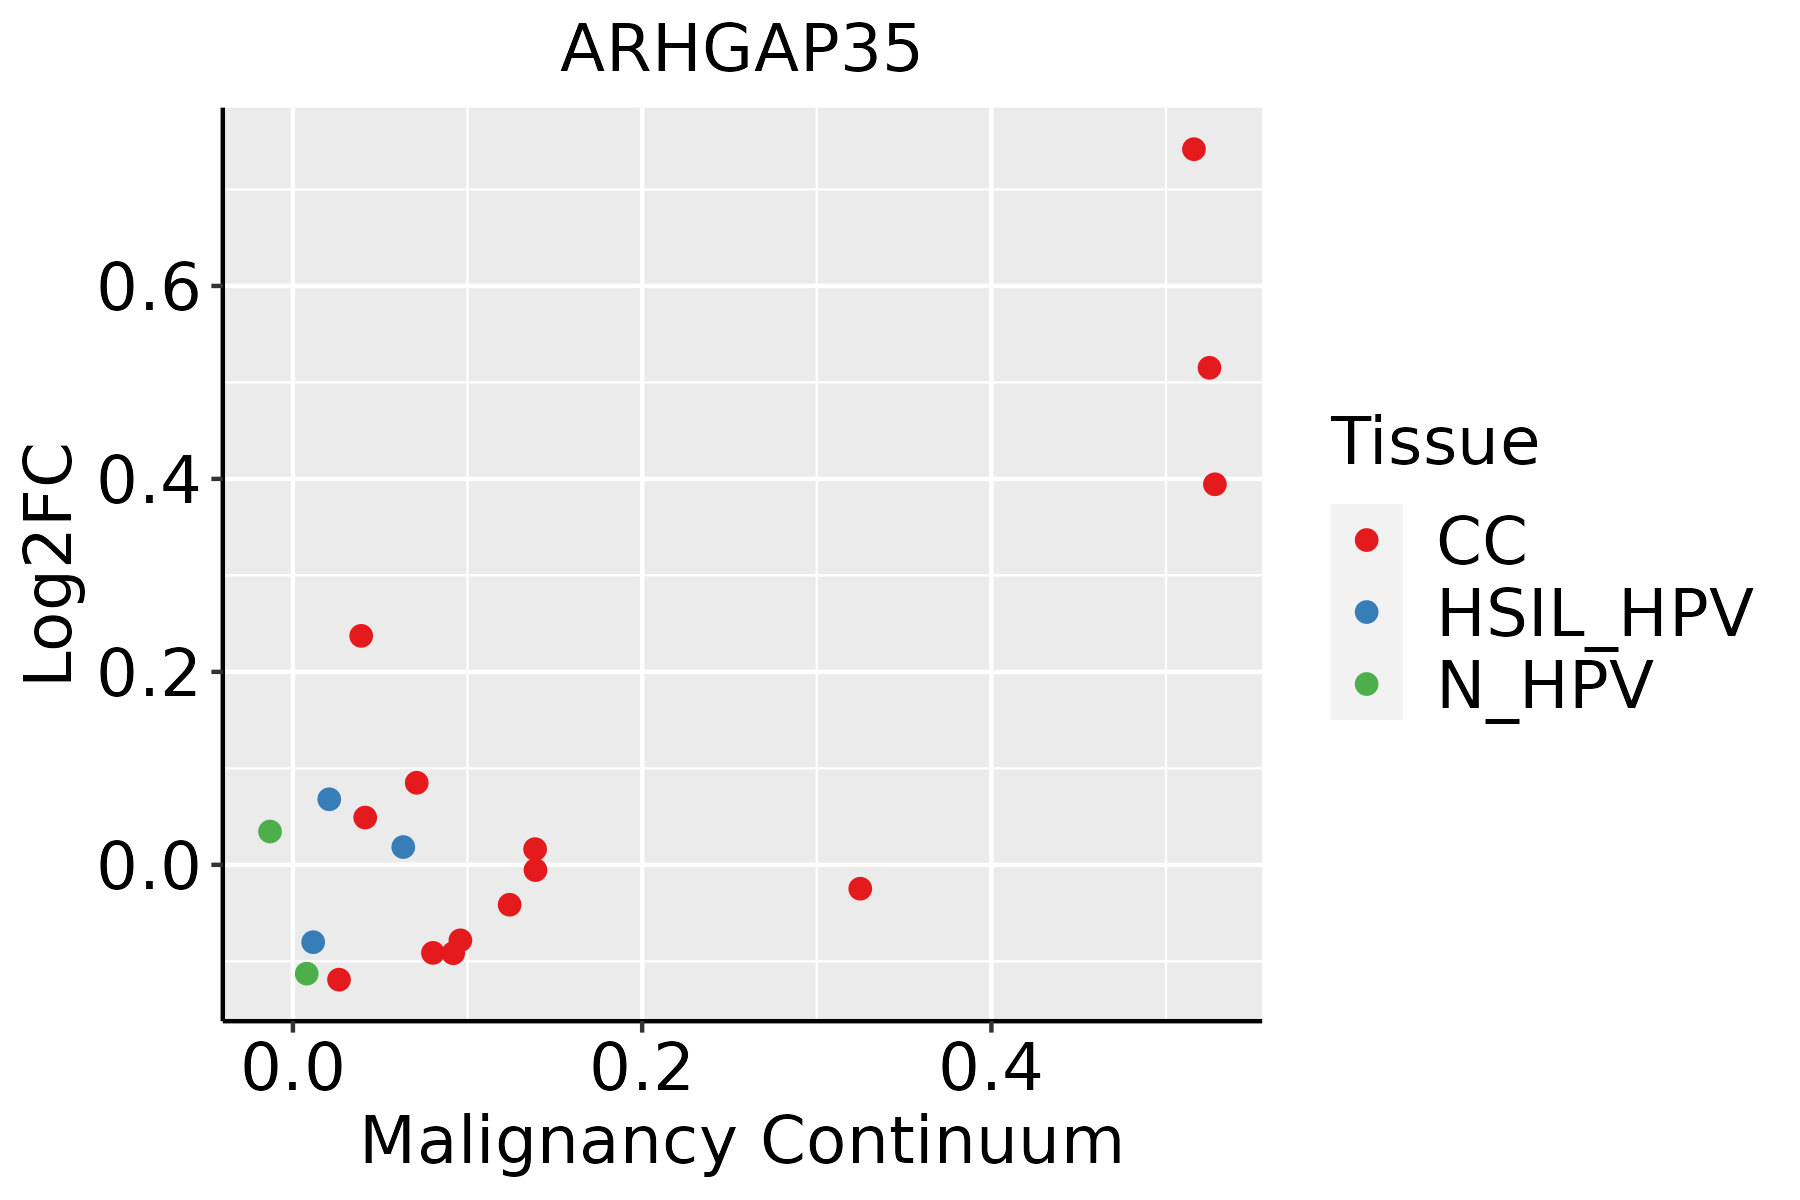 | CC: Cervix cancer |
| HSIL_HPV: HPV-infected high-grade squamous intraepithelial lesions |
| N_HPV: HPV-infected normal cervix |
| Esophagus |  | ESCC: Esophageal squamous cell carcinoma |
| HGIN: High-grade intraepithelial neoplasias |
| LGIN: Low-grade intraepithelial neoplasias |
| Liver |  | HCC: Hepatocellular carcinoma |
| NAFLD: Non-alcoholic fatty liver disease |
| Oral Cavity |  | EOLP: Erosive Oral lichen planus |
| LP: leukoplakia |
| NEOLP: Non-erosive oral lichen planus |
| OSCC: Oral squamous cell carcinoma |
| Prostate | 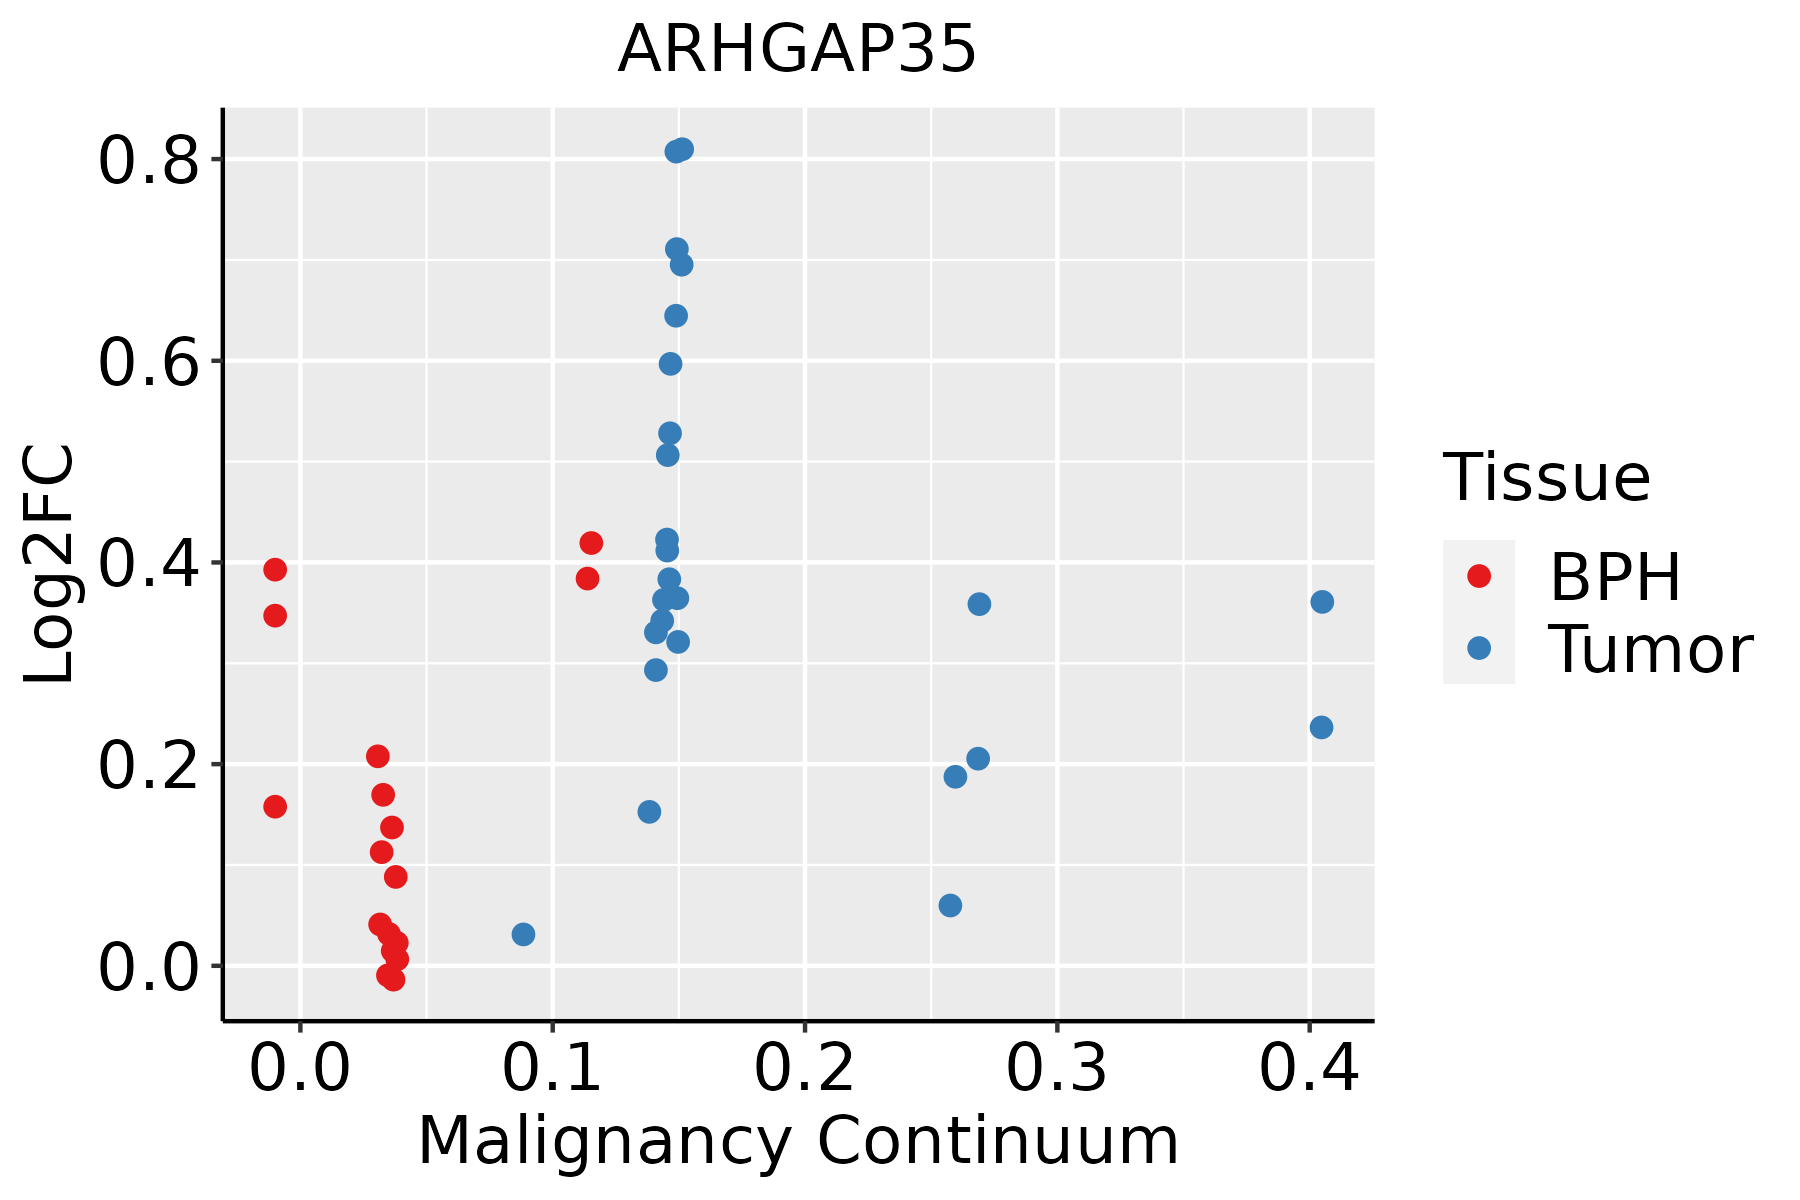 | BPH: Benign Prostatic Hyperplasia |
| Skin | 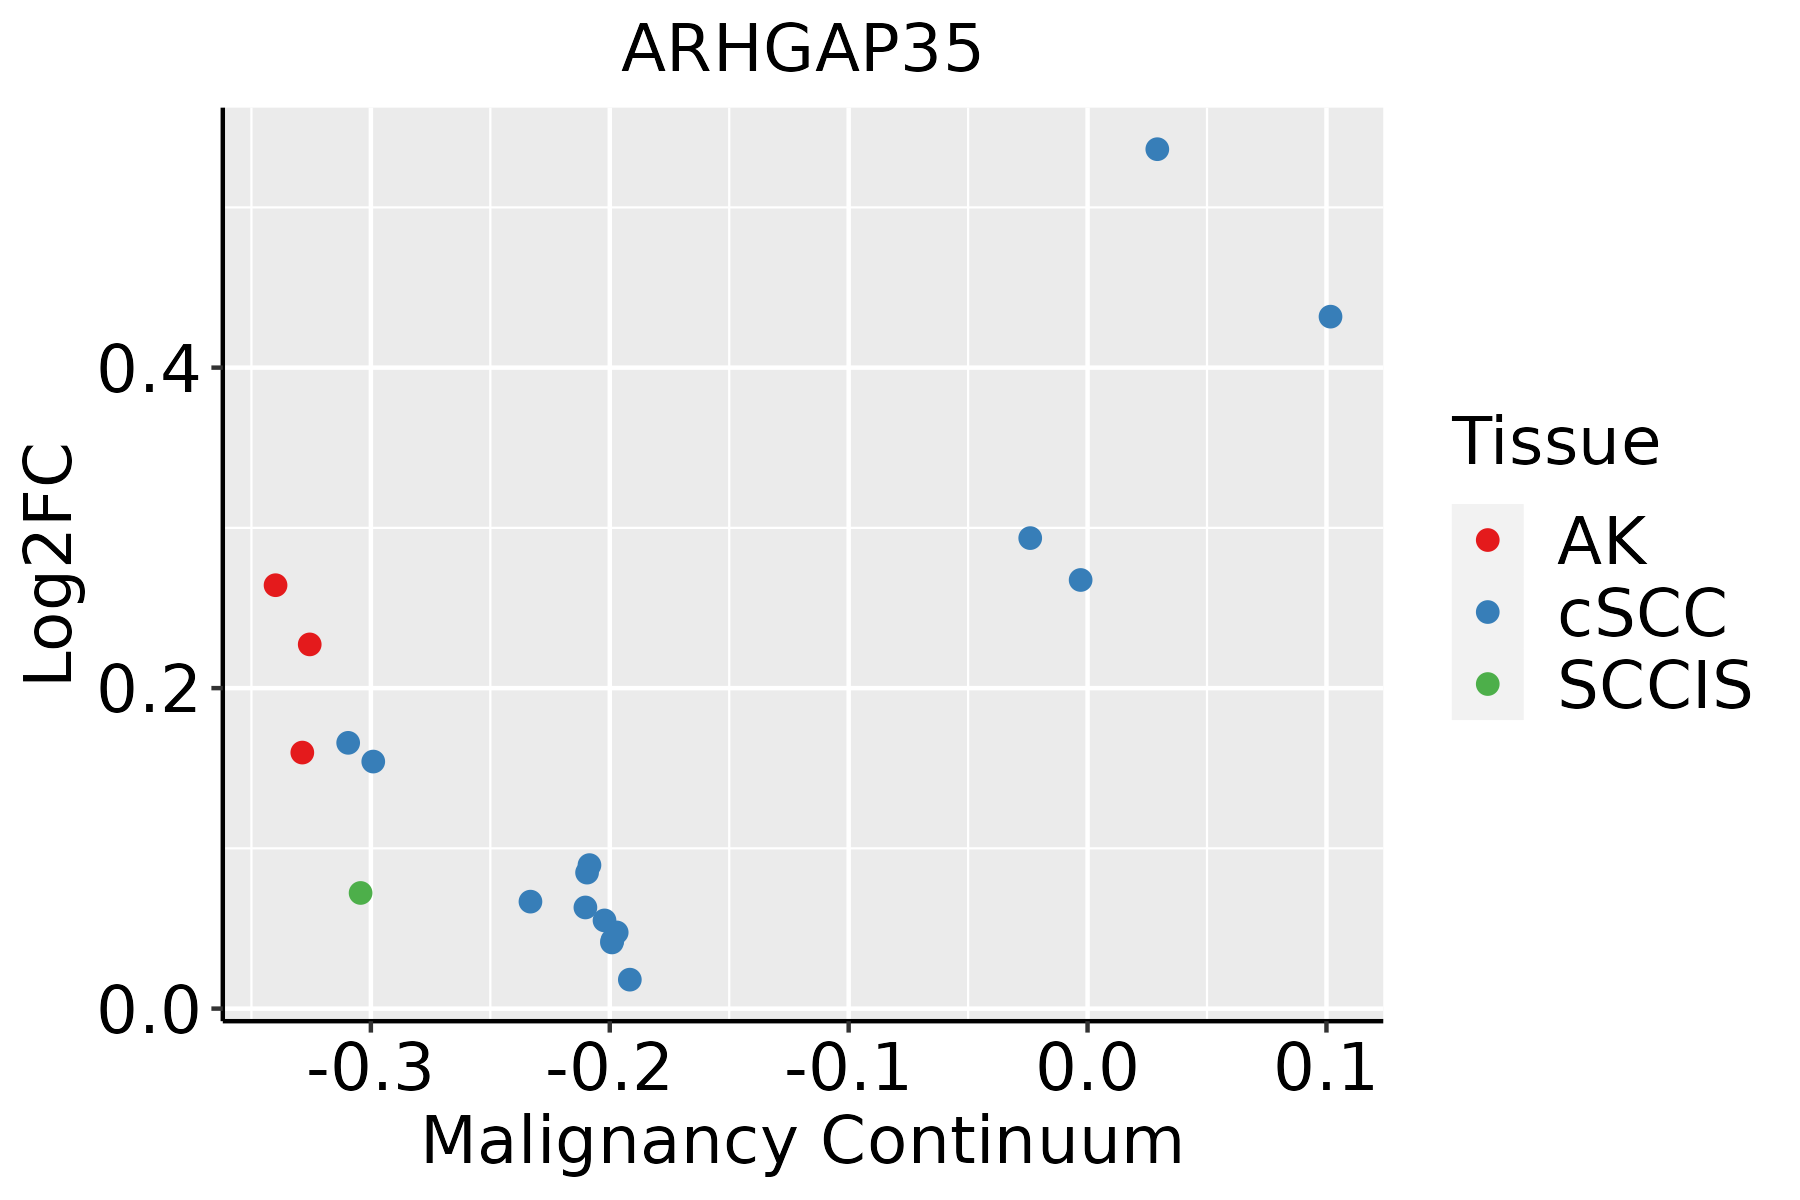 | AK: Actinic keratosis |
| cSCC: Cutaneous squamous cell carcinoma |
| SCCIS:squamous cell carcinoma in situ |
| Thyroid | 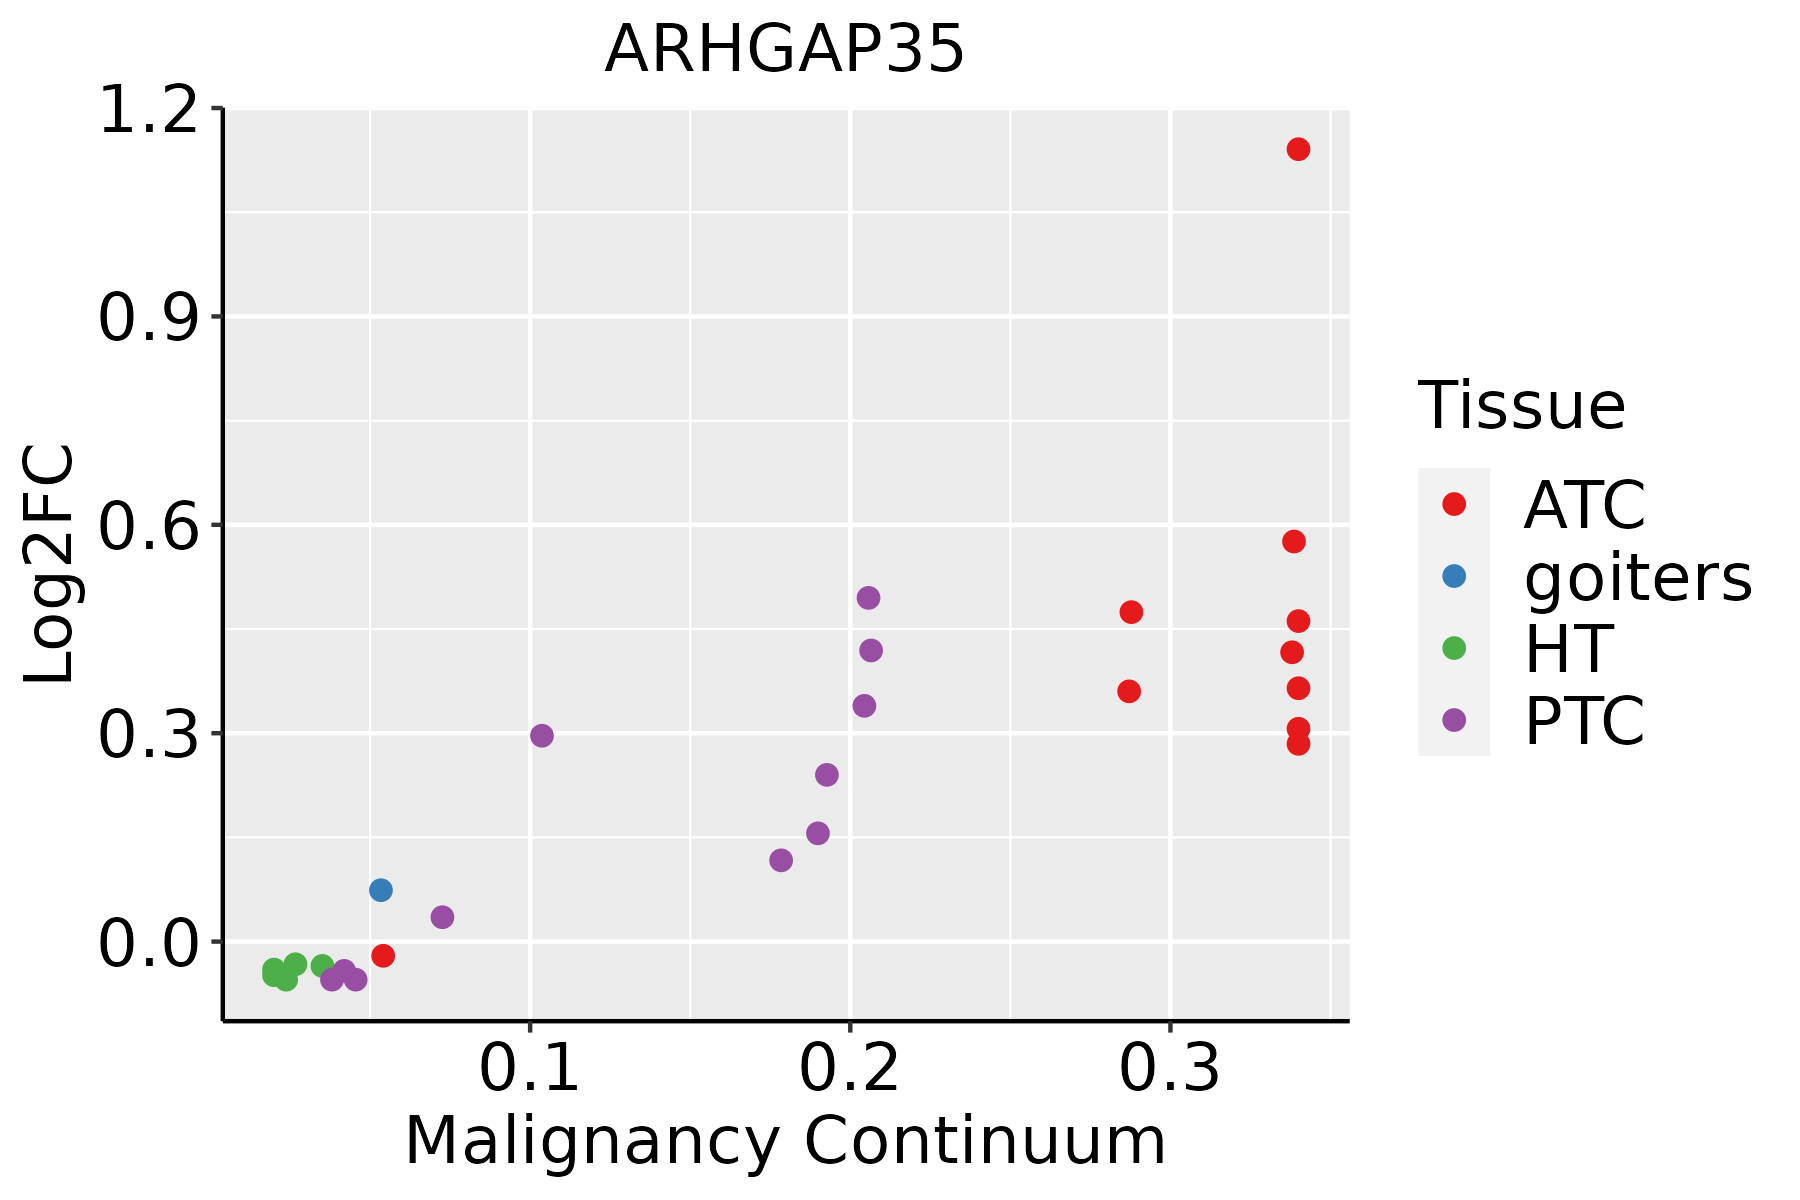 | ATC: Anaplastic thyroid cancer |
| HT: Hashimoto's thyroiditis |
| PTC: Papillary thyroid cancer |
| GO ID | Tissue | Disease Stage | Description | Gene Ratio | Bg Ratio | pvalue | p.adjust | Count |
| GO:011005319 | Prostate | Tumor | regulation of actin filament organization | 94/3246 | 278/18723 | 1.77e-11 | 1.25e-09 | 94 |
| GO:007149619 | Prostate | Tumor | cellular response to external stimulus | 103/3246 | 320/18723 | 5.29e-11 | 3.41e-09 | 103 |
| GO:004206019 | Prostate | Tumor | wound healing | 127/3246 | 422/18723 | 5.32e-11 | 3.41e-09 | 127 |
| GO:000716317 | Prostate | Tumor | establishment or maintenance of cell polarity | 74/3246 | 218/18723 | 2.00e-09 | 8.86e-08 | 74 |
| GO:000726514 | Prostate | Tumor | Ras protein signal transduction | 101/3246 | 337/18723 | 6.29e-09 | 2.44e-07 | 101 |
| GO:003166818 | Prostate | Tumor | cellular response to extracellular stimulus | 78/3246 | 246/18723 | 2.34e-08 | 8.08e-07 | 78 |
| GO:003253518 | Prostate | Tumor | regulation of cellular component size | 109/3246 | 383/18723 | 3.56e-08 | 1.12e-06 | 109 |
| GO:000815417 | Prostate | Tumor | actin polymerization or depolymerization | 70/3246 | 218/18723 | 6.91e-08 | 1.97e-06 | 70 |
| GO:000806416 | Prostate | Tumor | regulation of actin polymerization or depolymerization | 60/3246 | 188/18723 | 7.30e-07 | 1.47e-05 | 60 |
| GO:003083215 | Prostate | Tumor | regulation of actin filament length | 60/3246 | 189/18723 | 8.91e-07 | 1.75e-05 | 60 |
| GO:000836015 | Prostate | Tumor | regulation of cell shape | 51/3246 | 154/18723 | 1.42e-06 | 2.56e-05 | 51 |
| GO:006056214 | Prostate | Tumor | epithelial tube morphogenesis | 90/3246 | 325/18723 | 1.93e-06 | 3.34e-05 | 90 |
| GO:001097514 | Prostate | Tumor | regulation of neuron projection development | 115/3246 | 445/18723 | 3.34e-06 | 5.44e-05 | 115 |
| GO:003134614 | Prostate | Tumor | positive regulation of cell projection organization | 94/3246 | 353/18723 | 6.96e-06 | 1.05e-04 | 94 |
| GO:190211711 | Prostate | Tumor | positive regulation of organelle assembly | 27/3246 | 67/18723 | 7.76e-06 | 1.16e-04 | 27 |
| GO:004431912 | Prostate | Tumor | wound healing, spreading of cells | 17/3246 | 34/18723 | 1.28e-05 | 1.78e-04 | 17 |
| GO:009050512 | Prostate | Tumor | epiboly involved in wound healing | 17/3246 | 34/18723 | 1.28e-05 | 1.78e-04 | 17 |
| GO:009050412 | Prostate | Tumor | epiboly | 17/3246 | 35/18723 | 2.09e-05 | 2.71e-04 | 17 |
| GO:000201112 | Prostate | Tumor | morphogenesis of an epithelial sheet | 23/3246 | 57/18723 | 3.51e-05 | 4.11e-04 | 23 |
| GO:005105613 | Prostate | Tumor | regulation of small GTPase mediated signal transduction | 80/3246 | 302/18723 | 3.96e-05 | 4.57e-04 | 80 |
| Pathway ID | Tissue | Disease Stage | Description | Gene Ratio | Bg Ratio | pvalue | p.adjust | qvalue | Count |
| hsa0451010 | Cervix | CC | Focal adhesion | 59/1267 | 203/8465 | 1.53e-07 | 1.84e-06 | 1.09e-06 | 59 |
| hsa0481016 | Cervix | CC | Regulation of actin cytoskeleton | 64/1267 | 229/8465 | 2.24e-07 | 2.59e-06 | 1.53e-06 | 64 |
| hsa0467020 | Cervix | CC | Leukocyte transendothelial migration | 36/1267 | 114/8465 | 5.22e-06 | 4.83e-05 | 2.86e-05 | 36 |
| hsa046115 | Cervix | CC | Platelet activation | 28/1267 | 124/8465 | 1.50e-02 | 4.45e-02 | 2.63e-02 | 28 |
| hsa0451014 | Cervix | CC | Focal adhesion | 59/1267 | 203/8465 | 1.53e-07 | 1.84e-06 | 1.09e-06 | 59 |
| hsa0481017 | Cervix | CC | Regulation of actin cytoskeleton | 64/1267 | 229/8465 | 2.24e-07 | 2.59e-06 | 1.53e-06 | 64 |
| hsa04670110 | Cervix | CC | Leukocyte transendothelial migration | 36/1267 | 114/8465 | 5.22e-06 | 4.83e-05 | 2.86e-05 | 36 |
| hsa0461113 | Cervix | CC | Platelet activation | 28/1267 | 124/8465 | 1.50e-02 | 4.45e-02 | 2.63e-02 | 28 |
| hsa0451020 | Esophagus | ESCC | Focal adhesion | 127/4205 | 203/8465 | 1.25e-04 | 4.99e-04 | 2.56e-04 | 127 |
| hsa0481028 | Esophagus | ESCC | Regulation of actin cytoskeleton | 133/4205 | 229/8465 | 5.94e-03 | 1.48e-02 | 7.56e-03 | 133 |
| hsa04510111 | Esophagus | ESCC | Focal adhesion | 127/4205 | 203/8465 | 1.25e-04 | 4.99e-04 | 2.56e-04 | 127 |
| hsa04810112 | Esophagus | ESCC | Regulation of actin cytoskeleton | 133/4205 | 229/8465 | 5.94e-03 | 1.48e-02 | 7.56e-03 | 133 |
| hsa0481010 | Liver | NAFLD | Regulation of actin cytoskeleton | 50/1043 | 229/8465 | 3.01e-05 | 7.59e-04 | 6.11e-04 | 50 |
| hsa0467014 | Liver | NAFLD | Leukocyte transendothelial migration | 25/1043 | 114/8465 | 2.65e-03 | 2.71e-02 | 2.19e-02 | 25 |
| hsa045106 | Liver | NAFLD | Focal adhesion | 38/1043 | 203/8465 | 5.13e-03 | 4.43e-02 | 3.57e-02 | 38 |
| hsa0481011 | Liver | NAFLD | Regulation of actin cytoskeleton | 50/1043 | 229/8465 | 3.01e-05 | 7.59e-04 | 6.11e-04 | 50 |
| hsa0467015 | Liver | NAFLD | Leukocyte transendothelial migration | 25/1043 | 114/8465 | 2.65e-03 | 2.71e-02 | 2.19e-02 | 25 |
| hsa0451011 | Liver | NAFLD | Focal adhesion | 38/1043 | 203/8465 | 5.13e-03 | 4.43e-02 | 3.57e-02 | 38 |
| hsa0451021 | Liver | Cirrhotic | Focal adhesion | 93/2530 | 203/8465 | 9.27e-07 | 1.10e-05 | 6.80e-06 | 93 |
| hsa0481021 | Liver | Cirrhotic | Regulation of actin cytoskeleton | 100/2530 | 229/8465 | 5.28e-06 | 5.50e-05 | 3.39e-05 | 100 |
| Hugo Symbol | Variant Class | Variant Classification | dbSNP RS | HGVSc | HGVSp | HGVSp Short | SWISSPROT | BIOTYPE | SIFT | PolyPhen | Tumor Sample Barcode | Tissue | Histology | Sex | Age | Stage | Therapy Types | Drugs | Outcome |
| ARHGAP35 | SNV | Missense_Mutation | novel | c.3966N>C | p.Lys1322Asn | p.K1322N | Q9NRY4 | protein_coding | deleterious(0) | probably_damaging(0.989) | TCGA-5L-AAT1-01 | Breast | breast invasive carcinoma | Female | <65 | III/IV | Hormone Therapy | letrozol | SD |
| ARHGAP35 | SNV | Missense_Mutation | novel | c.2231G>T | p.Arg744Leu | p.R744L | Q9NRY4 | protein_coding | deleterious(0.01) | possibly_damaging(0.82) | TCGA-A2-A0D1-01 | Breast | breast invasive carcinoma | Female | >=65 | I/II | Chemotherapy | taxotere | SD |
| ARHGAP35 | SNV | Missense_Mutation | novel | c.1097N>G | p.Ala366Gly | p.A366G | Q9NRY4 | protein_coding | tolerated(0.08) | possibly_damaging(0.583) | TCGA-A2-A0D2-01 | Breast | breast invasive carcinoma | Female | <65 | I/II | Chemotherapy | adriamycin | SD |
| ARHGAP35 | SNV | Missense_Mutation | rs778118639 | c.1301N>A | p.Arg434Lys | p.R434K | Q9NRY4 | protein_coding | tolerated(1) | benign(0.017) | TCGA-A2-A0D4-01 | Breast | breast invasive carcinoma | Female | <65 | I/II | Chemotherapy | adriamycin | SD |
| ARHGAP35 | SNV | Missense_Mutation | rs376792949 | c.2495N>A | p.Arg832Gln | p.R832Q | Q9NRY4 | protein_coding | deleterious(0.03) | possibly_damaging(0.856) | TCGA-A2-A0EV-01 | Breast | breast invasive carcinoma | Female | >=65 | I/II | Unknown | Unknown | SD |
| ARHGAP35 | SNV | Missense_Mutation | rs751013716 | c.844A>G | p.Ser282Gly | p.S282G | Q9NRY4 | protein_coding | tolerated(0.39) | benign(0.138) | TCGA-AQ-A04H-01 | Breast | breast invasive carcinoma | Female | <65 | III/IV | Chemotherapy | taxotere | SD |
| ARHGAP35 | SNV | Missense_Mutation | | c.4001N>T | p.Pro1334Leu | p.P1334L | Q9NRY4 | protein_coding | deleterious(0) | probably_damaging(0.997) | TCGA-B6-A0IC-01 | Breast | breast invasive carcinoma | Female | >=65 | I/II | Unknown | Unknown | SD |
| ARHGAP35 | SNV | Missense_Mutation | | c.2456N>G | p.Ser819Cys | p.S819C | Q9NRY4 | protein_coding | tolerated(0.06) | possibly_damaging(0.614) | TCGA-BH-A0AY-01 | Breast | breast invasive carcinoma | Female | <65 | I/II | Chemotherapy | | SD |
| ARHGAP35 | SNV | Missense_Mutation | | c.4204N>A | p.Pro1402Thr | p.P1402T | Q9NRY4 | protein_coding | deleterious(0) | probably_damaging(1) | TCGA-BH-A0C0-01 | Breast | breast invasive carcinoma | Female | <65 | I/II | Chemotherapy | carboplatin | SD |
| ARHGAP35 | SNV | Missense_Mutation | | c.3090N>C | p.Glu1030Asp | p.E1030D | Q9NRY4 | protein_coding | tolerated(0.29) | benign(0.283) | TCGA-D8-A1JN-01 | Breast | breast invasive carcinoma | Female | >=65 | III/IV | Hormone Therapy | anastrozolum | SD |


