
|
|||||
|
 | |
| |
| |
| |
| |
| |
|
Gene: TACSTD2 |
Gene summary for TACSTD2 |
| Gene information | Species | Human | Gene symbol | TACSTD2 | Gene ID | 4070 |
| Gene name | tumor associated calcium signal transducer 2 | |
| Gene Alias | EGP-1 | |
| Cytomap | 1p32.1 | |
| Gene Type | protein-coding | GO ID | GO:0000902 | UniProtAcc | P09758 |
Top |
Malignant transformation analysis |
| Identification of the aberrant gene expression in precancerous and cancerous lesions by comparing the gene expression of stem-like cells in diseased tissues with normal stem cells |
| Entrez ID | Symbol | Replicates | Species | Organ | Tissue | Adj P-value | Log2FC | Malignancy |
| 4070 | TACSTD2 | GSM4909281 | Human | Breast | IDC | 8.47e-31 | -8.82e-01 | 0.21 |
| 4070 | TACSTD2 | GSM4909282 | Human | Breast | IDC | 1.32e-21 | 4.71e-01 | -0.0288 |
| 4070 | TACSTD2 | GSM4909285 | Human | Breast | IDC | 7.61e-09 | 1.01e-01 | 0.21 |
| 4070 | TACSTD2 | GSM4909286 | Human | Breast | IDC | 1.90e-83 | -1.49e+00 | 0.1081 |
| 4070 | TACSTD2 | GSM4909288 | Human | Breast | IDC | 2.86e-06 | -7.81e-01 | 0.0988 |
| 4070 | TACSTD2 | GSM4909290 | Human | Breast | IDC | 2.22e-26 | -8.21e-01 | 0.2096 |
| 4070 | TACSTD2 | GSM4909291 | Human | Breast | IDC | 1.10e-24 | -1.00e+00 | 0.1753 |
| 4070 | TACSTD2 | GSM4909292 | Human | Breast | IDC | 3.41e-04 | -9.50e-01 | 0.1236 |
| 4070 | TACSTD2 | GSM4909293 | Human | Breast | IDC | 1.83e-33 | -7.57e-01 | 0.1581 |
| 4070 | TACSTD2 | GSM4909294 | Human | Breast | IDC | 1.34e-26 | -8.61e-01 | 0.2022 |
| 4070 | TACSTD2 | GSM4909296 | Human | Breast | IDC | 2.23e-23 | -7.87e-01 | 0.1524 |
| 4070 | TACSTD2 | GSM4909297 | Human | Breast | IDC | 3.79e-07 | -5.30e-01 | 0.1517 |
| 4070 | TACSTD2 | GSM4909298 | Human | Breast | IDC | 4.47e-27 | -6.79e-01 | 0.1551 |
| 4070 | TACSTD2 | GSM4909300 | Human | Breast | IDC | 2.04e-02 | 3.32e-01 | 0.0334 |
| 4070 | TACSTD2 | GSM4909301 | Human | Breast | IDC | 7.48e-20 | -6.41e-01 | 0.1577 |
| 4070 | TACSTD2 | GSM4909302 | Human | Breast | IDC | 9.22e-18 | -6.63e-01 | 0.1545 |
| 4070 | TACSTD2 | GSM4909304 | Human | Breast | IDC | 5.32e-47 | -1.01e+00 | 0.1636 |
| 4070 | TACSTD2 | GSM4909305 | Human | Breast | IDC | 7.21e-04 | 1.61e-01 | 0.0436 |
| 4070 | TACSTD2 | GSM4909306 | Human | Breast | IDC | 2.82e-11 | -3.19e-01 | 0.1564 |
| 4070 | TACSTD2 | GSM4909307 | Human | Breast | IDC | 1.86e-18 | -7.36e-01 | 0.1569 |
| Page: 1 2 3 4 5 6 7 8 9 10 11 12 13 14 15 16 |
| Tissue | Expression Dynamics | Abbreviation |
| Breast |  | IDC: Invasive ductal carcinoma |
| DCIS: Ductal carcinoma in situ | ||
| Precancer(BRCA1-mut): Precancerous lesion from BRCA1 mutation carriers | ||
| Cervix | 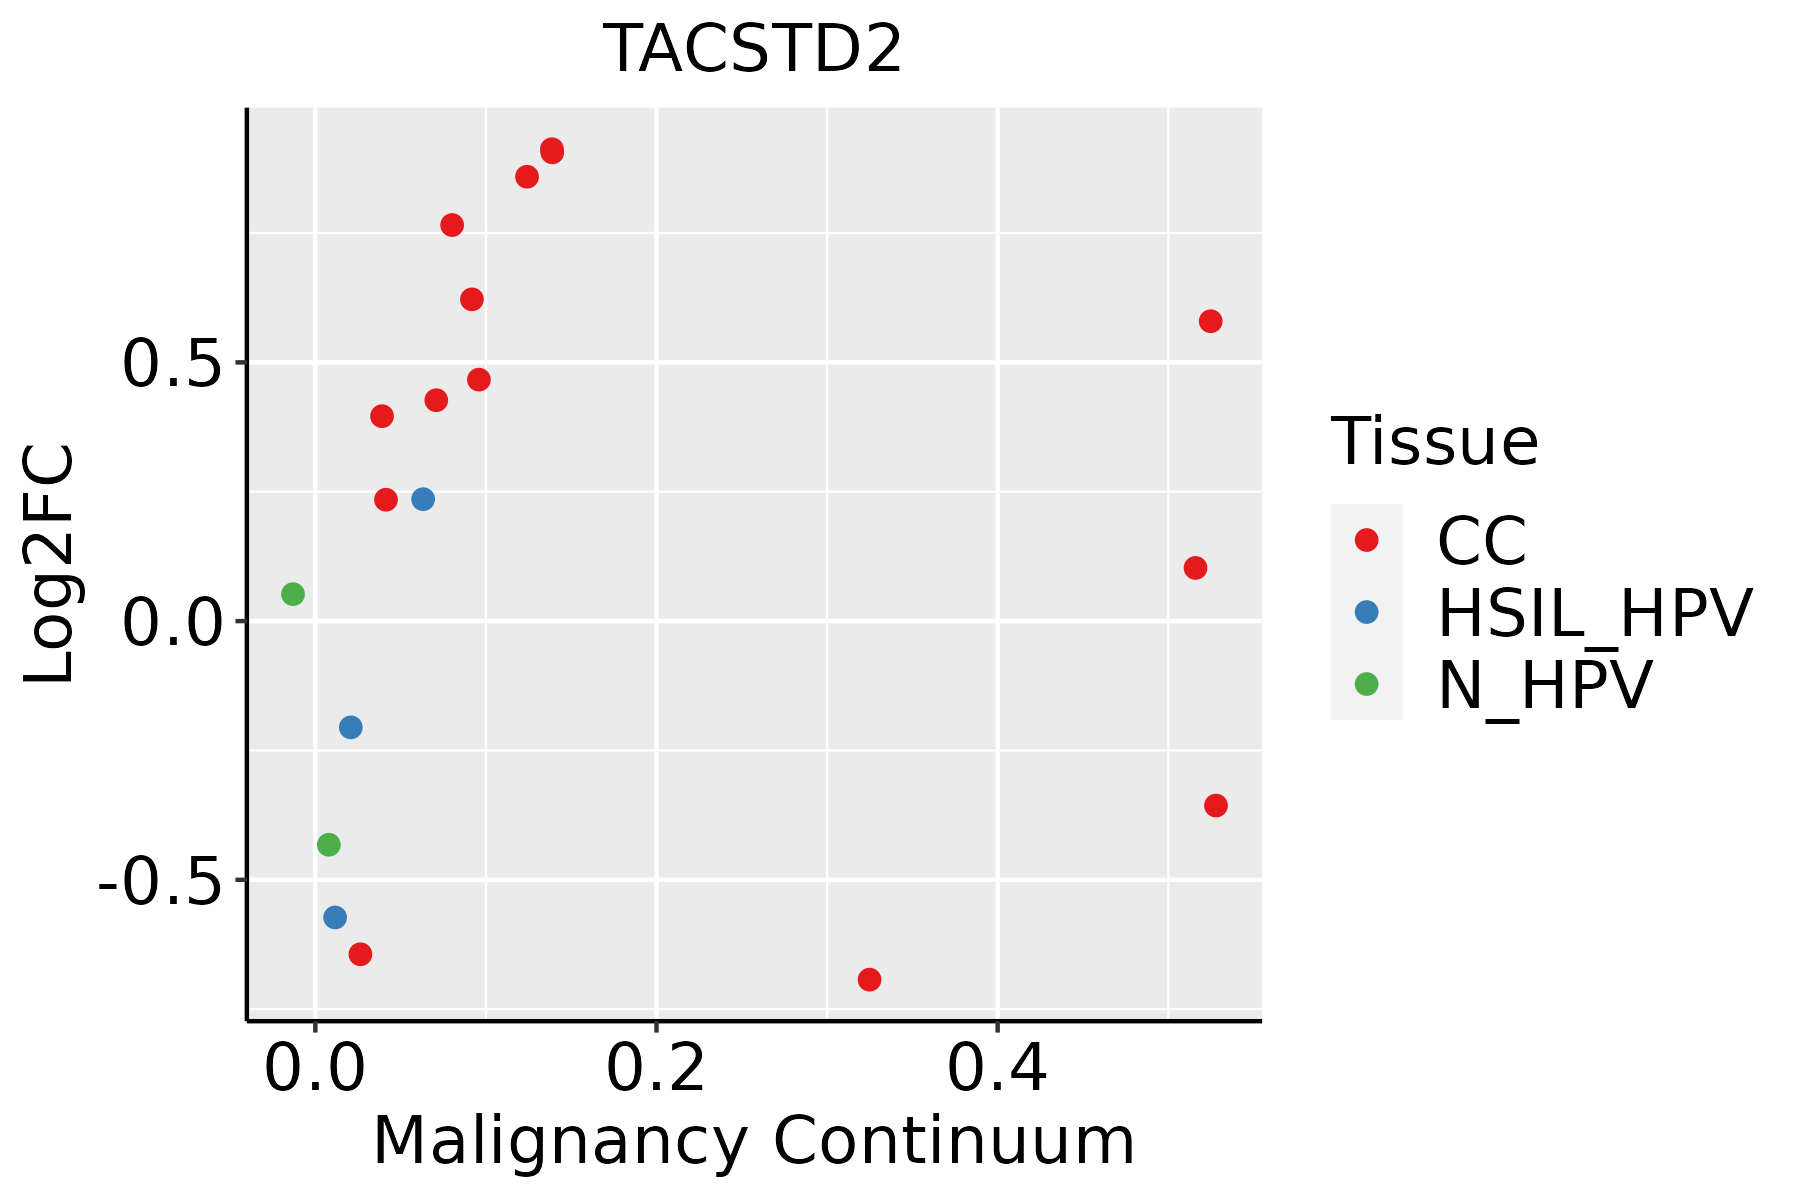 | CC: Cervix cancer |
| HSIL_HPV: HPV-infected high-grade squamous intraepithelial lesions | ||
| N_HPV: HPV-infected normal cervix | ||
| Endometrium | 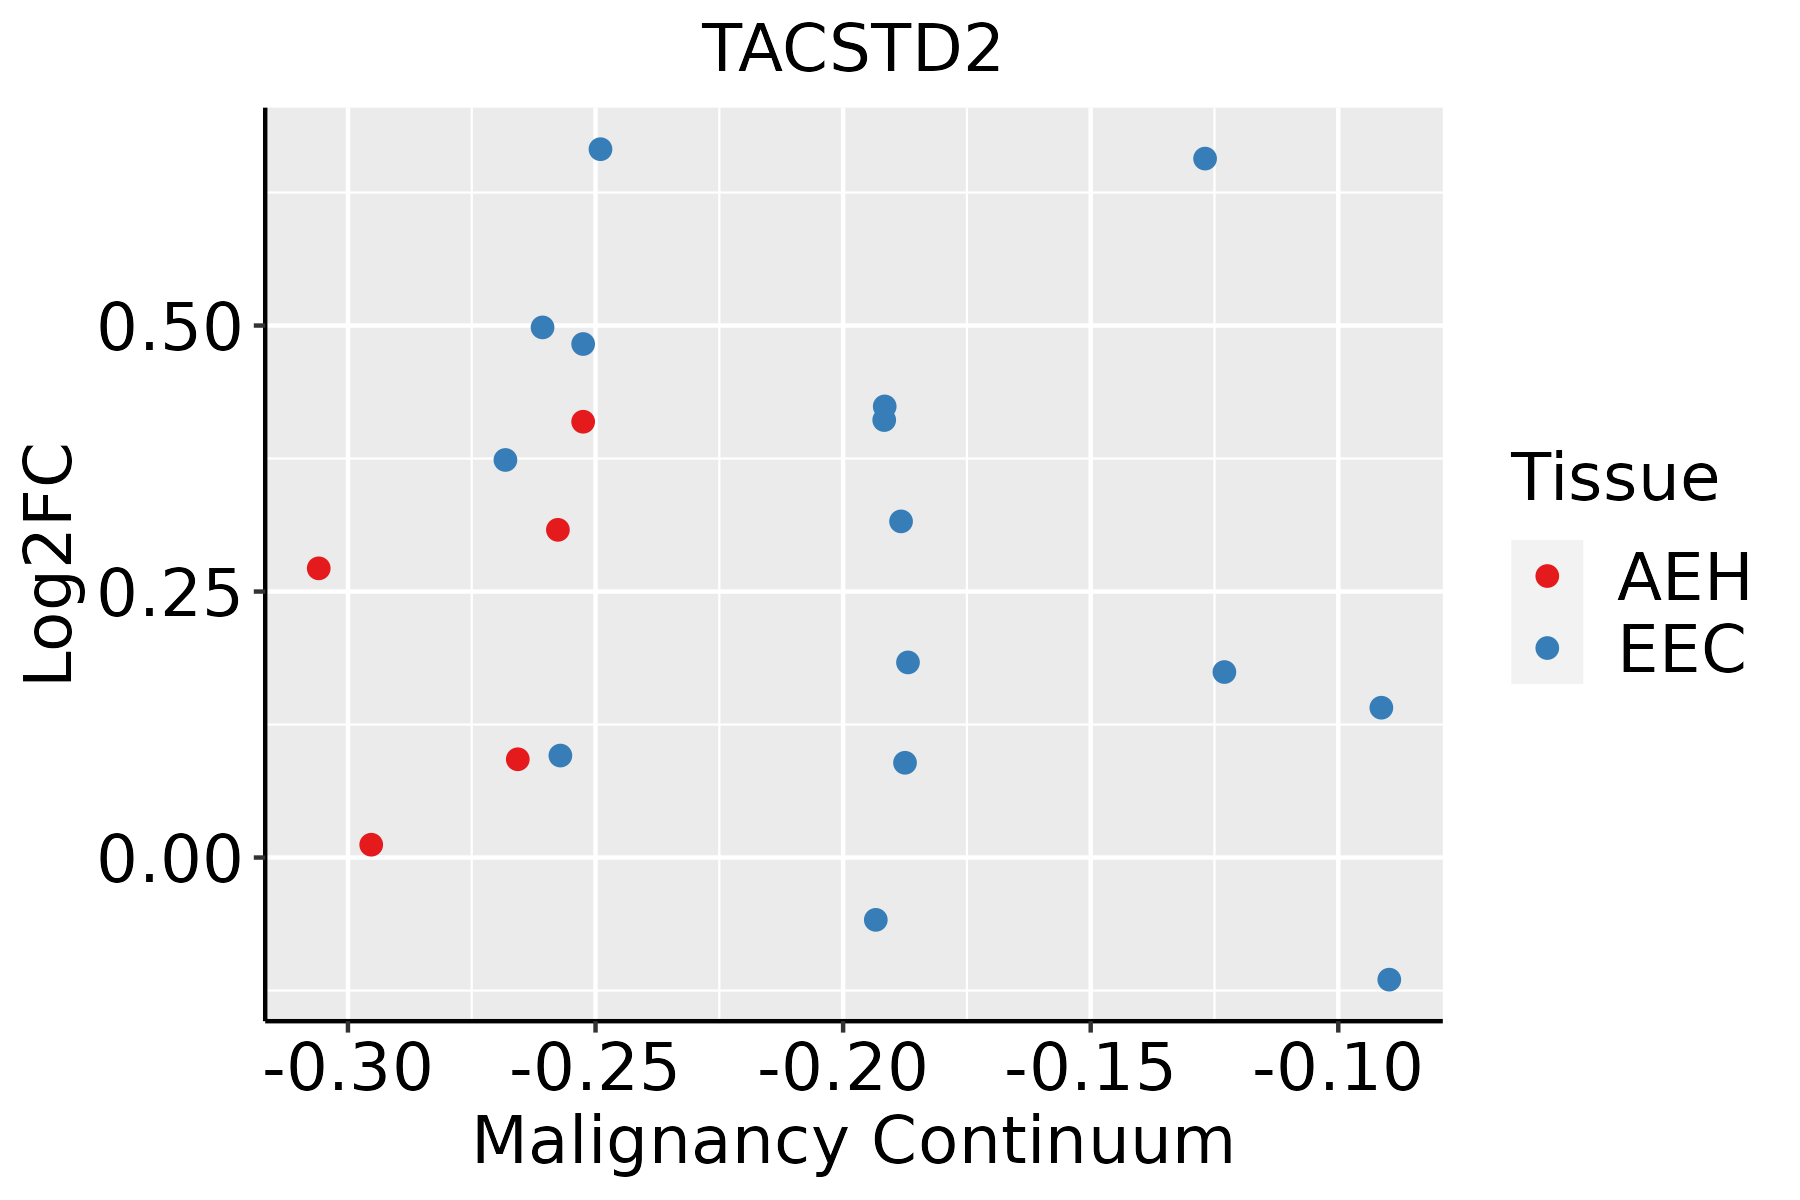 | AEH: Atypical endometrial hyperplasia |
| EEC: Endometrioid Cancer | ||
| Esophagus | 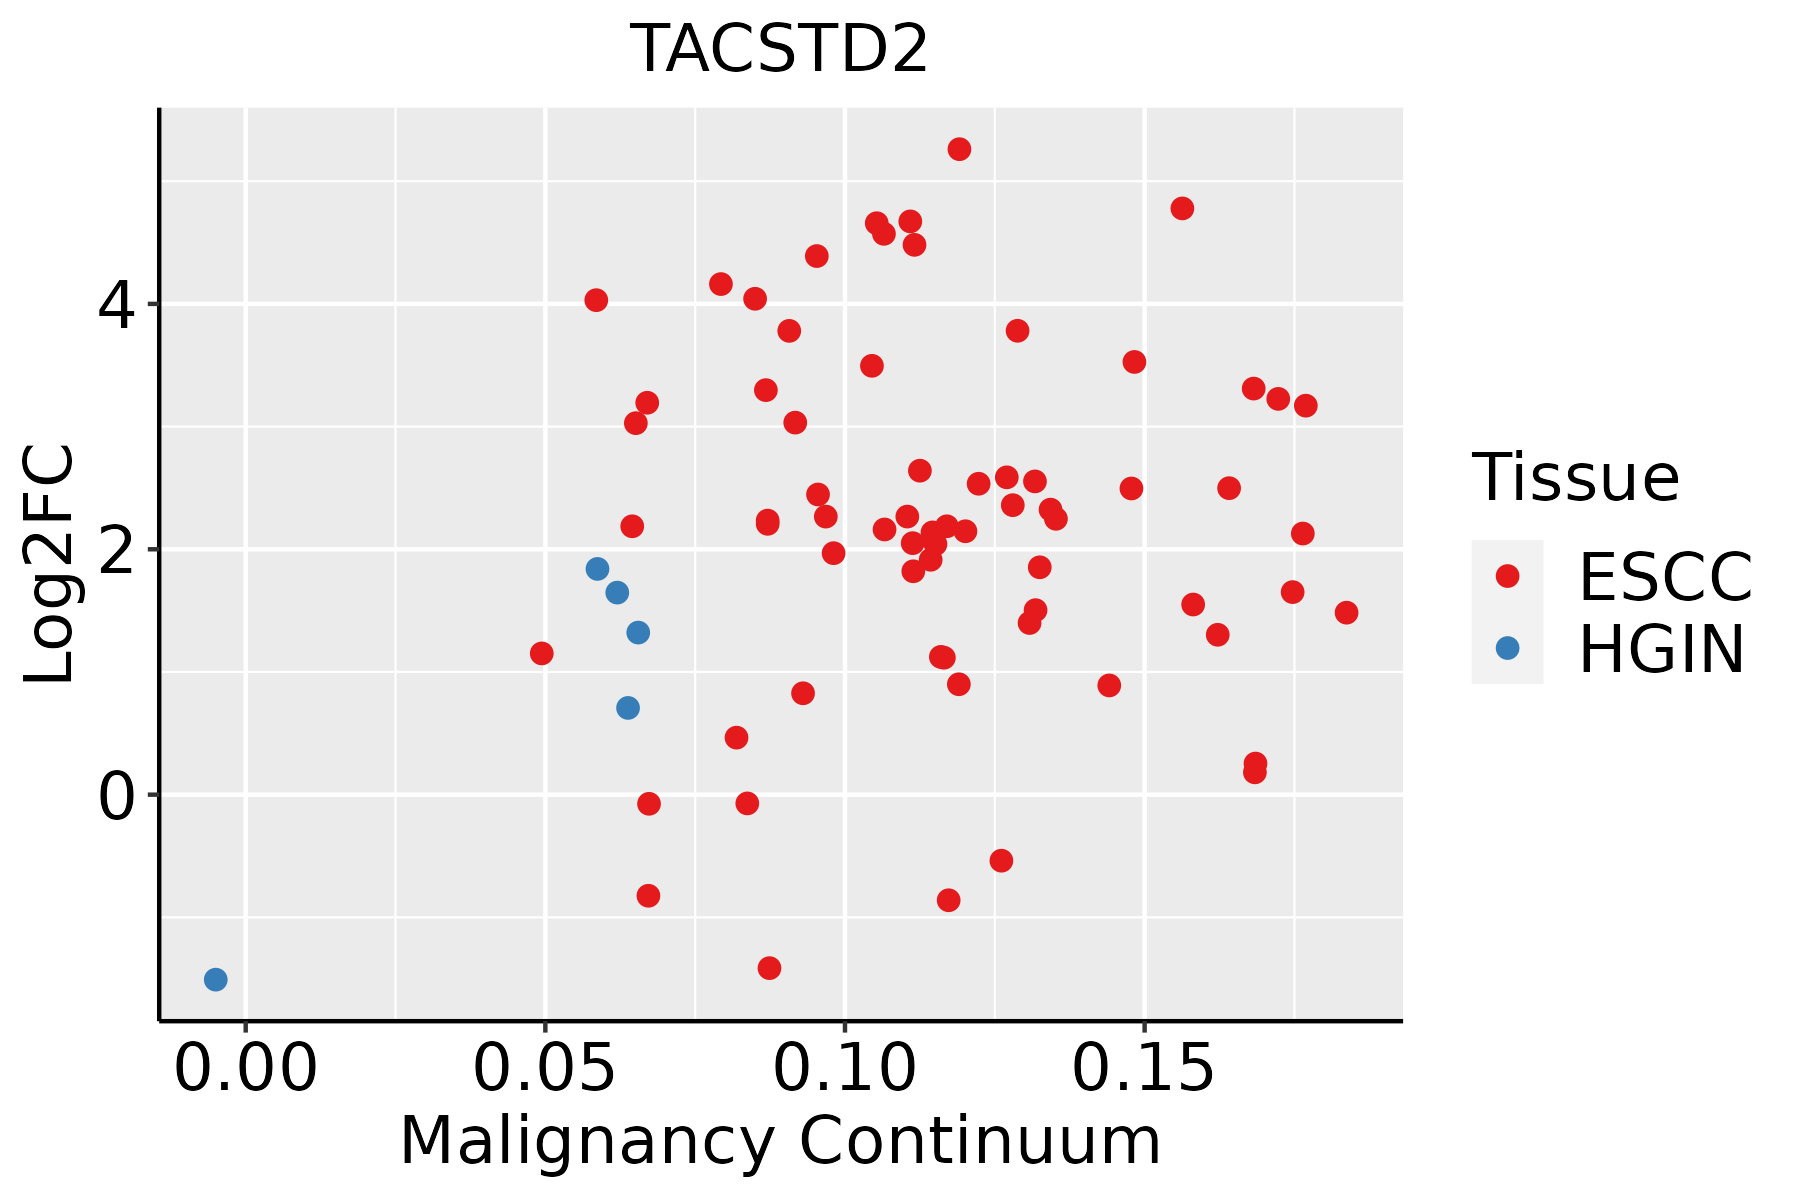 | ESCC: Esophageal squamous cell carcinoma |
| HGIN: High-grade intraepithelial neoplasias | ||
| LGIN: Low-grade intraepithelial neoplasias | ||
| GC | 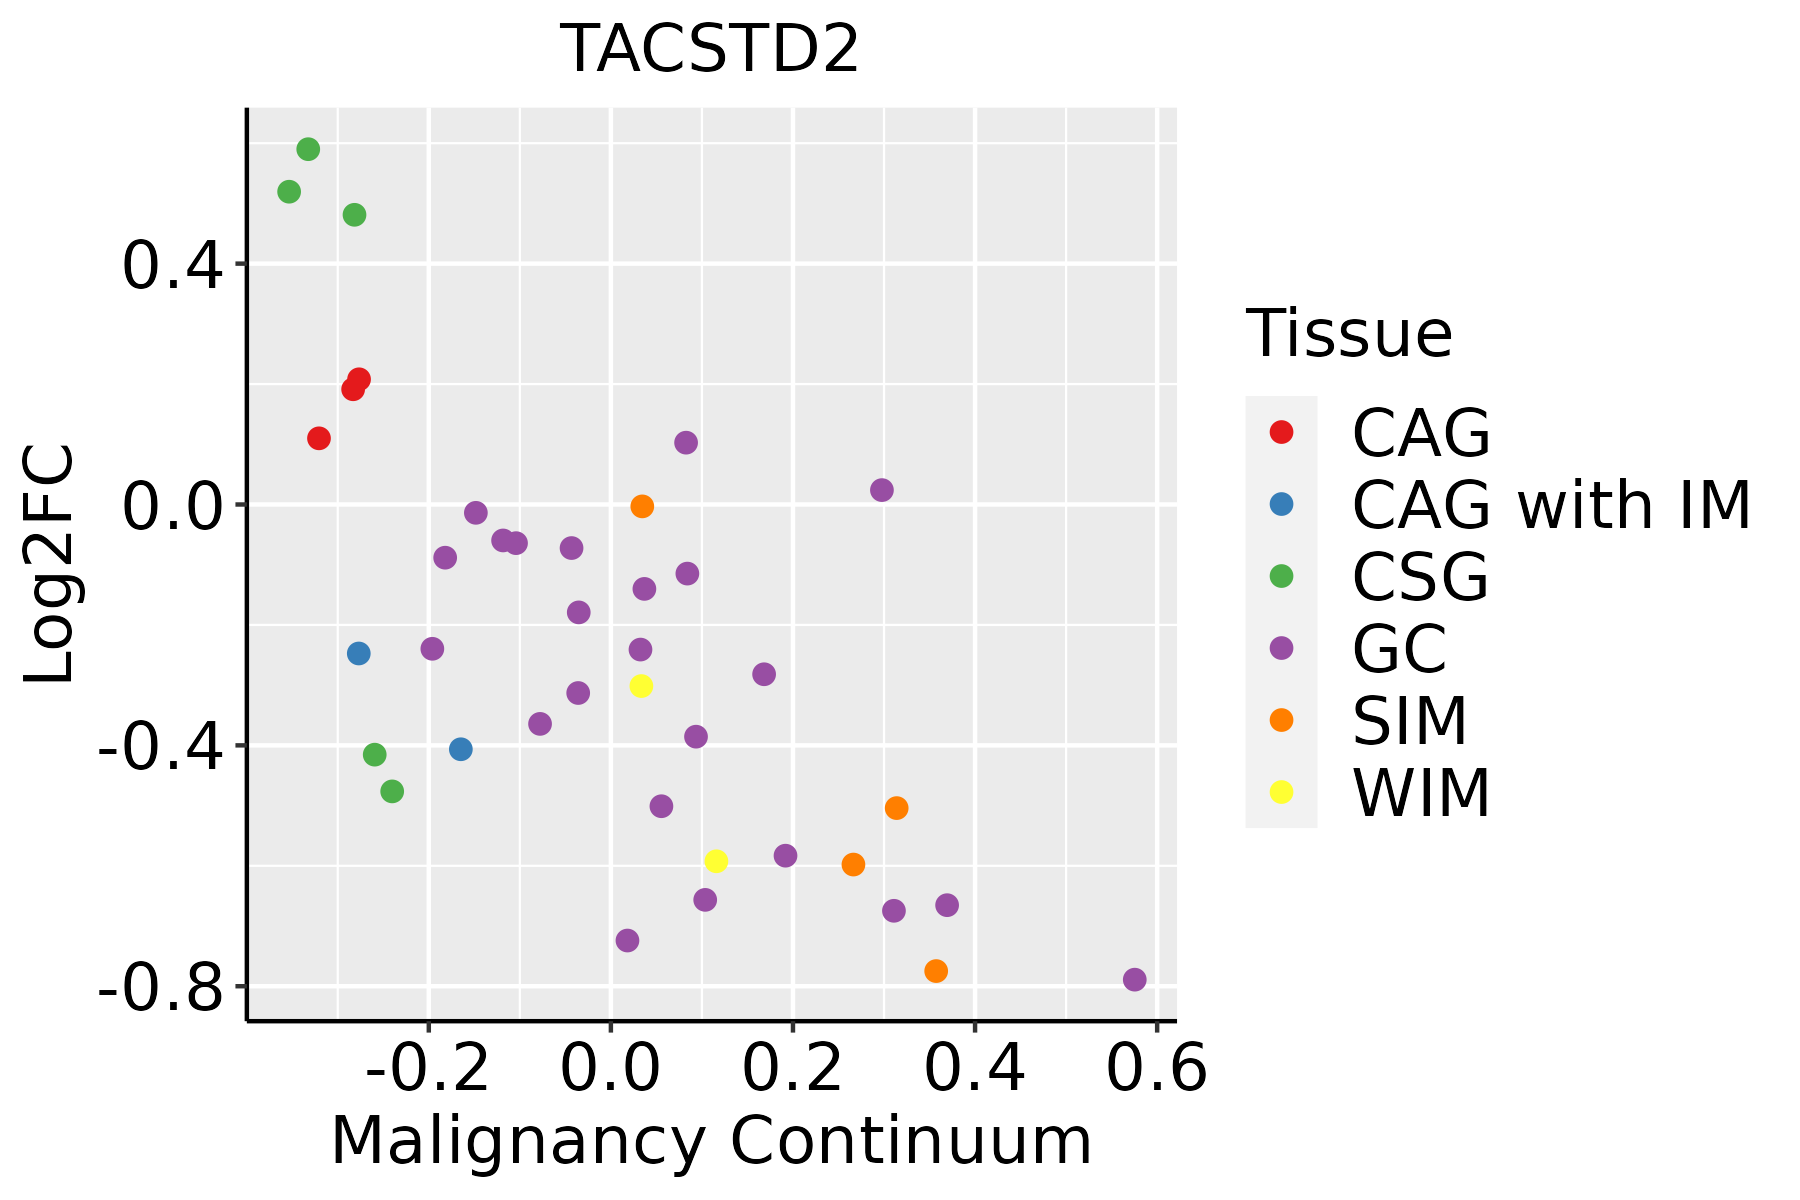 | CAG: Chronic atrophic gastritis |
| CAG with IM: Chronic atrophic gastritis with intestinal metaplasia | ||
| CSG: Chronic superficial gastritis | ||
| GC: Gastric cancer | ||
| SIM: Severe intestinal metaplasia | ||
| WIM: Wild intestinal metaplasia | ||
| Liver | 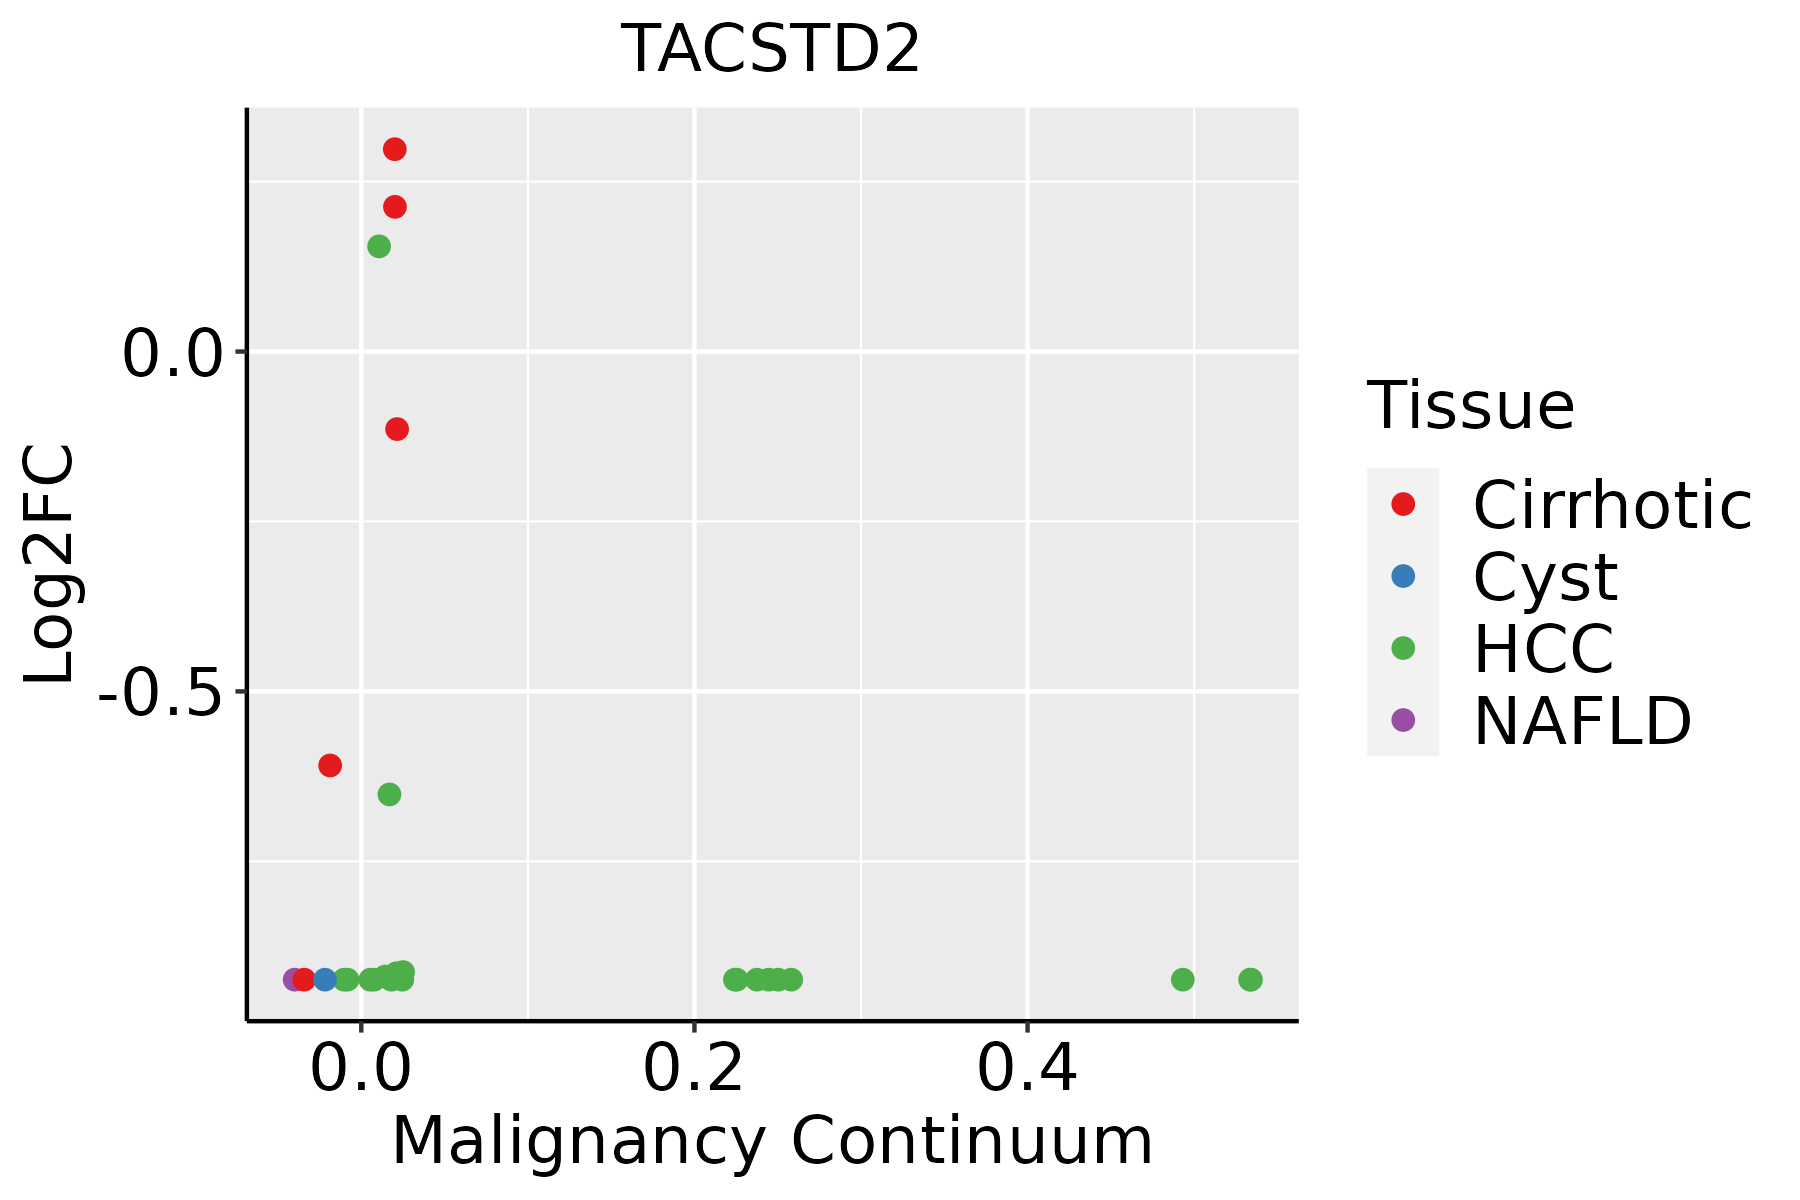 | HCC: Hepatocellular carcinoma |
| NAFLD: Non-alcoholic fatty liver disease | ||
| Lung |  | AAH: Atypical adenomatous hyperplasia |
| AIS: Adenocarcinoma in situ | ||
| IAC: Invasive lung adenocarcinoma | ||
| MIA: Minimally invasive adenocarcinoma | ||
| Oral Cavity | 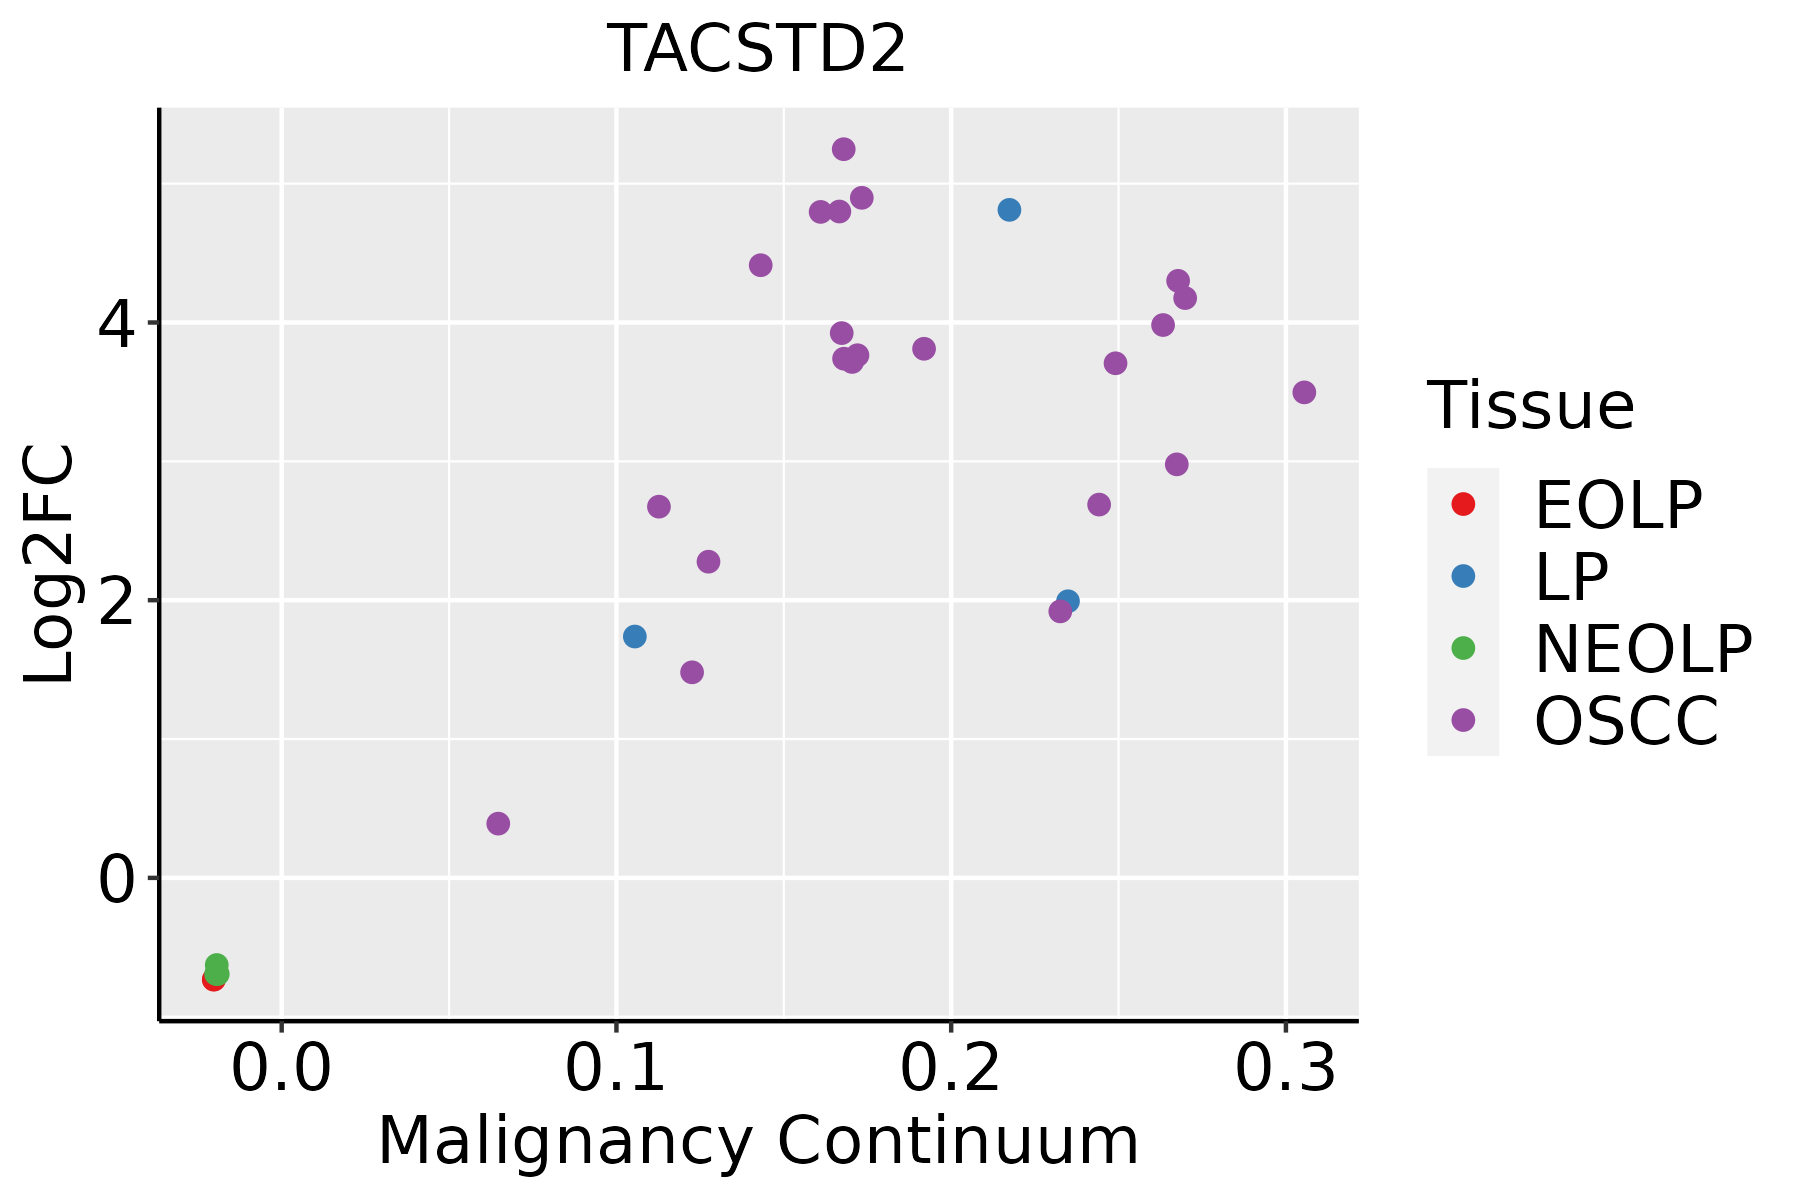 | EOLP: Erosive Oral lichen planus |
| LP: leukoplakia | ||
| NEOLP: Non-erosive oral lichen planus | ||
| OSCC: Oral squamous cell carcinoma | ||
| Prostate | 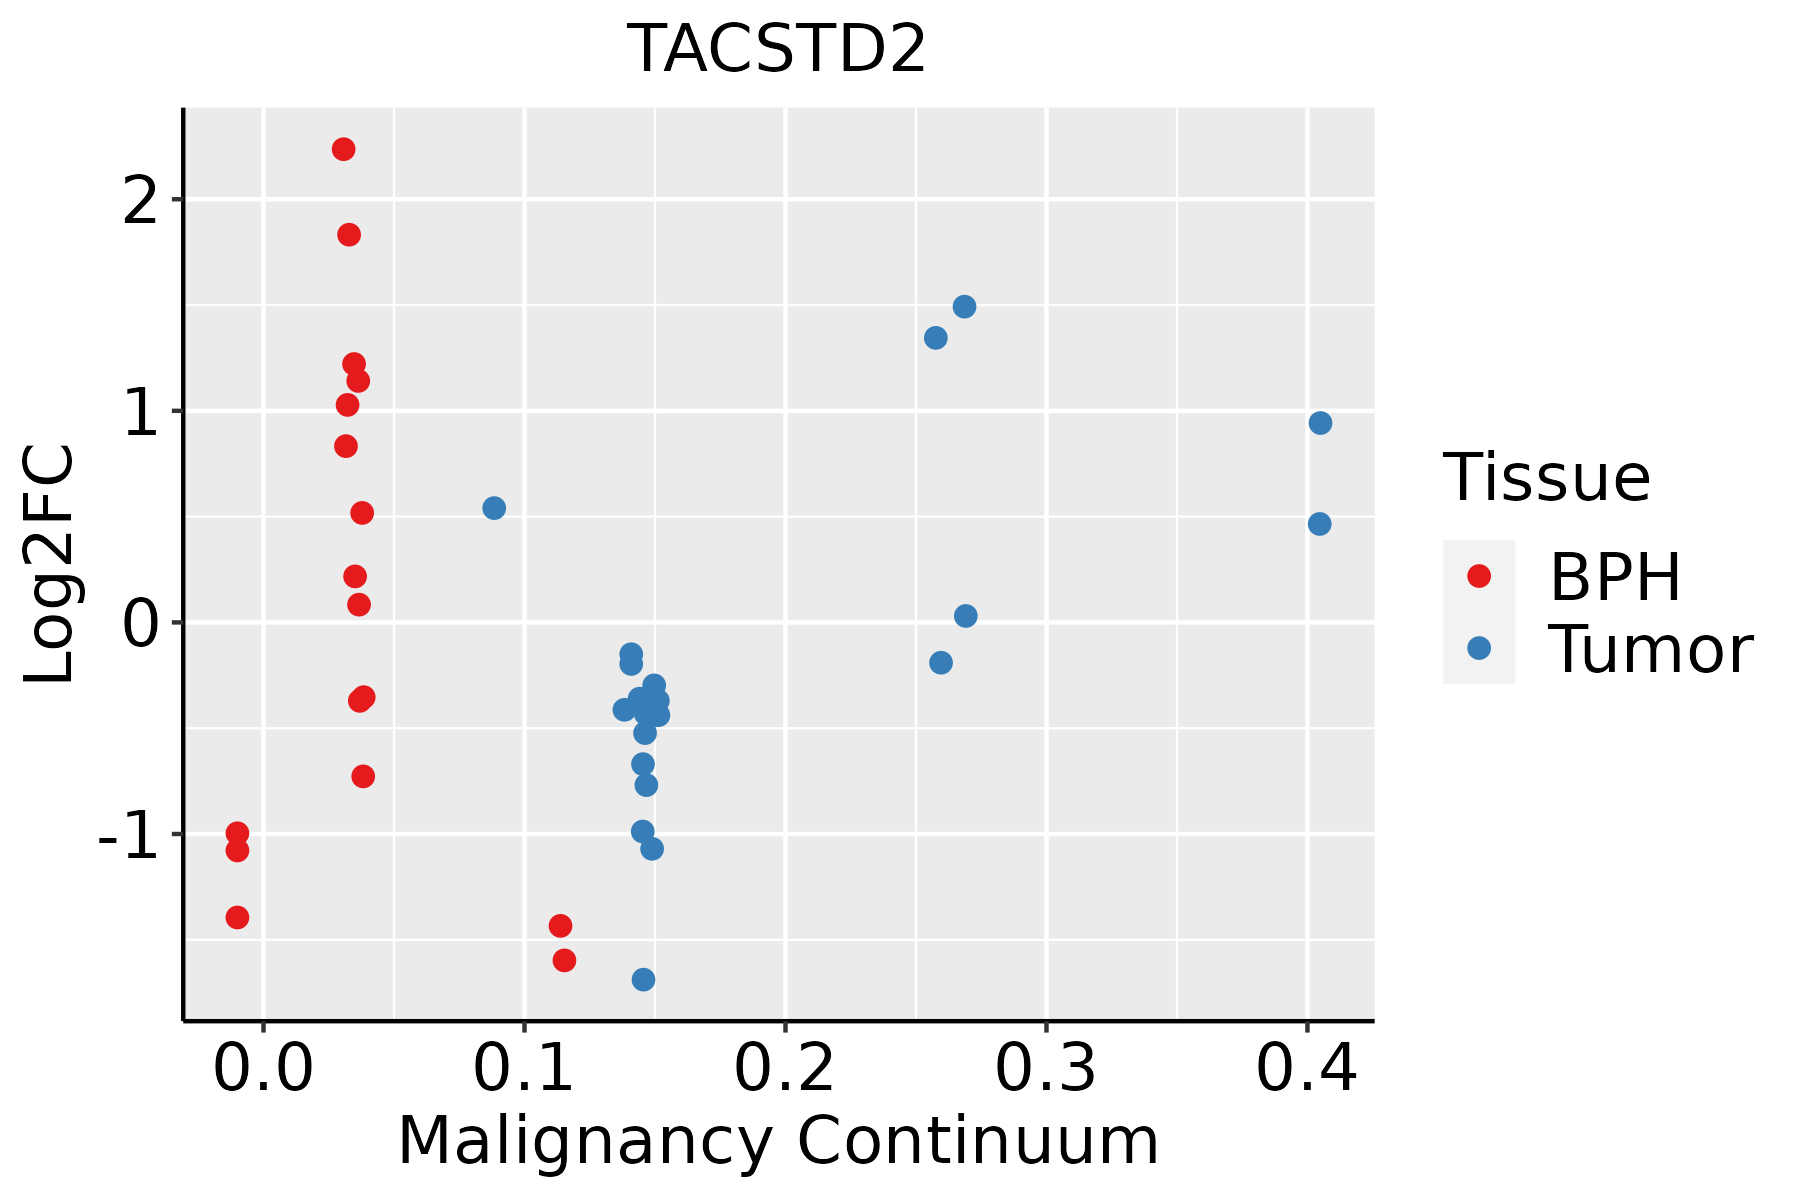 | BPH: Benign Prostatic Hyperplasia |
| Skin | 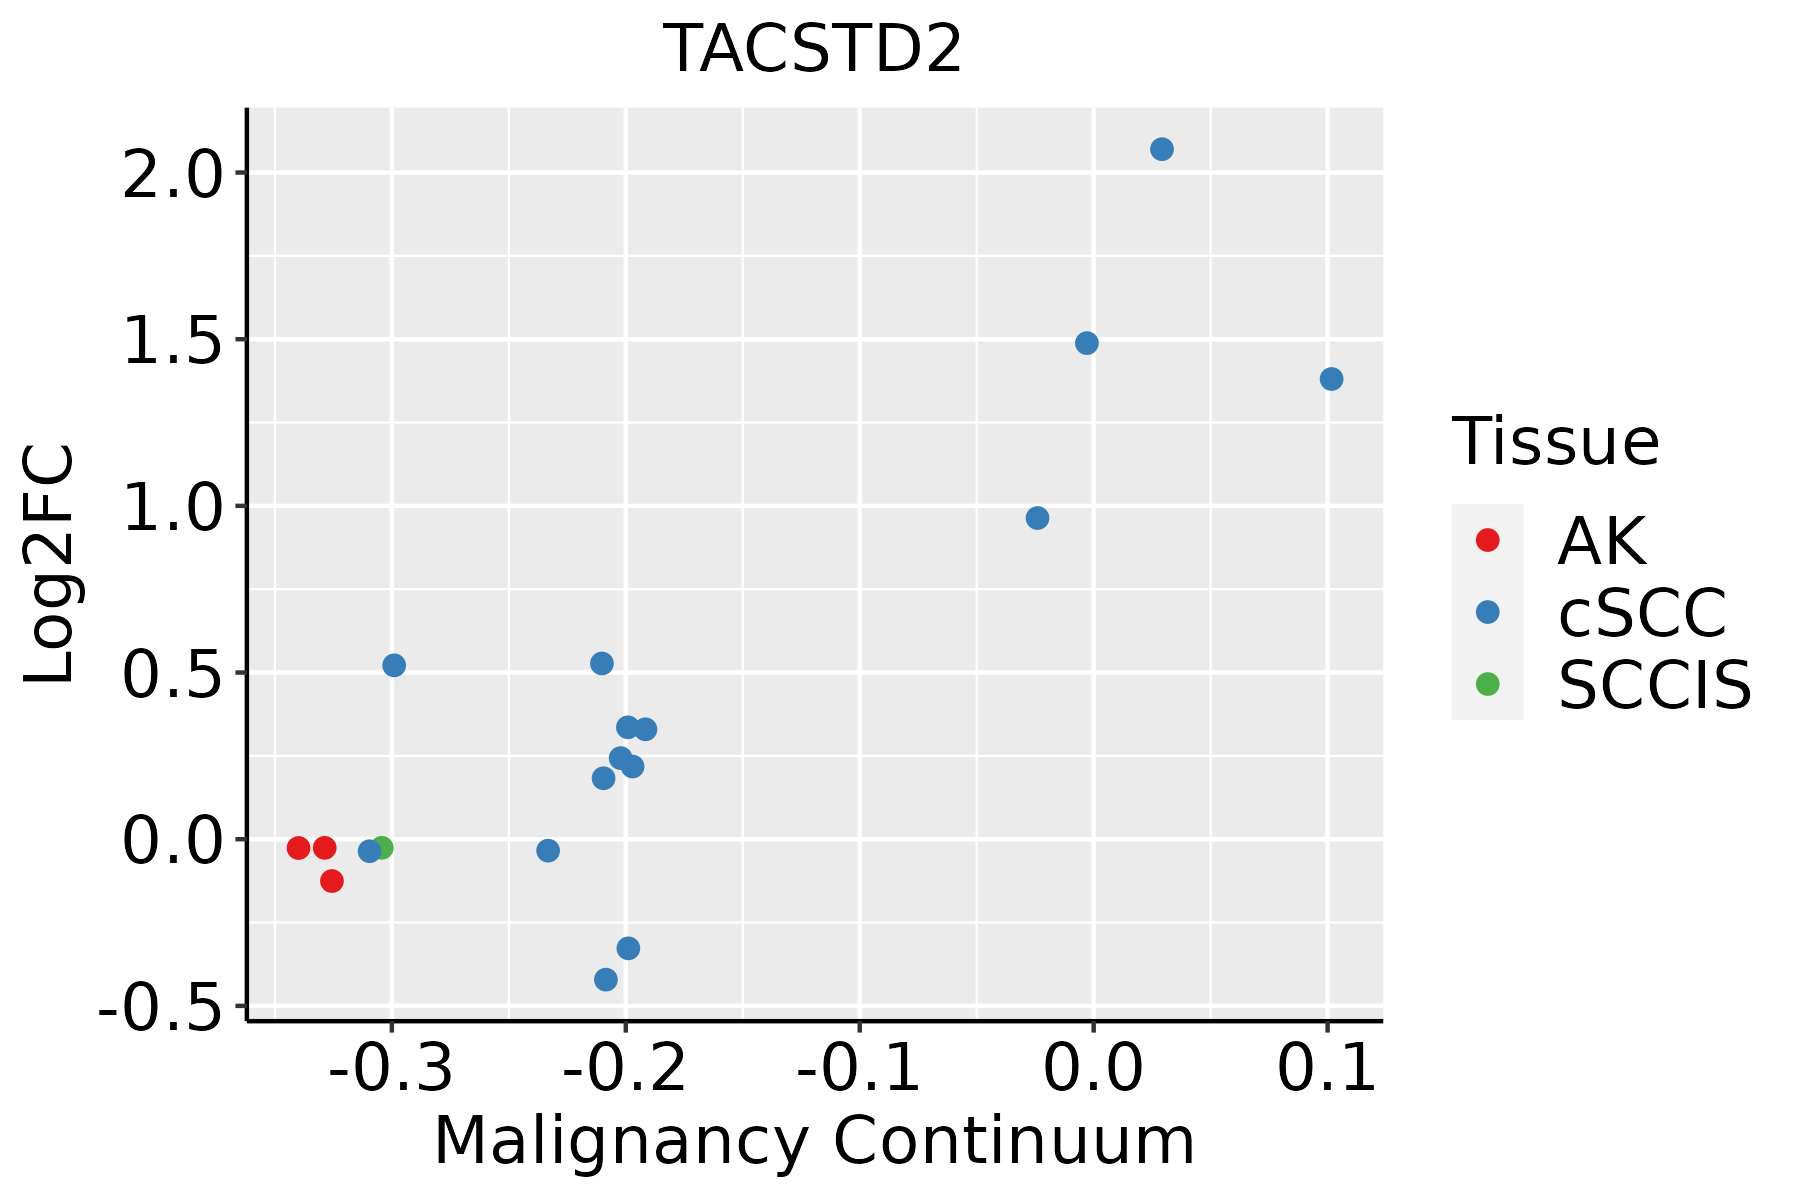 | AK: Actinic keratosis |
| cSCC: Cutaneous squamous cell carcinoma | ||
| SCCIS:squamous cell carcinoma in situ | ||
| Thyroid | 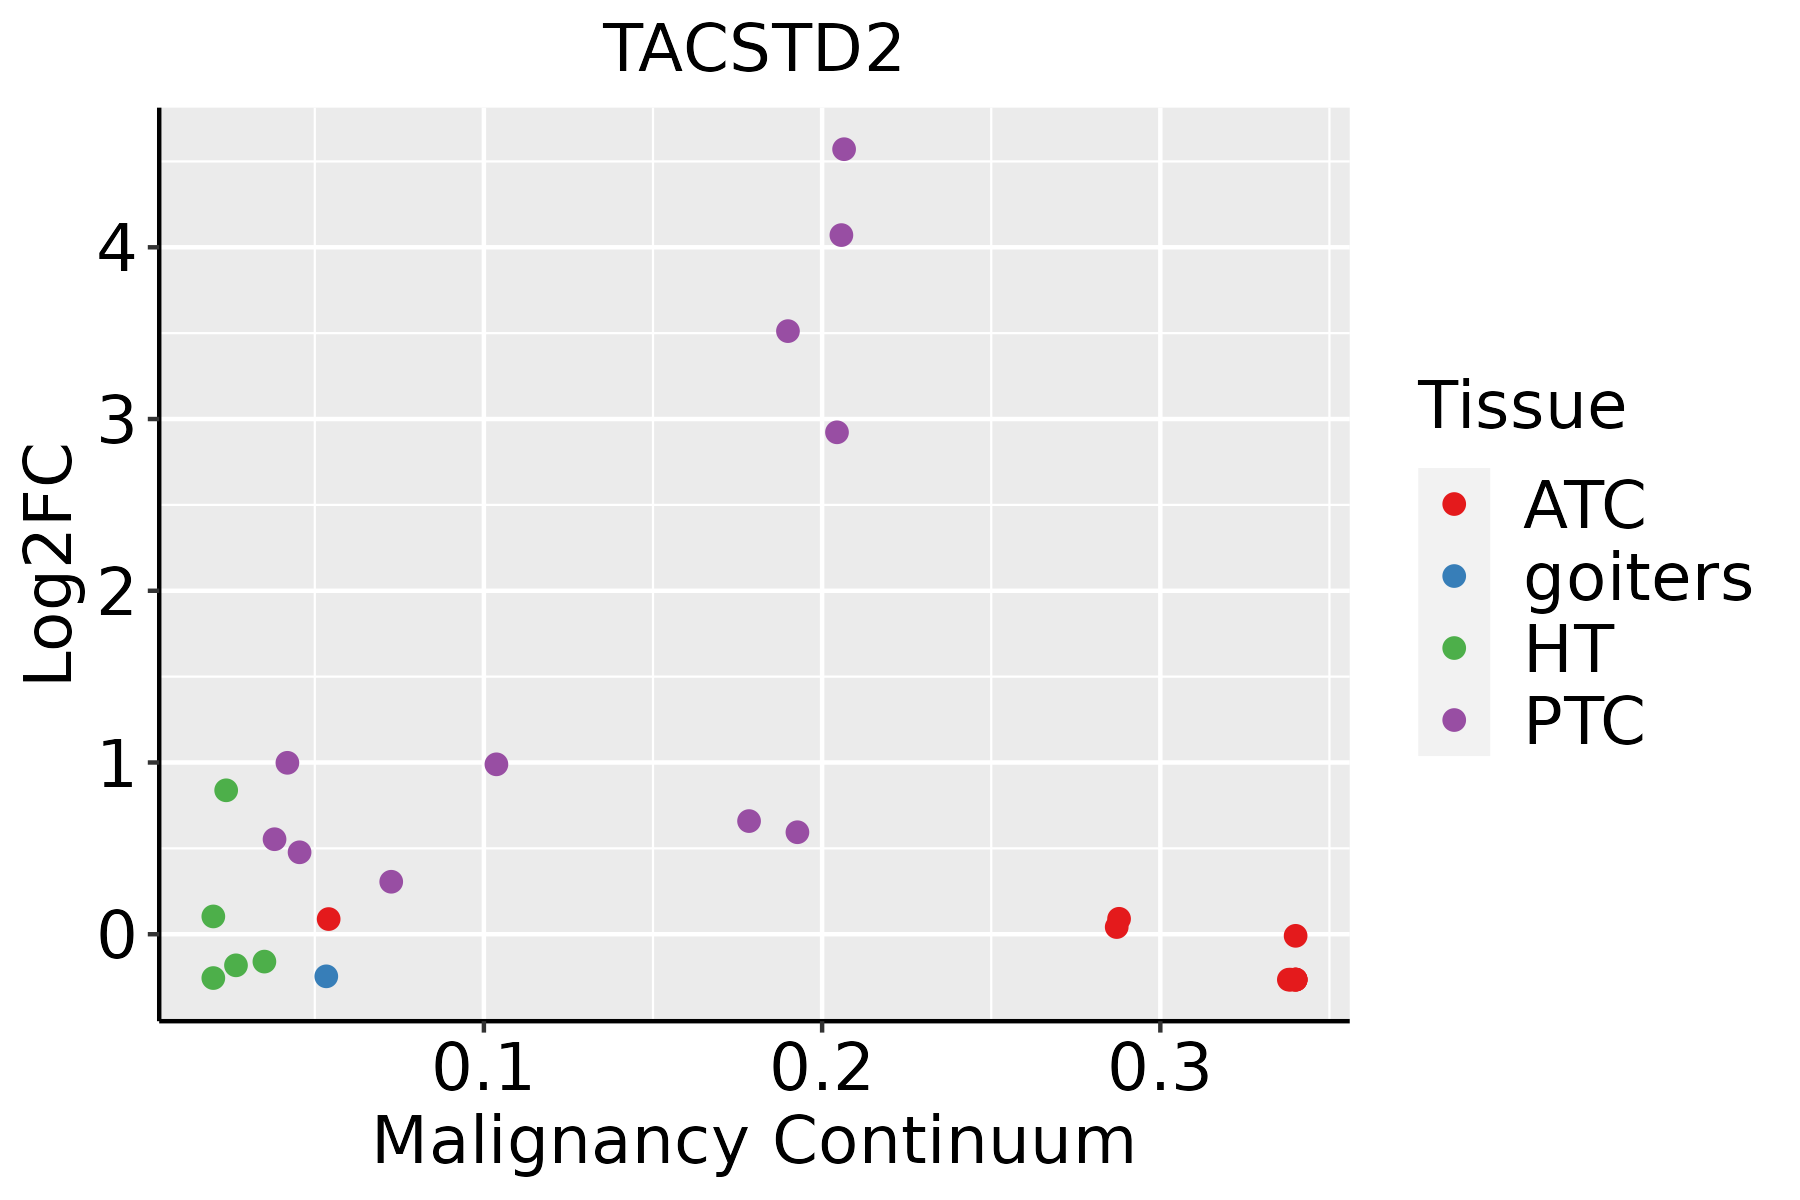 | ATC: Anaplastic thyroid cancer |
| HT: Hashimoto's thyroiditis | ||
| PTC: Papillary thyroid cancer |
| ∗log2FC in expression of this searched gene in stem-like cells from each diseased tissue sample relative to stem-like cells in normal samples in each tissue plotted against the malignancy continuum. Samples are colored based on if they are from different disease stage. |
Top |
Malignant transformation related pathway analysis |
| Find out the enriched GO biological processes and KEGG pathways involved in transition from healthy to precancer to cancer |
| Tissue | Disease Stage | Enriched GO biological Processes |
| Colorectum | AD |  |
| Colorectum | SER |  |
| Colorectum | MSS |  |
| Colorectum | MSI-H |  |
| Colorectum | FAP |  |
| ∗Top 15 enriched GO BP terms are showed in the bar plot of each disease state in each tissue. Each row represents a significant GO biological process which is colored according to the -log10(p.adjust). |
| Page: 1 2 3 4 5 6 7 8 9 |
| GO ID | Tissue | Disease Stage | Description | Gene Ratio | Bg Ratio | pvalue | p.adjust | Count |
| GO:0072171 | Endometrium | AEH | mesonephric tubule morphogenesis | 14/2100 | 63/18723 | 8.93e-03 | 4.84e-02 | 14 |
| GO:001081016 | Endometrium | EEC | regulation of cell-substrate adhesion | 63/2168 | 221/18723 | 5.17e-12 | 8.85e-10 | 63 |
| GO:002260416 | Endometrium | EEC | regulation of cell morphogenesis | 78/2168 | 309/18723 | 1.45e-11 | 2.28e-09 | 78 |
| GO:003158915 | Endometrium | EEC | cell-substrate adhesion | 87/2168 | 363/18723 | 1.95e-11 | 3.00e-09 | 87 |
| GO:190002415 | Endometrium | EEC | regulation of substrate adhesion-dependent cell spreading | 26/2168 | 57/18723 | 1.30e-10 | 1.53e-08 | 26 |
| GO:003297017 | Endometrium | EEC | regulation of actin filament-based process | 89/2168 | 397/18723 | 4.76e-10 | 4.76e-08 | 89 |
| GO:000701517 | Endometrium | EEC | actin filament organization | 95/2168 | 442/18723 | 1.31e-09 | 1.09e-07 | 95 |
| GO:190290317 | Endometrium | EEC | regulation of supramolecular fiber organization | 82/2168 | 383/18723 | 2.11e-08 | 1.25e-06 | 82 |
| GO:003295617 | Endometrium | EEC | regulation of actin cytoskeleton organization | 77/2168 | 358/18723 | 4.62e-08 | 2.52e-06 | 77 |
| GO:003444615 | Endometrium | EEC | substrate adhesion-dependent cell spreading | 33/2168 | 108/18723 | 9.56e-08 | 4.69e-06 | 33 |
| GO:001076915 | Endometrium | EEC | regulation of cell morphogenesis involved in differentiation | 30/2168 | 96/18723 | 2.09e-07 | 9.21e-06 | 30 |
| GO:000166716 | Endometrium | EEC | ameboidal-type cell migration | 91/2168 | 475/18723 | 7.87e-07 | 2.80e-05 | 91 |
| GO:000165512 | Endometrium | EEC | urogenital system development | 69/2168 | 338/18723 | 1.70e-06 | 5.18e-05 | 69 |
| GO:009013015 | Endometrium | EEC | tissue migration | 73/2168 | 365/18723 | 1.91e-06 | 5.78e-05 | 73 |
| GO:003103214 | Endometrium | EEC | actomyosin structure organization | 46/2168 | 196/18723 | 1.94e-06 | 5.80e-05 | 46 |
| GO:009013215 | Endometrium | EEC | epithelium migration | 72/2168 | 360/18723 | 2.24e-06 | 6.59e-05 | 72 |
| GO:007200112 | Endometrium | EEC | renal system development | 63/2168 | 302/18723 | 2.24e-06 | 6.59e-05 | 63 |
| GO:011005317 | Endometrium | EEC | regulation of actin filament organization | 59/2168 | 278/18723 | 2.62e-06 | 7.53e-05 | 59 |
| GO:001063115 | Endometrium | EEC | epithelial cell migration | 71/2168 | 357/18723 | 3.24e-06 | 8.85e-05 | 71 |
| GO:200014613 | Endometrium | EEC | negative regulation of cell motility | 71/2168 | 359/18723 | 3.98e-06 | 1.04e-04 | 71 |
| Page: 1 2 3 4 5 6 7 8 9 10 11 12 13 14 15 16 17 18 19 20 21 22 23 24 25 26 27 28 29 30 31 32 33 34 35 36 37 38 39 40 41 42 43 44 45 46 47 48 49 50 51 52 53 54 55 56 57 58 59 60 |
| Pathway ID | Tissue | Disease Stage | Description | Gene Ratio | Bg Ratio | pvalue | p.adjust | qvalue | Count |
| Page: 1 |
Top |
Cell-cell communication analysis |
| Identification of potential cell-cell interactions between two cell types and their ligand-receptor pairs for different disease states |
| Ligand | Receptor | LRpair | Pathway | Tissue | Disease Stage |
| Page: 1 |
Top |
Single-cell gene regulatory network inference analysis |
| Find out the significant the regulons (TFs) and the target genes of each regulon across cell types for different disease states |
| TF | Cell Type | Tissue | Disease Stage | Target Gene | RSS | Regulon Activity |
| ∗The dot plots of a searched regulon are shown for all cell subpopulations in each disease state of each tissue based on the regulon specific score inferred using pySCENIC and by calculating the average expression. |
| Page: 1 |
Top |
Somatic mutation of malignant transformation related genes |
| Annotation of somatic variants for genes involved in malignant transformation |
| Hugo Symbol | Variant Class | Variant Classification | dbSNP RS | HGVSc | HGVSp | HGVSp Short | SWISSPROT | BIOTYPE | SIFT | PolyPhen | Tumor Sample Barcode | Tissue | Histology | Sex | Age | Stage | Therapy Types | Drugs | Outcome |
| TACSTD2 | deletion | Frame_Shift_Del | novel | c.534delG | p.Leu179SerfsTer92 | p.L179Sfs*92 | P09758 | protein_coding | TCGA-D8-A27V-01 | Breast | breast invasive carcinoma | Female | <65 | I/II | Hormone Therapy | tamoxiphen | SD | ||
| TACSTD2 | SNV | Missense_Mutation | novel | c.476N>A | p.Arg159His | p.R159H | P09758 | protein_coding | deleterious(0) | probably_damaging(0.94) | TCGA-AA-3947-01 | Colorectum | colon adenocarcinoma | Female | <65 | I/II | Unknown | Unknown | SD |
| TACSTD2 | SNV | Missense_Mutation | novel | c.884T>C | p.Leu295Pro | p.L295P | P09758 | protein_coding | deleterious(0) | probably_damaging(0.96) | TCGA-AD-6964-01 | Colorectum | colon adenocarcinoma | Male | <65 | III/IV | Chemotherapy | folfox | PD |
| TACSTD2 | SNV | Missense_Mutation | c.763C>T | p.Arg255Cys | p.R255C | P09758 | protein_coding | deleterious(0) | benign(0.353) | TCGA-CK-4951-01 | Colorectum | colon adenocarcinoma | Female | >=65 | I/II | Unknown | Unknown | PD | |
| TACSTD2 | SNV | Missense_Mutation | novel | c.745G>A | p.Glu249Lys | p.E249K | P09758 | protein_coding | tolerated(0.12) | benign(0.01) | TCGA-AX-A2HC-01 | Endometrium | uterine corpus endometrioid carcinoma | Female | <65 | III/IV | Chemotherapy | paclitaxel | PD |
| TACSTD2 | SNV | Missense_Mutation | novel | c.821C>T | p.Thr274Ile | p.T274I | P09758 | protein_coding | tolerated(0.09) | benign(0.373) | TCGA-B5-A3FC-01 | Endometrium | uterine corpus endometrioid carcinoma | Female | <65 | I/II | Unknown | Unknown | SD |
| TACSTD2 | SNV | Missense_Mutation | novel | c.334G>A | p.Gly112Ser | p.G112S | P09758 | protein_coding | deleterious(0) | probably_damaging(0.977) | TCGA-B5-A3FC-01 | Endometrium | uterine corpus endometrioid carcinoma | Female | <65 | I/II | Unknown | Unknown | SD |
| TACSTD2 | SNV | Missense_Mutation | novel | c.578N>T | p.Ala193Val | p.A193V | P09758 | protein_coding | tolerated(0.08) | possibly_damaging(0.769) | TCGA-D1-A15X-01 | Endometrium | uterine corpus endometrioid carcinoma | Female | <65 | I/II | Unknown | Unknown | SD |
| TACSTD2 | SNV | Missense_Mutation | novel | c.908N>T | p.Ser303Leu | p.S303L | P09758 | protein_coding | tolerated(0.1) | benign(0.001) | TCGA-EO-A22R-01 | Endometrium | uterine corpus endometrioid carcinoma | Female | <65 | I/II | Unknown | Unknown | SD |
| TACSTD2 | SNV | Missense_Mutation | novel | c.866N>C | p.Val289Ala | p.V289A | P09758 | protein_coding | tolerated(0.73) | benign(0.056) | TCGA-EO-A3AV-01 | Endometrium | uterine corpus endometrioid carcinoma | Female | <65 | III/IV | Chemotherapy | carboplatin | CR |
| Page: 1 2 |
Top |
Related drugs of malignant transformation related genes |
| Identification of chemicals and drugs interact with genes involved in malignant transfromation |
| (DGIdb 4.0) |
| Entrez ID | Symbol | Category | Interaction Types | Drug Claim Name | Drug Name | PMIDs |
| 4070 | TACSTD2 | NA | antibody | 249565933 | ||
| 4070 | TACSTD2 | NA | N/A |
| Page: 1 |

Copyright 2023-Present -The University of Texas Health Science Center at Houston |