Schematic overview of the cellular and molecular mechanisms involved in the cancer progression, including the proposed cellular and molecular mechanisms in cancer cells trajectory. AT1: alveolar type 1 cells; AT2: alveolar type 2 cells; AAH: atypical adenomatous hyperplasia; AIS: adenocarcinoma in situ; MIA: minimally invasive adenocarcinoma; IA: invasive adenocarcinoma; EMT: epithelial-mesenchymal transition

Home

Download

Statistics

Help

Contact

Center for Computational Systems Medicine
leaf

Gene summary

leaf

Malignant transformation analysis

leaf

Malignant transformation related pathway analysis

leaf

Cell-cell communication analysis

leaf

Single-cell gene regulatory network inference analysis

leaf

Somatic mutation of malignant transformation related genes

leaf

Related drugs of malignant transformation related genes

Gene: SUPT6H

Gene summary for SUPT6H

check button Gene summary.

Gene informationSpeciesHuman
Gene symbol

SUPT6H

Gene ID

6830

Gene nameSPT6 homolog, histone chaperone and transcription elongation factor
Gene AliasSPT6
Cytomap17q11.2
Gene Typeprotein-coding
GO ID

GO:0000018

UniProtAcc

Q7KZ85


Top

Malignant transformation analysis

check button Identification of the aberrant gene expression in precancerous and cancerous lesions by comparing the gene expression of stem-like cells in diseased tissues with normal stem cells
check button Malignant transformation involving gene list.
Entrez IDSymbolReplicatesSpeciesOrganTissueAdj P-valueLog2FCMalignancy
6830SUPT6HLZE2THumanEsophagusESCC8.79e-034.97e-010.082
6830SUPT6HLZE4THumanEsophagusESCC1.33e-145.34e-010.0811
6830SUPT6HLZE7THumanEsophagusESCC1.37e-084.81e-010.0667
6830SUPT6HLZE8THumanEsophagusESCC4.07e-083.14e-010.067
6830SUPT6HLZE20THumanEsophagusESCC1.88e-101.91e-010.0662
6830SUPT6HLZE22THumanEsophagusESCC3.39e-083.30e-010.068
6830SUPT6HLZE24THumanEsophagusESCC2.17e-176.07e-010.0596
6830SUPT6HLZE21THumanEsophagusESCC4.13e-035.81e-010.0655
6830SUPT6HP1T-EHumanEsophagusESCC3.03e-208.67e-010.0875
6830SUPT6HP2T-EHumanEsophagusESCC1.24e-216.03e-010.1177
6830SUPT6HP4T-EHumanEsophagusESCC2.44e-204.59e-010.1323
6830SUPT6HP5T-EHumanEsophagusESCC6.27e-082.35e-010.1327
6830SUPT6HP8T-EHumanEsophagusESCC1.64e-286.19e-010.0889
6830SUPT6HP9T-EHumanEsophagusESCC9.99e-163.41e-010.1131
6830SUPT6HP10T-EHumanEsophagusESCC5.42e-276.58e-010.116
6830SUPT6HP11T-EHumanEsophagusESCC1.35e-146.47e-010.1426
6830SUPT6HP12T-EHumanEsophagusESCC2.08e-234.97e-010.1122
6830SUPT6HP15T-EHumanEsophagusESCC2.08e-286.94e-010.1149
6830SUPT6HP16T-EHumanEsophagusESCC3.84e-193.65e-010.1153
6830SUPT6HP17T-EHumanEsophagusESCC4.73e-093.99e-010.1278
Page: 1 2 3 4 5 6 

check button Transcriptomic changes along malignancy continuum.
TissueExpression DynamicsAbbreviation
EsophagusThe image shows the transcriptomic changes along malignancy continuum.log2FC in expression of this searched gene in stem-like cells from each diseased tissue sample relative to stem-like cells in normal samples in each tissue plotted against the malignancy continuum. Samples are colored based on if they are from different disease stage.ESCC: Esophageal squamous cell carcinoma
HGIN: High-grade intraepithelial neoplasias
LGIN: Low-grade intraepithelial neoplasias
LiverThe image shows the transcriptomic changes along malignancy continuum.log2FC in expression of this searched gene in stem-like cells from each diseased tissue sample relative to stem-like cells in normal samples in each tissue plotted against the malignancy continuum. Samples are colored based on if they are from different disease stage.
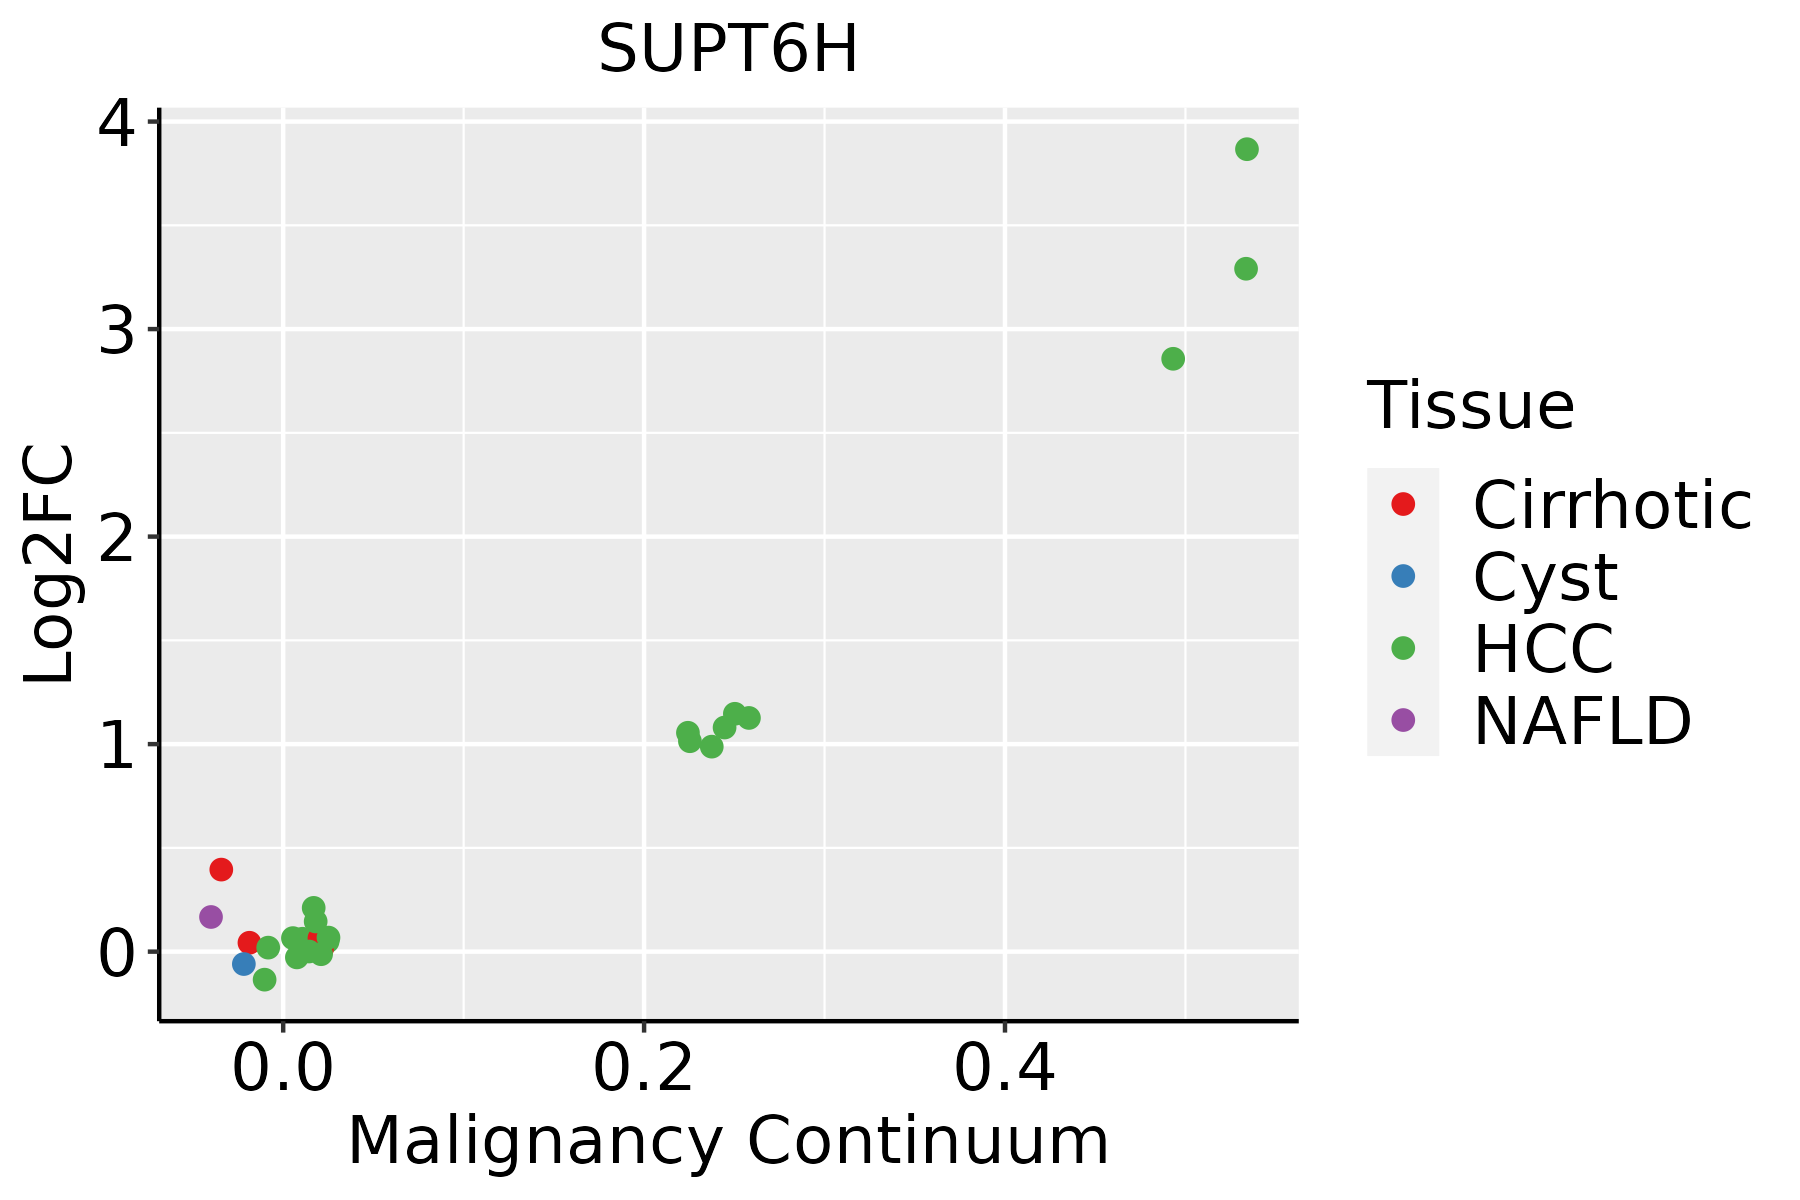
HCC: Hepatocellular carcinoma
NAFLD: Non-alcoholic fatty liver disease
Oral CavityThe image shows the transcriptomic changes along malignancy continuum.log2FC in expression of this searched gene in stem-like cells from each diseased tissue sample relative to stem-like cells in normal samples in each tissue plotted against the malignancy continuum. Samples are colored based on if they are from different disease stage.
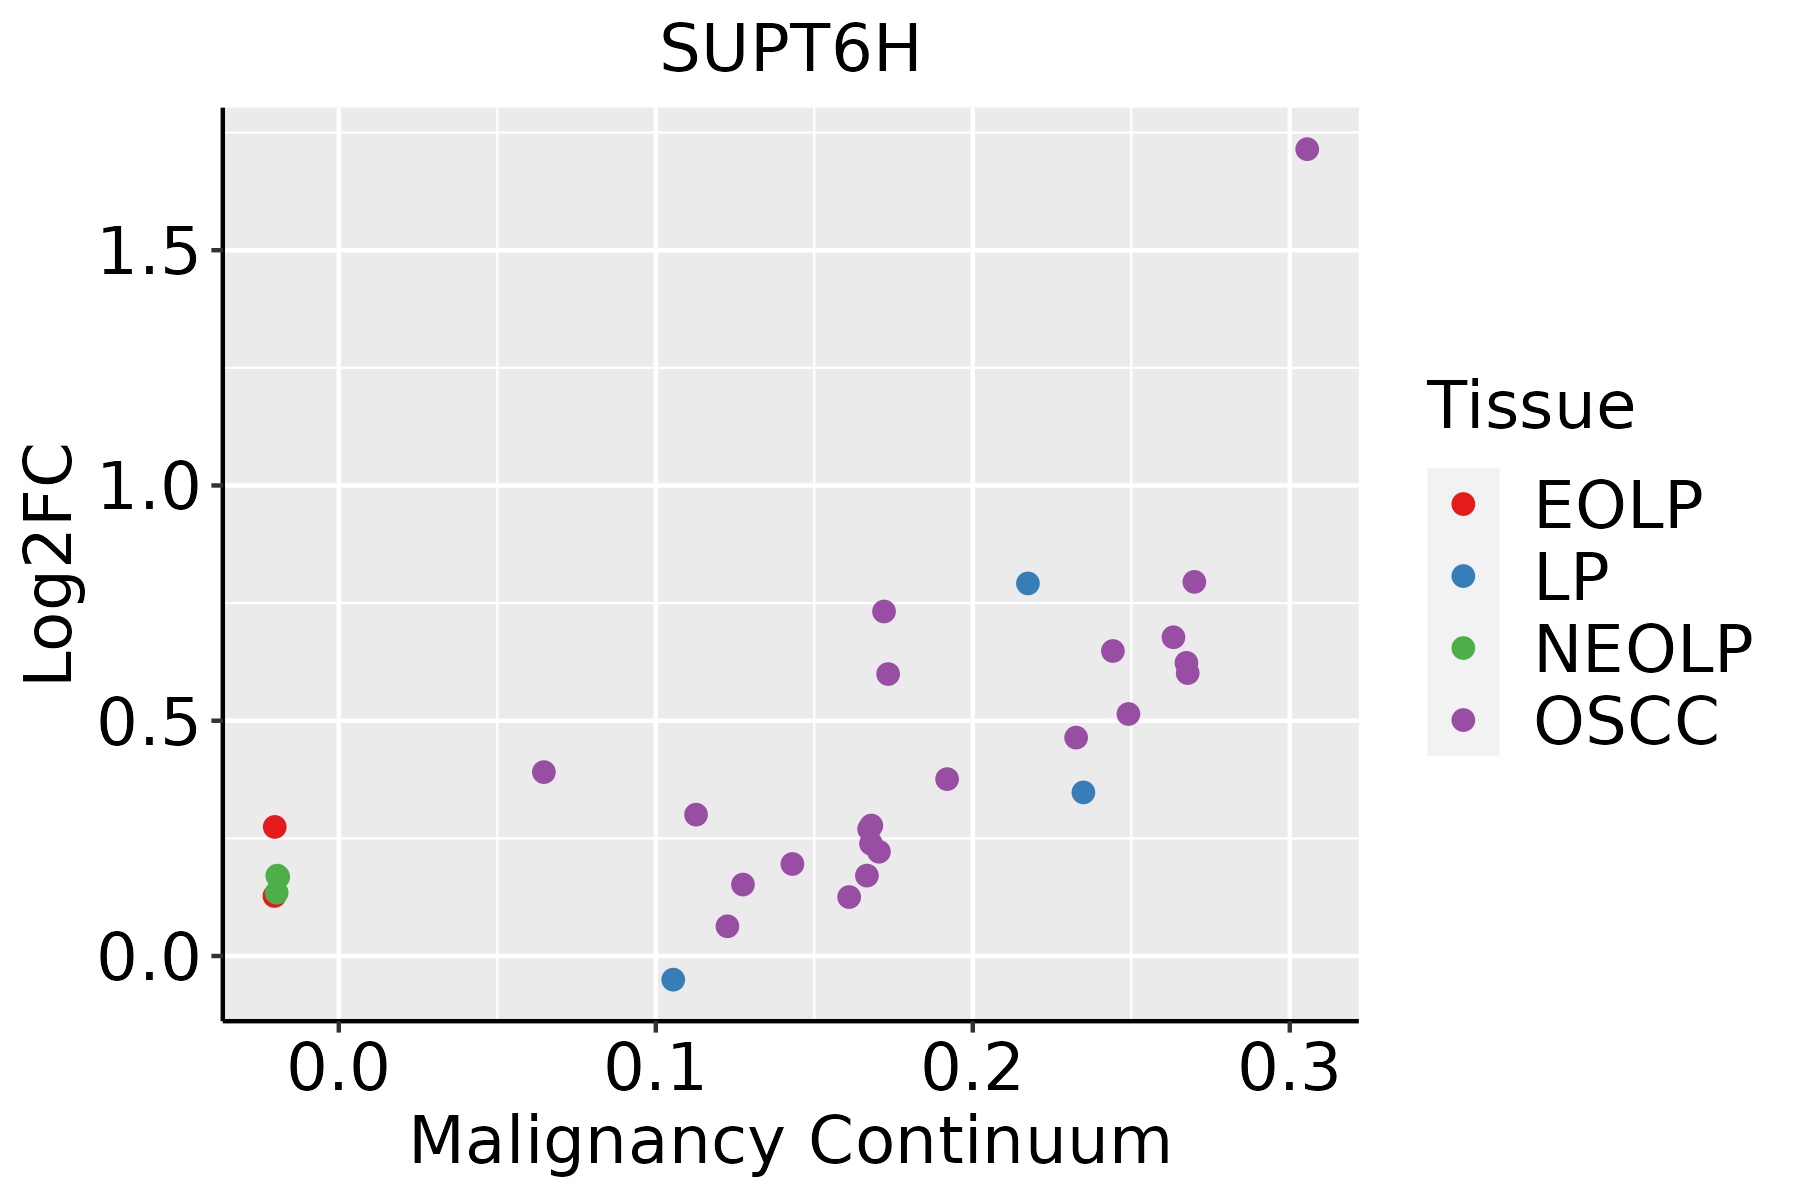
EOLP: Erosive Oral lichen planus
LP: leukoplakia
NEOLP: Non-erosive oral lichen planus
OSCC: Oral squamous cell carcinoma
ThyroidThe image shows the transcriptomic changes along malignancy continuum.log2FC in expression of this searched gene in stem-like cells from each diseased tissue sample relative to stem-like cells in normal samples in each tissue plotted against the malignancy continuum. Samples are colored based on if they are from different disease stage.ATC: Anaplastic thyroid cancer
HT: Hashimoto's thyroiditis
PTC: Papillary thyroid cancer
∗log2FC in expression of this searched gene in stem-like cells from each diseased tissue sample relative to stem-like cells in normal samples in each tissue plotted against the malignancy continuum. Samples are colored based on if they are from different disease stage.

Top

Malignant transformation related pathway analysis

check buttonFind out the enriched GO biological processes and KEGG pathways involved in transition from healthy to precancer to cancer
check button Figure of enriched GO biological processes.
TissueDisease StageEnriched GO biological Processes
ColorectumADGO analysis - Figure of enriched GO biological processes: Top 15 enriched GO BP terms are showed in the bar plot of each disease state in each tissue. Each row represents a significant GO biological process which is colored according to the -log10(p.adjust).
ColorectumSERGO analysis - Figure of enriched GO biological processes: Top 15 enriched GO BP terms are showed in the bar plot of each disease state in each tissue. Each row represents a significant GO biological process which is colored according to the -log10(p.adjust).
ColorectumMSSGO analysis - Figure of enriched GO biological processes: Top 15 enriched GO BP terms are showed in the bar plot of each disease state in each tissue. Each row represents a significant GO biological process which is colored according to the -log10(p.adjust).
ColorectumMSI-HGO analysis - Figure of enriched GO biological processes: Top 15 enriched GO BP terms are showed in the bar plot of each disease state in each tissue. Each row represents a significant GO biological process which is colored according to the -log10(p.adjust).
ColorectumFAPGO analysis - Figure of enriched GO biological processes: Top 15 enriched GO BP terms are showed in the bar plot of each disease state in each tissue. Each row represents a significant GO biological process which is colored according to the -log10(p.adjust).
∗Top 15 enriched GO BP terms are showed in the bar plot of each disease state in each tissue. Each row represents a significant GO biological process which is colored according to the -log10(p.adjust).
Page: 1 2 3 4 5 6 7 8 9 

check button Enriched GO biological processes.
GO IDTissueDisease StageDescriptionGene RatioBg Ratiopvaluep.adjustCount
GO:001593131Oral cavityNEOLPnucleobase-containing compound transport48/2005222/187231.51e-063.77e-0548
GO:004269221Oral cavityNEOLPmuscle cell differentiation71/2005384/187232.97e-066.76e-0571
GO:004683131Oral cavityNEOLPregulation of RNA export from nucleus8/200512/187235.68e-061.16e-048
GO:005102831Oral cavityNEOLPmRNA transport31/2005130/187231.38e-052.43e-0431
GO:003105631Oral cavityNEOLPregulation of histone modification34/2005152/187232.31e-053.72e-0434
GO:000632521Oral cavityNEOLPchromatin organization70/2005409/187234.97e-056.83e-0470
GO:005105231Oral cavityNEOLPregulation of DNA metabolic process63/2005359/187235.48e-057.44e-0463
GO:00322392Oral cavityNEOLPregulation of nucleobase-containing compound transport8/200515/187235.49e-057.44e-048
GO:000647922Oral cavityNEOLPprotein methylation37/2005181/187238.15e-051.02e-0337
GO:000821322Oral cavityNEOLPprotein alkylation37/2005181/187238.15e-051.02e-0337
GO:001820531Oral cavityNEOLPpeptidyl-lysine modification64/2005376/187231.21e-041.43e-0364
GO:003296821Oral cavityNEOLPpositive regulation of transcription elongation from RNA polymerase II promoter7/200513/187231.53e-041.74e-037
GO:001657122Oral cavityNEOLPhistone methylation30/2005141/187231.77e-041.95e-0330
GO:003496822Oral cavityNEOLPhistone lysine methylation25/2005115/187234.21e-043.89e-0325
GO:003106021Oral cavityNEOLPregulation of histone methylation17/200569/187237.76e-046.23e-0317
GO:000640531Oral cavityNEOLPRNA export from nucleus19/200584/187231.20e-038.85e-0319
GO:00342433Oral cavityNEOLPregulation of transcription elongation from RNA polymerase II promoter10/200532/187231.36e-039.75e-0310
GO:00714263Oral cavityNEOLPribonucleoprotein complex export from nucleus17/200576/187232.41e-031.54e-0217
GO:00310572Oral cavityNEOLPnegative regulation of histone modification12/200546/187232.66e-031.66e-0212
GO:00711663Oral cavityNEOLPribonucleoprotein complex localization17/200577/187232.80e-031.73e-0217
Page: 1 2 3 4 5 6 7 8 9 10 11 12 13 14 15 16 17 18 19 

check button Enriched KEGG pathways.
Pathway IDTissueDisease StageDescriptionGene RatioBg Ratiopvaluep.adjustqvalueCount
Page: 1 

Top

Cell-cell communication analysis

check buttonIdentification of potential cell-cell interactions between two cell types and their ligand-receptor pairs for different disease states
LigandReceptorLRpairPathwayTissueDisease Stage
Page: 1 

Top

Single-cell gene regulatory network inference analysis

check buttonFind out the significant the regulons (TFs) and the target genes of each regulon across cell types for different disease states
TFCell TypeTissueDisease StageTarget GeneRSSRegulon Activity
∗The dot plots of a searched regulon are shown for all cell subpopulations in each disease state of each tissue based on the regulon specific score inferred using pySCENIC and by calculating the average expression.
Page: 1 

Top

Somatic mutation of malignant transformation related genes

check buttonAnnotation of somatic variants for genes involved in malignant transformation
Hugo SymbolVariant ClassVariant ClassificationdbSNP RSHGVScHGVSpHGVSp ShortSWISSPROTBIOTYPESIFTPolyPhenTumor Sample BarcodeTissueHistologySexAgeStageTherapy TypesDrugsOutcome
SUPT6HSNVMissense_Mutationc.388N>Tp.Asp130Tyrp.D130YQ7KZ85protein_codingdeleterious(0)possibly_damaging(0.791)TCGA-A2-A25A-01Breastbreast invasive carcinomaFemale<65I/IIUnspecificCytoxanSD
SUPT6HSNVMissense_Mutationc.5009N>Gp.Ala1670Glyp.A1670GQ7KZ85protein_codingtolerated(0.37)benign(0.066)TCGA-A7-A0DA-01Breastbreast invasive carcinomaFemale<65I/IIChemotherapyadriamycinSD
SUPT6HSNVMissense_Mutationrs755836482c.4562N>Cp.Gly1521Alap.G1521AQ7KZ85protein_codingtolerated(0.12)possibly_damaging(0.505)TCGA-A8-A08B-01Breastbreast invasive carcinomaFemale<65I/IIChemotherapy5-fluorouracilCR
SUPT6HSNVMissense_Mutationc.3218N>Tp.Ala1073Valp.A1073VQ7KZ85protein_codingdeleterious(0)probably_damaging(0.998)TCGA-A8-A09Z-01Breastbreast invasive carcinomaFemale>=65I/IIUnknownUnknownSD
SUPT6HSNVMissense_Mutationc.3817N>Cp.Glu1273Glnp.E1273QQ7KZ85protein_codingdeleterious(0.01)probably_damaging(0.989)TCGA-AC-A23H-01Breastbreast invasive carcinomaFemale>=65I/IIUnknownUnknownPD
SUPT6HSNVMissense_Mutationc.295G>Ap.Asp99Asnp.D99NQ7KZ85protein_codingdeleterious(0.01)probably_damaging(0.956)TCGA-AO-A03T-01Breastbreast invasive carcinomaFemale<65I/IIChemotherapycyclophosphamideSD
SUPT6HSNVMissense_Mutationc.298N>Ap.Asp100Asnp.D100NQ7KZ85protein_codingdeleterious(0.02)probably_damaging(0.956)TCGA-C8-A131-01Breastbreast invasive carcinomaFemale>=65III/IVChemotherapy5-fluorouracilCR
SUPT6HSNVMissense_Mutationc.3779G>Cp.Gly1260Alap.G1260AQ7KZ85protein_codingdeleterious(0.02)possibly_damaging(0.705)TCGA-C8-A27B-01Breastbreast invasive carcinomaFemale<65I/IIChemotherapy5-fluorouracilCR
SUPT6HSNVMissense_Mutationc.22N>Ap.Glu8Lysp.E8KQ7KZ85protein_codingdeleterious_low_confidence(0.03)possibly_damaging(0.905)TCGA-D8-A1J9-01Breastbreast invasive carcinomaFemale<65I/IIUnknownUnknownSD
SUPT6HSNVMissense_Mutationc.388G>Tp.Asp130Tyrp.D130YQ7KZ85protein_codingdeleterious(0)possibly_damaging(0.791)TCGA-D8-A1X7-01Breastbreast invasive carcinomaFemale<65I/IIChemotherapyHormone Therapydoxorubicine+cyclophosphamide+tamoxifenSD
Page: 1 2 3 4 5 6 7 8 9 10 11 12 13 14 15 16 

Top

Related drugs of malignant transformation related genes

check buttonIdentification of chemicals and drugs interact with genes involved in malignant transfromation
(DGIdb 4.0)
Entrez IDSymbolCategoryInteraction TypesDrug Claim NameDrug NamePMIDs
Page: 1