
|
|||||
|
 | |
| |
| |
| |
| |
| |
|
Gene: SOCS1 |
Gene summary for SOCS1 |
| Gene information | Species | Human | Gene symbol | SOCS1 | Gene ID | 8651 |
| Gene name | suppressor of cytokine signaling 1 | |
| Gene Alias | AISIMD | |
| Cytomap | 16p13.13 | |
| Gene Type | protein-coding | GO ID | GO:0001101 | UniProtAcc | O15524 |
Top |
Malignant transformation analysis |
| Identification of the aberrant gene expression in precancerous and cancerous lesions by comparing the gene expression of stem-like cells in diseased tissues with normal stem cells |
| Entrez ID | Symbol | Replicates | Species | Organ | Tissue | Adj P-value | Log2FC | Malignancy |
| 8651 | SOCS1 | HSIL_HPV_2 | Human | Cervix | HSIL_HPV | 5.25e-12 | -4.36e-01 | 0.0208 |
| 8651 | SOCS1 | CCI_1 | Human | Cervix | CC | 2.11e-03 | -5.07e-01 | 0.528 |
| 8651 | SOCS1 | CCI_3 | Human | Cervix | CC | 3.48e-02 | -4.75e-01 | 0.516 |
| 8651 | SOCS1 | CCII_1 | Human | Cervix | CC | 6.78e-08 | -5.07e-01 | 0.3249 |
| 8651 | SOCS1 | Tumor | Human | Cervix | CC | 2.18e-05 | -3.40e-01 | 0.1241 |
| 8651 | SOCS1 | sample3 | Human | Cervix | CC | 2.38e-05 | -2.86e-01 | 0.1387 |
| 8651 | SOCS1 | H2 | Human | Cervix | HSIL_HPV | 2.42e-06 | -3.73e-01 | 0.0632 |
| 8651 | SOCS1 | L1 | Human | Cervix | CC | 2.31e-06 | -4.93e-01 | 0.0802 |
| 8651 | SOCS1 | T3 | Human | Cervix | CC | 2.02e-04 | -3.06e-01 | 0.1389 |
| 8651 | SOCS1 | LZE20T | Human | Esophagus | ESCC | 2.84e-14 | 7.87e-01 | 0.0662 |
| 8651 | SOCS1 | LZE22T | Human | Esophagus | ESCC | 5.53e-04 | 7.45e-01 | 0.068 |
| 8651 | SOCS1 | LZE24T | Human | Esophagus | ESCC | 1.18e-12 | 5.14e-01 | 0.0596 |
| 8651 | SOCS1 | LZE21T | Human | Esophagus | ESCC | 1.72e-06 | 9.04e-01 | 0.0655 |
| 8651 | SOCS1 | P1T-E | Human | Esophagus | ESCC | 1.43e-15 | 1.70e+00 | 0.0875 |
| 8651 | SOCS1 | P2T-E | Human | Esophagus | ESCC | 2.54e-85 | 1.65e+00 | 0.1177 |
| 8651 | SOCS1 | P4T-E | Human | Esophagus | ESCC | 3.74e-53 | 1.54e+00 | 0.1323 |
| 8651 | SOCS1 | P5T-E | Human | Esophagus | ESCC | 7.79e-40 | 1.03e+00 | 0.1327 |
| 8651 | SOCS1 | P8T-E | Human | Esophagus | ESCC | 1.74e-07 | 4.17e-01 | 0.0889 |
| 8651 | SOCS1 | P9T-E | Human | Esophagus | ESCC | 5.40e-16 | 5.92e-01 | 0.1131 |
| 8651 | SOCS1 | P10T-E | Human | Esophagus | ESCC | 7.06e-33 | 7.21e-01 | 0.116 |
| Page: 1 2 3 4 5 6 |
| Tissue | Expression Dynamics | Abbreviation |
| Cervix | 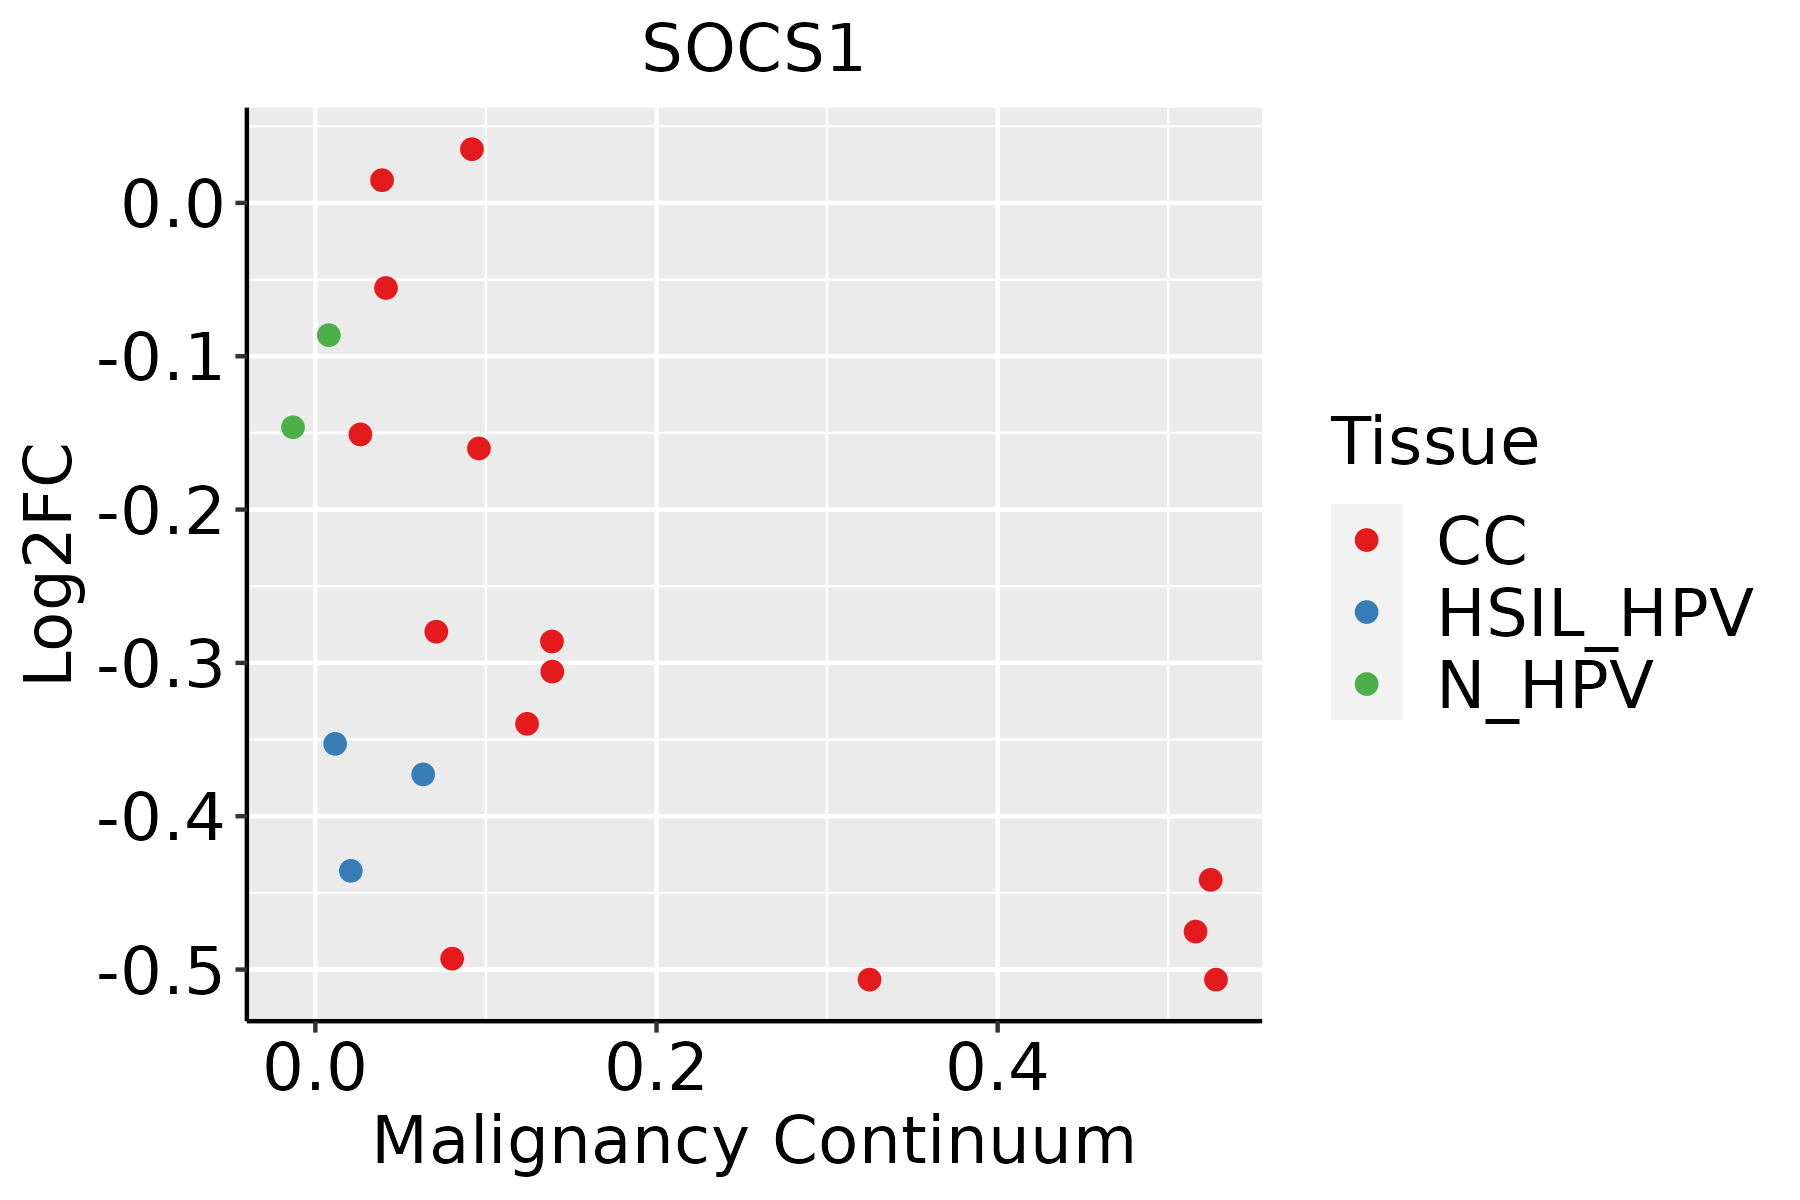 | CC: Cervix cancer |
| HSIL_HPV: HPV-infected high-grade squamous intraepithelial lesions | ||
| N_HPV: HPV-infected normal cervix | ||
| Esophagus | 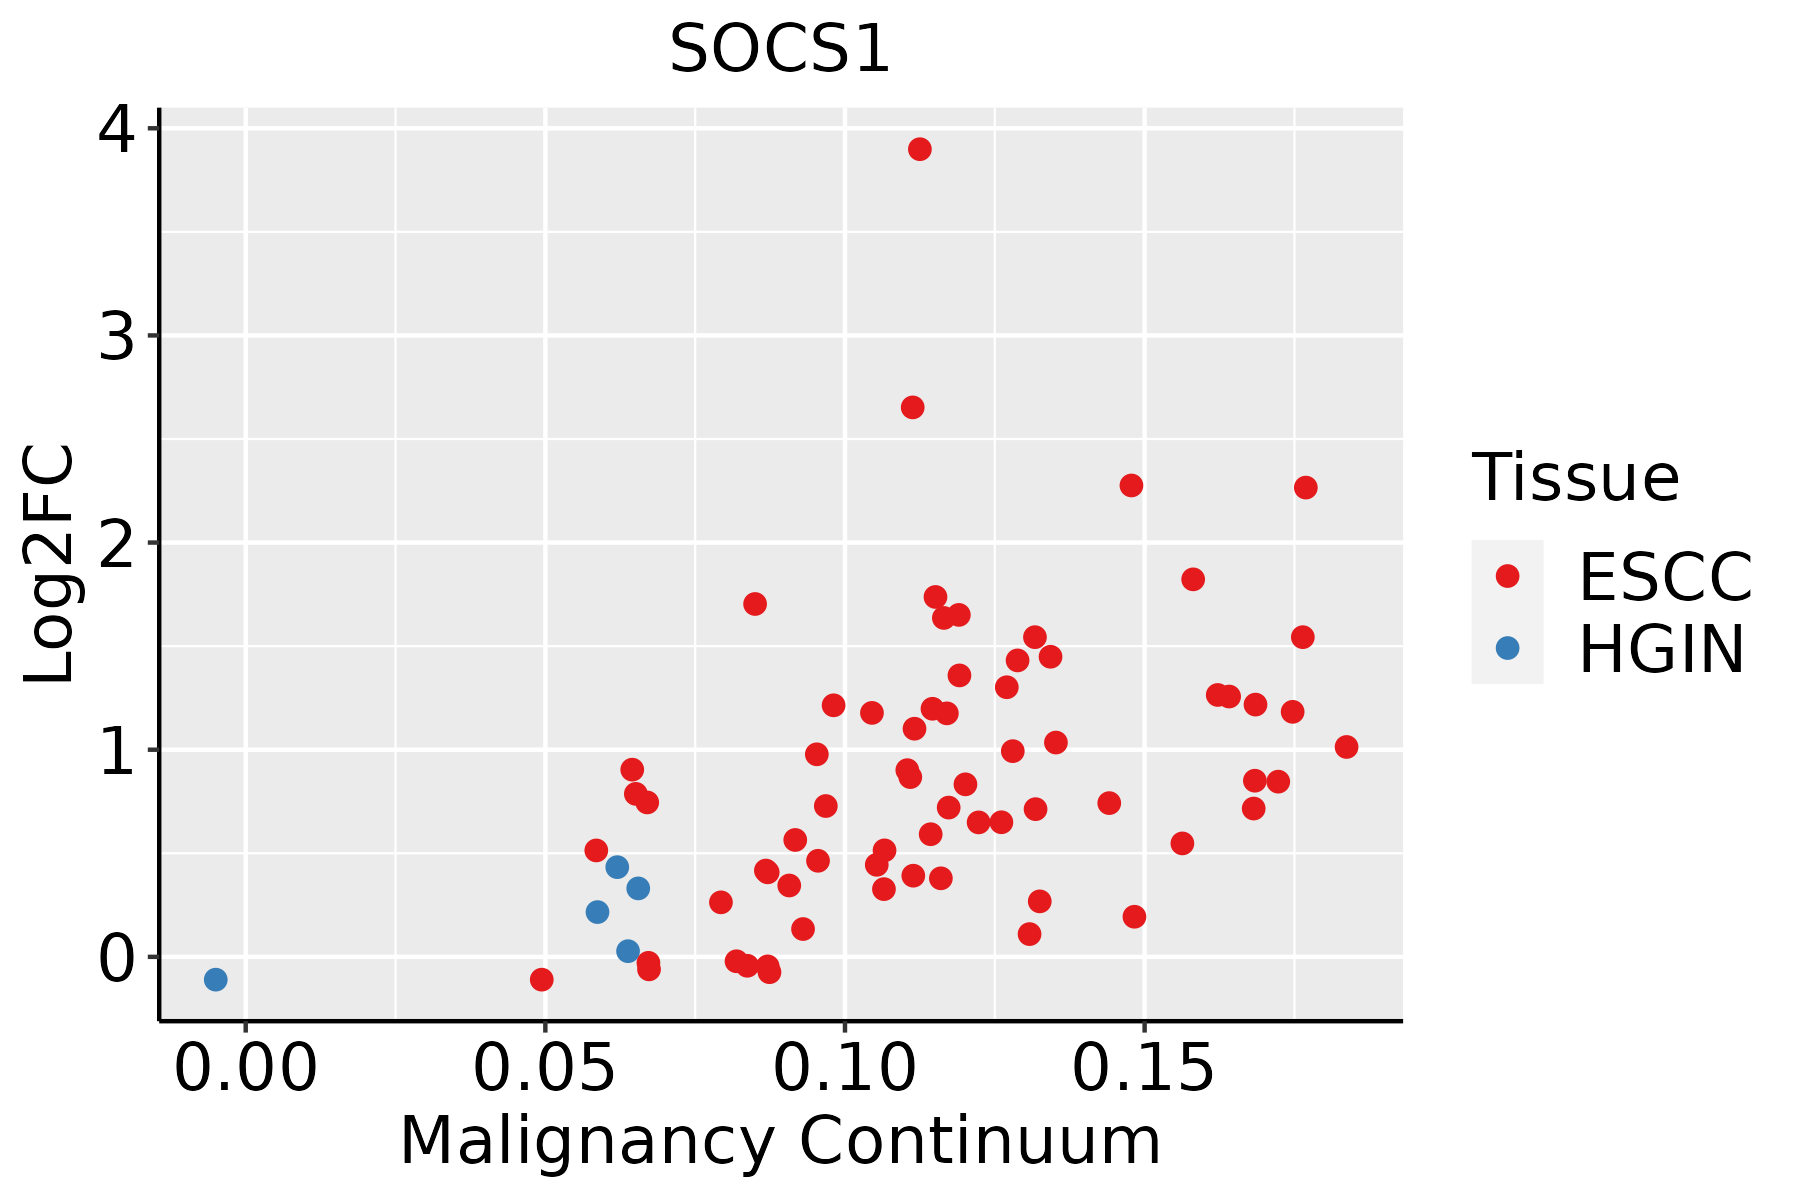 | ESCC: Esophageal squamous cell carcinoma |
| HGIN: High-grade intraepithelial neoplasias | ||
| LGIN: Low-grade intraepithelial neoplasias | ||
| Liver | 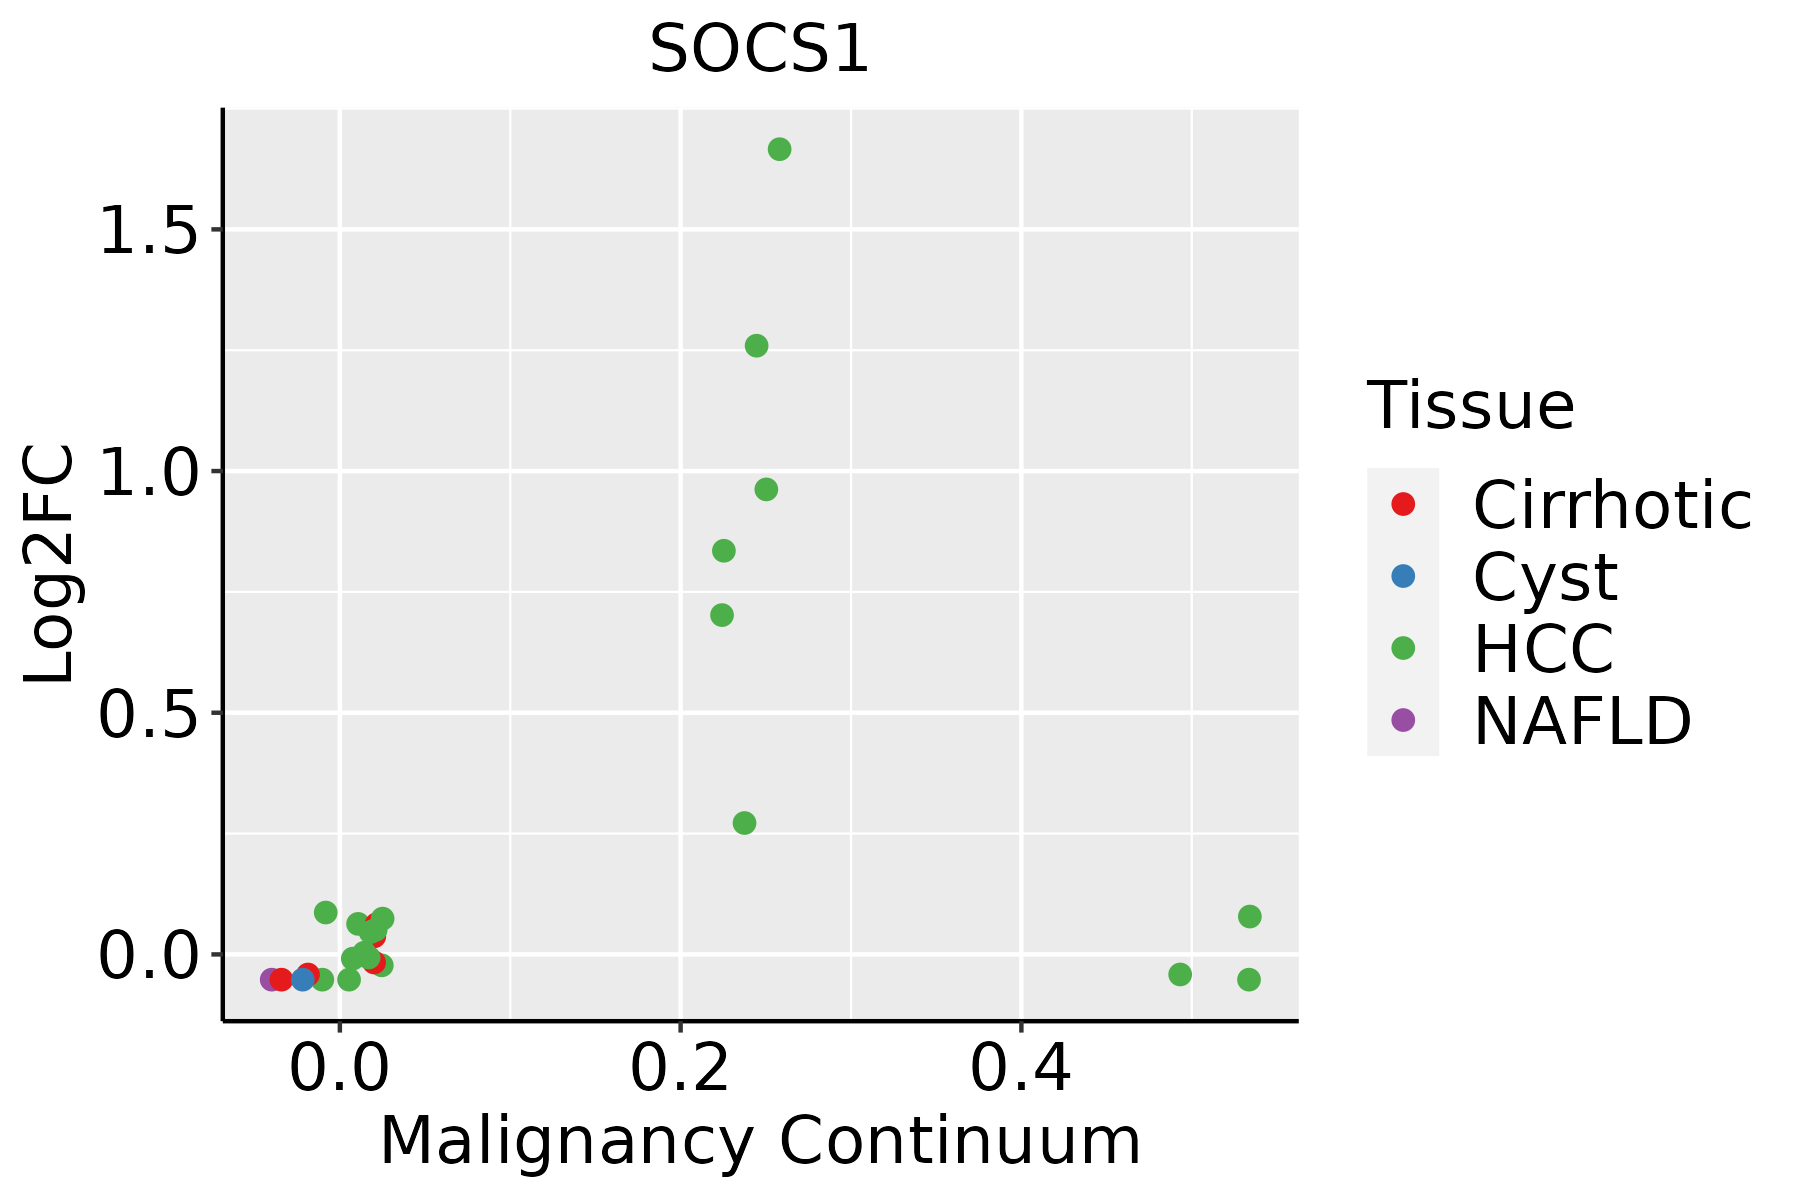 | HCC: Hepatocellular carcinoma |
| NAFLD: Non-alcoholic fatty liver disease | ||
| Oral Cavity | 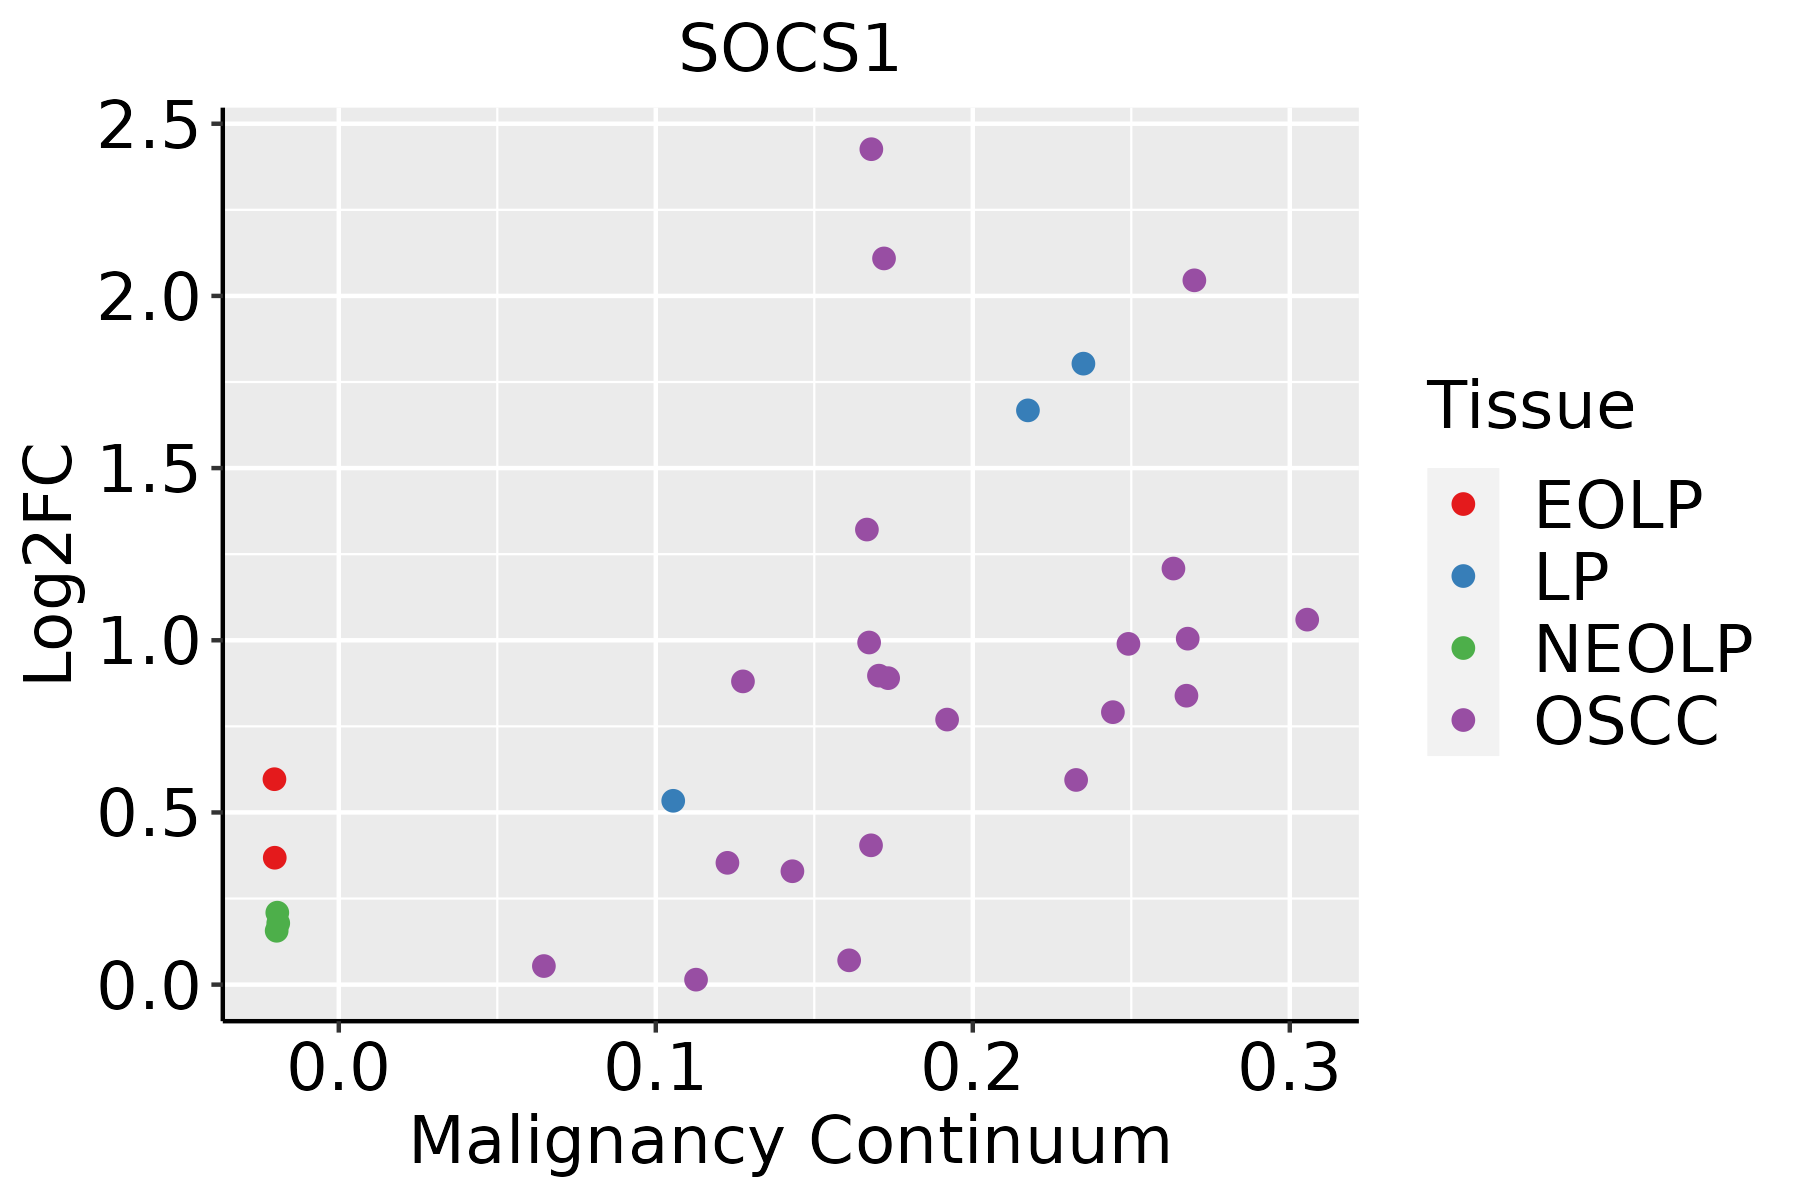 | EOLP: Erosive Oral lichen planus |
| LP: leukoplakia | ||
| NEOLP: Non-erosive oral lichen planus | ||
| OSCC: Oral squamous cell carcinoma | ||
| Skin | 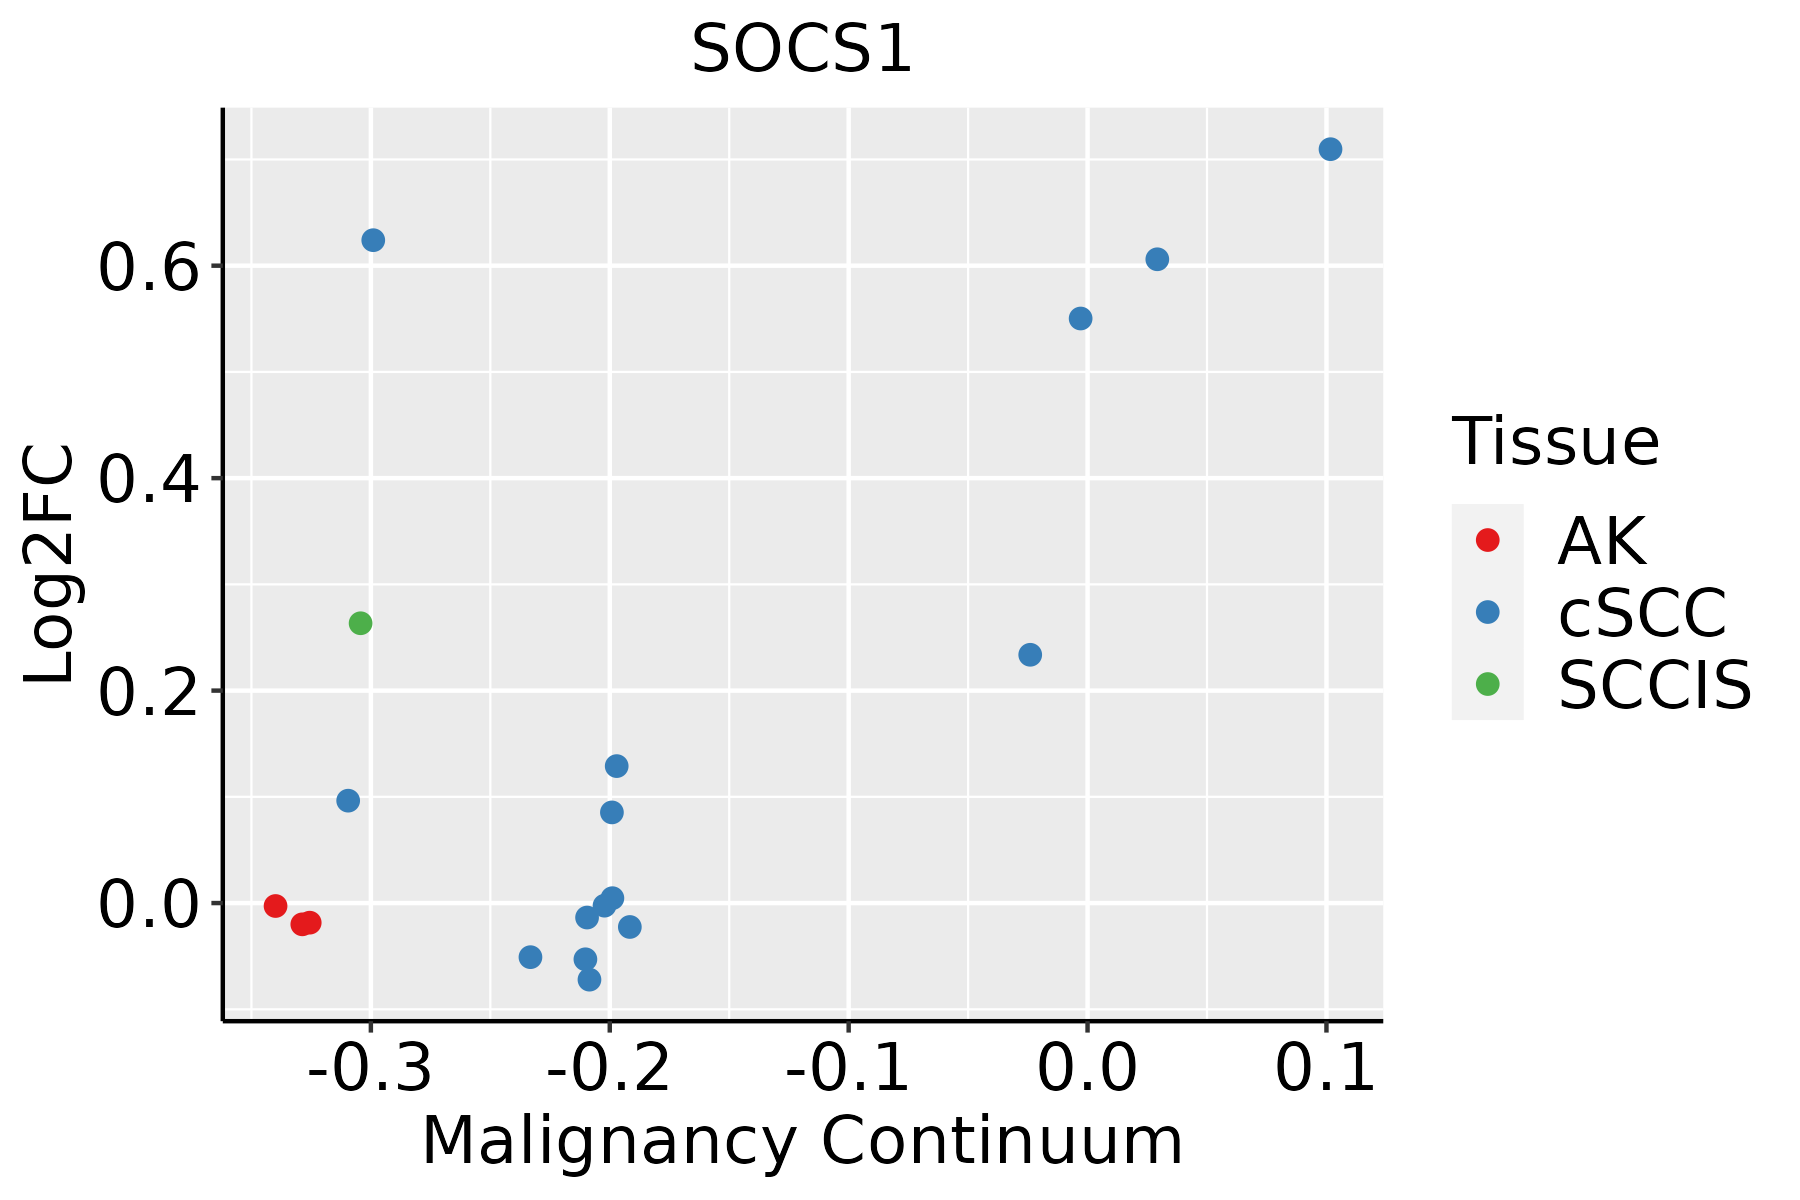 | AK: Actinic keratosis |
| cSCC: Cutaneous squamous cell carcinoma | ||
| SCCIS:squamous cell carcinoma in situ | ||
| Thyroid | 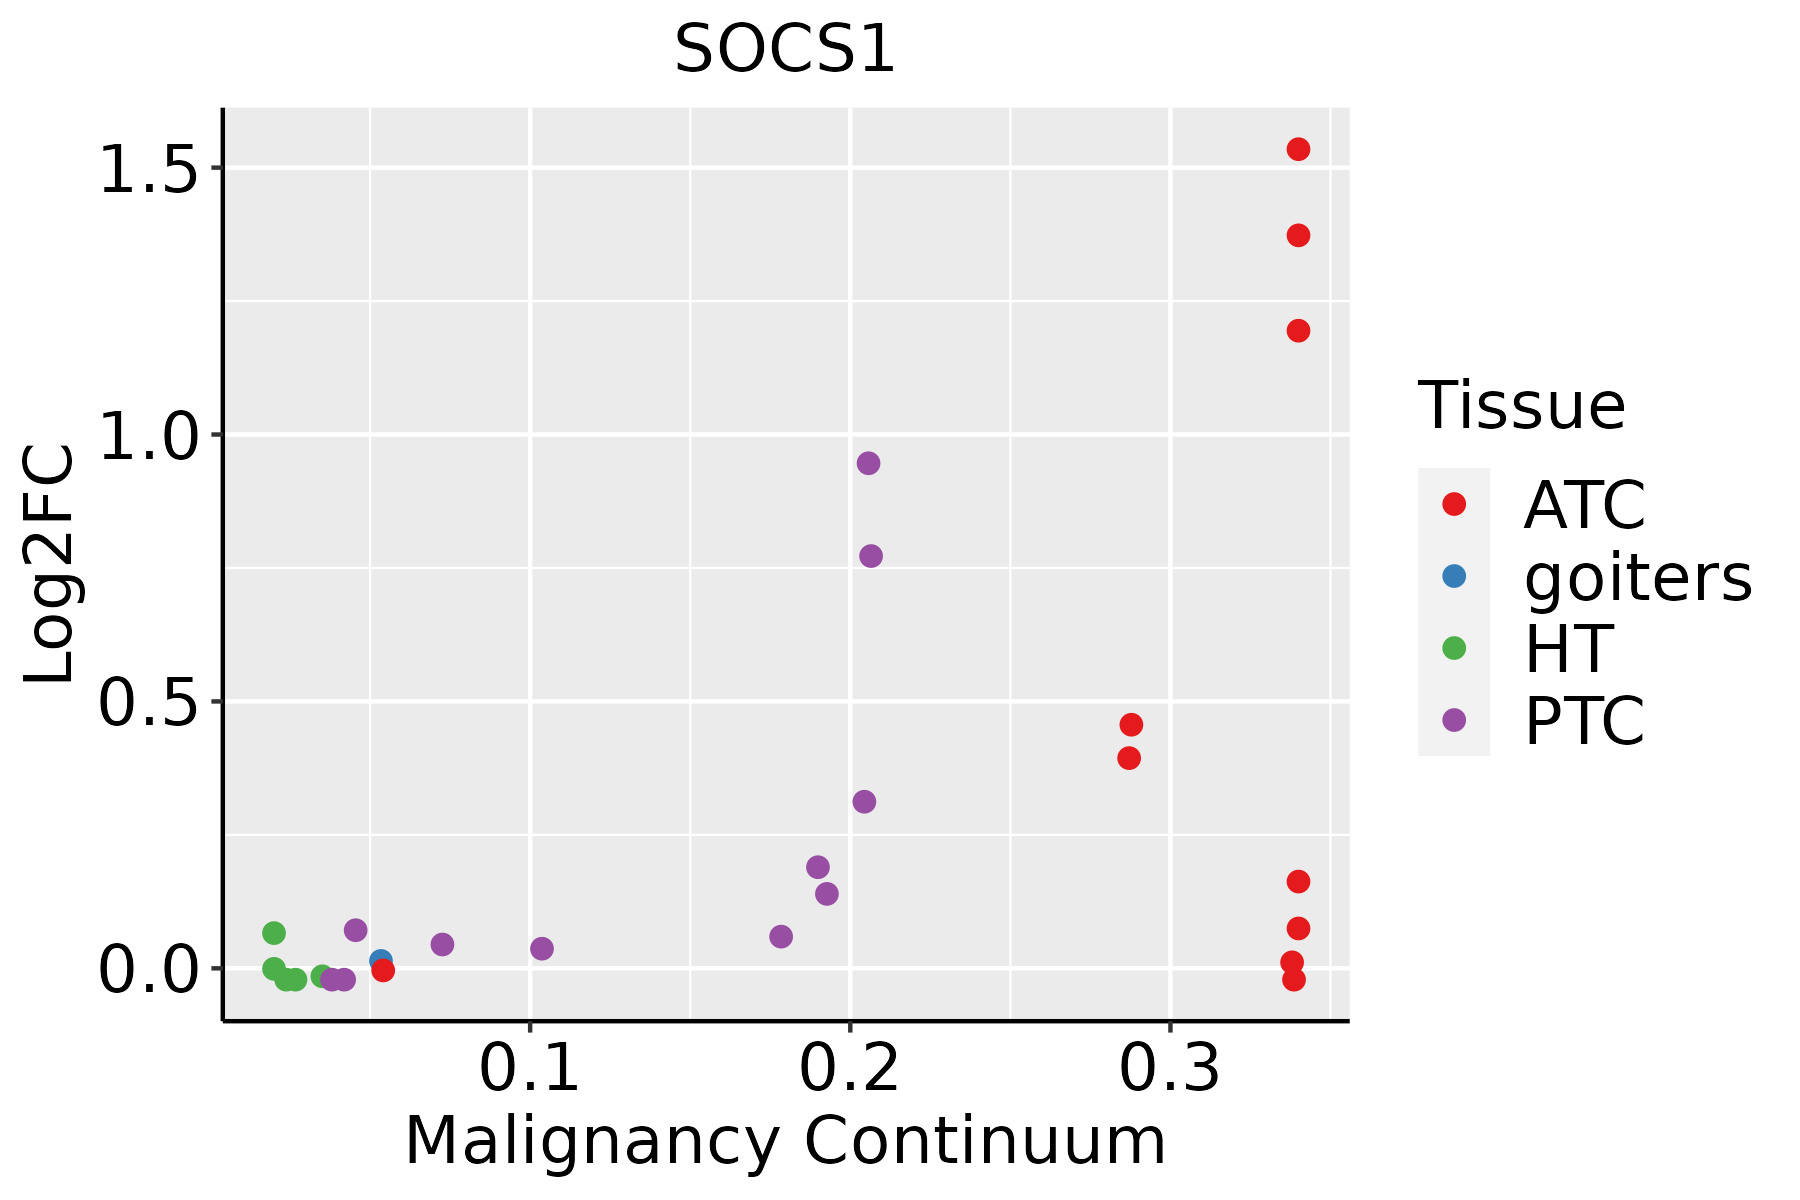 | ATC: Anaplastic thyroid cancer |
| HT: Hashimoto's thyroiditis | ||
| PTC: Papillary thyroid cancer |
| ∗log2FC in expression of this searched gene in stem-like cells from each diseased tissue sample relative to stem-like cells in normal samples in each tissue plotted against the malignancy continuum. Samples are colored based on if they are from different disease stage. |
Top |
Malignant transformation related pathway analysis |
| Find out the enriched GO biological processes and KEGG pathways involved in transition from healthy to precancer to cancer |
| Tissue | Disease Stage | Enriched GO biological Processes |
| Colorectum | AD |  |
| Colorectum | SER |  |
| Colorectum | MSS |  |
| Colorectum | MSI-H |  |
| Colorectum | FAP |  |
| ∗Top 15 enriched GO BP terms are showed in the bar plot of each disease state in each tissue. Each row represents a significant GO biological process which is colored according to the -log10(p.adjust). |
| Page: 1 2 3 4 5 6 7 8 9 |
| GO ID | Tissue | Disease Stage | Description | Gene Ratio | Bg Ratio | pvalue | p.adjust | Count |
| GO:0043434110 | Oral cavity | LP | response to peptide hormone | 138/4623 | 414/18723 | 4.00e-05 | 5.87e-04 | 138 |
| GO:190165317 | Oral cavity | LP | cellular response to peptide | 122/4623 | 359/18723 | 4.22e-05 | 6.10e-04 | 122 |
| GO:0001933110 | Oral cavity | LP | negative regulation of protein phosphorylation | 117/4623 | 342/18723 | 4.34e-05 | 6.22e-04 | 117 |
| GO:007134612 | Oral cavity | LP | cellular response to interferon-gamma | 48/4623 | 118/18723 | 9.16e-05 | 1.15e-03 | 48 |
| GO:000195911 | Oral cavity | LP | regulation of cytokine-mediated signaling pathway | 58/4623 | 150/18723 | 1.00e-04 | 1.24e-03 | 58 |
| GO:004508811 | Oral cavity | LP | regulation of innate immune response | 78/4623 | 218/18723 | 1.57e-04 | 1.78e-03 | 78 |
| GO:006075911 | Oral cavity | LP | regulation of response to cytokine stimulus | 61/4623 | 162/18723 | 1.61e-04 | 1.81e-03 | 61 |
| GO:000283112 | Oral cavity | LP | regulation of response to biotic stimulus | 109/4623 | 327/18723 | 2.45e-04 | 2.60e-03 | 109 |
| GO:006033312 | Oral cavity | LP | interferon-gamma-mediated signaling pathway | 15/4623 | 27/18723 | 5.80e-04 | 5.35e-03 | 15 |
| GO:003286817 | Oral cavity | LP | response to insulin | 88/4623 | 264/18723 | 9.19e-04 | 7.82e-03 | 88 |
| GO:003286917 | Oral cavity | LP | cellular response to insulin stimulus | 70/4623 | 203/18723 | 1.07e-03 | 8.96e-03 | 70 |
| GO:007137515 | Oral cavity | LP | cellular response to peptide hormone stimulus | 95/4623 | 290/18723 | 1.12e-03 | 9.19e-03 | 95 |
| GO:0045785110 | Oral cavity | LP | positive regulation of cell adhesion | 134/4623 | 437/18723 | 2.44e-03 | 1.74e-02 | 134 |
| GO:004211017 | Oral cavity | LP | T cell activation | 146/4623 | 487/18723 | 4.13e-03 | 2.66e-02 | 146 |
| GO:000110115 | Oral cavity | LP | response to acid chemical | 47/4623 | 135/18723 | 5.29e-03 | 3.23e-02 | 47 |
| GO:004320013 | Oral cavity | LP | response to amino acid | 41/4623 | 116/18723 | 6.57e-03 | 3.85e-02 | 41 |
| GO:000268315 | Oral cavity | LP | negative regulation of immune system process | 130/4623 | 434/18723 | 6.70e-03 | 3.90e-02 | 130 |
| GO:190370619 | Oral cavity | LP | regulation of hemopoiesis | 111/4623 | 367/18723 | 8.48e-03 | 4.60e-02 | 111 |
| GO:004593625 | Oral cavity | EOLP | negative regulation of phosphate metabolic process | 105/2218 | 441/18723 | 1.05e-12 | 2.46e-10 | 105 |
| GO:001056325 | Oral cavity | EOLP | negative regulation of phosphorus metabolic process | 105/2218 | 442/18723 | 1.22e-12 | 2.60e-10 | 105 |
| Page: 1 2 3 4 5 6 7 8 9 10 11 12 13 14 15 16 17 18 19 20 21 22 23 24 25 26 |
| Pathway ID | Tissue | Disease Stage | Description | Gene Ratio | Bg Ratio | pvalue | p.adjust | qvalue | Count |
| hsa0412014 | Cervix | CC | Ubiquitin mediated proteolysis | 49/1267 | 142/8465 | 4.26e-09 | 7.68e-08 | 4.54e-08 | 49 |
| hsa0514514 | Cervix | CC | Toxoplasmosis | 34/1267 | 112/8465 | 2.42e-05 | 1.82e-04 | 1.08e-04 | 34 |
| hsa049172 | Cervix | CC | Prolactin signaling pathway | 18/1267 | 70/8465 | 1.29e-02 | 3.87e-02 | 2.29e-02 | 18 |
| hsa0412015 | Cervix | CC | Ubiquitin mediated proteolysis | 49/1267 | 142/8465 | 4.26e-09 | 7.68e-08 | 4.54e-08 | 49 |
| hsa0514515 | Cervix | CC | Toxoplasmosis | 34/1267 | 112/8465 | 2.42e-05 | 1.82e-04 | 1.08e-04 | 34 |
| hsa0491711 | Cervix | CC | Prolactin signaling pathway | 18/1267 | 70/8465 | 1.29e-02 | 3.87e-02 | 2.29e-02 | 18 |
| hsa0514522 | Cervix | HSIL_HPV | Toxoplasmosis | 22/459 | 112/8465 | 1.07e-07 | 3.14e-06 | 2.54e-06 | 22 |
| hsa0514532 | Cervix | HSIL_HPV | Toxoplasmosis | 22/459 | 112/8465 | 1.07e-07 | 3.14e-06 | 2.54e-06 | 22 |
| hsa0412027 | Esophagus | ESCC | Ubiquitin mediated proteolysis | 122/4205 | 142/8465 | 6.53e-20 | 7.29e-18 | 3.74e-18 | 122 |
| hsa0514525 | Esophagus | ESCC | Toxoplasmosis | 76/4205 | 112/8465 | 6.83e-05 | 2.90e-04 | 1.48e-04 | 76 |
| hsa049109 | Esophagus | ESCC | Insulin signaling pathway | 89/4205 | 137/8465 | 1.97e-04 | 7.32e-04 | 3.75e-04 | 89 |
| hsa0412036 | Esophagus | ESCC | Ubiquitin mediated proteolysis | 122/4205 | 142/8465 | 6.53e-20 | 7.29e-18 | 3.74e-18 | 122 |
| hsa05145111 | Esophagus | ESCC | Toxoplasmosis | 76/4205 | 112/8465 | 6.83e-05 | 2.90e-04 | 1.48e-04 | 76 |
| hsa0491014 | Esophagus | ESCC | Insulin signaling pathway | 89/4205 | 137/8465 | 1.97e-04 | 7.32e-04 | 3.75e-04 | 89 |
| hsa0412041 | Liver | HCC | Ubiquitin mediated proteolysis | 110/4020 | 142/8465 | 1.67e-13 | 3.74e-12 | 2.08e-12 | 110 |
| hsa0491041 | Liver | HCC | Insulin signaling pathway | 95/4020 | 137/8465 | 1.53e-07 | 1.97e-06 | 1.10e-06 | 95 |
| hsa0514521 | Liver | HCC | Toxoplasmosis | 70/4020 | 112/8465 | 9.25e-04 | 3.52e-03 | 1.96e-03 | 70 |
| hsa04917 | Liver | HCC | Prolactin signaling pathway | 43/4020 | 70/8465 | 1.30e-02 | 3.19e-02 | 1.78e-02 | 43 |
| hsa0412051 | Liver | HCC | Ubiquitin mediated proteolysis | 110/4020 | 142/8465 | 1.67e-13 | 3.74e-12 | 2.08e-12 | 110 |
| hsa0491051 | Liver | HCC | Insulin signaling pathway | 95/4020 | 137/8465 | 1.53e-07 | 1.97e-06 | 1.10e-06 | 95 |
| Page: 1 2 3 |
Top |
Cell-cell communication analysis |
| Identification of potential cell-cell interactions between two cell types and their ligand-receptor pairs for different disease states |
| Ligand | Receptor | LRpair | Pathway | Tissue | Disease Stage |
| Page: 1 |
Top |
Single-cell gene regulatory network inference analysis |
| Find out the significant the regulons (TFs) and the target genes of each regulon across cell types for different disease states |
| TF | Cell Type | Tissue | Disease Stage | Target Gene | RSS | Regulon Activity |
| ∗The dot plots of a searched regulon are shown for all cell subpopulations in each disease state of each tissue based on the regulon specific score inferred using pySCENIC and by calculating the average expression. |
| Page: 1 |
Top |
Somatic mutation of malignant transformation related genes |
| Annotation of somatic variants for genes involved in malignant transformation |
| Hugo Symbol | Variant Class | Variant Classification | dbSNP RS | HGVSc | HGVSp | HGVSp Short | SWISSPROT | BIOTYPE | SIFT | PolyPhen | Tumor Sample Barcode | Tissue | Histology | Sex | Age | Stage | Therapy Types | Drugs | Outcome |
| SOCS1 | SNV | Missense_Mutation | c.445G>A | p.Glu149Lys | p.E149K | O15524 | protein_coding | tolerated(1) | benign(0.001) | TCGA-AD-6895-01 | Colorectum | colon adenocarcinoma | Male | >=65 | III/IV | Unknown | Unknown | SD | |
| SOCS1 | SNV | Missense_Mutation | c.467C>T | p.Ala156Val | p.A156V | O15524 | protein_coding | tolerated(0.25) | benign(0.042) | TCGA-CK-4951-01 | Colorectum | colon adenocarcinoma | Female | >=65 | I/II | Unknown | Unknown | PD | |
| SOCS1 | deletion | Frame_Shift_Del | novel | c.586delN | p.Leu196SerfsTer9 | p.L196Sfs*9 | O15524 | protein_coding | TCGA-AA-3877-01 | Colorectum | colon adenocarcinoma | Female | >=65 | I/II | Unknown | Unknown | SD | ||
| SOCS1 | SNV | Missense_Mutation | novel | c.581N>C | p.Ile194Thr | p.I194T | O15524 | protein_coding | deleterious(0) | benign(0.143) | TCGA-AP-A059-01 | Endometrium | uterine corpus endometrioid carcinoma | Female | >=65 | I/II | Unknown | Unknown | SD |
| SOCS1 | SNV | Missense_Mutation | novel | c.601N>T | p.Arg201Cys | p.R201C | O15524 | protein_coding | deleterious(0) | probably_damaging(0.939) | TCGA-DF-A2KN-01 | Endometrium | uterine corpus endometrioid carcinoma | Female | Unknown | I/II | Unknown | Unknown | SD |
| SOCS1 | SNV | Missense_Mutation | novel | c.329A>T | p.Asn110Ile | p.N110I | O15524 | protein_coding | deleterious(0) | probably_damaging(0.953) | TCGA-EO-A22R-01 | Endometrium | uterine corpus endometrioid carcinoma | Female | <65 | I/II | Unknown | Unknown | SD |
| SOCS1 | SNV | Missense_Mutation | novel | c.370N>G | p.Thr124Ala | p.T124A | O15524 | protein_coding | tolerated(0.18) | possibly_damaging(0.525) | TCGA-EO-A3B0-01 | Endometrium | uterine corpus endometrioid carcinoma | Female | <65 | III/IV | Unknown | Unknown | SD |
| SOCS1 | deletion | Frame_Shift_Del | novel | c.594delC | p.Val199SerfsTer6 | p.V199Sfs*6 | O15524 | protein_coding | TCGA-DI-A1BU-01 | Endometrium | uterine corpus endometrioid carcinoma | Female | <65 | I/II | Chemotherapy | paclitaxel | SD | ||
| SOCS1 | SNV | Missense_Mutation | novel | c.271G>A | p.Glu91Lys | p.E91K | O15524 | protein_coding | tolerated(0.47) | benign(0.112) | TCGA-IQ-A61H-01 | Oral cavity | head & neck squamous cell carcinoma | Male | >=65 | I/II | Unknown | Unknown | SD |
| SOCS1 | SNV | Missense_Mutation | c.379N>T | p.Arg127Cys | p.R127C | O15524 | protein_coding | deleterious(0) | probably_damaging(1) | TCGA-CG-5721-01 | Stomach | stomach adenocarcinoma | Male | <65 | III/IV | Unknown | Unknown | SD |
| Page: 1 |
Top |
Related drugs of malignant transformation related genes |
| Identification of chemicals and drugs interact with genes involved in malignant transfromation |
| (DGIdb 4.0) |
| Entrez ID | Symbol | Category | Interaction Types | Drug Claim Name | Drug Name | PMIDs |
| 8651 | SOCS1 | CLINICALLY ACTIONABLE, KINASE | INSULIN | INSULIN | 18171911 | |
| 8651 | SOCS1 | CLINICALLY ACTIONABLE, KINASE | IL-2 | ALDESLEUKIN | 12928391 |
| Page: 1 |

Copyright 2023-Present -The University of Texas Health Science Center at Houston |