
|
|||||
|
 | |
| |
| |
| |
| |
| |
|
Gene: SND1 |
Gene summary for SND1 |
| Gene information | Species | Human | Gene symbol | SND1 | Gene ID | 27044 |
| Gene name | staphylococcal nuclease and tudor domain containing 1 | |
| Gene Alias | TDRD11 | |
| Cytomap | 7q32.1 | |
| Gene Type | protein-coding | GO ID | GO:0001503 | UniProtAcc | A0A140VK49 |
Top |
Malignant transformation analysis |
| Identification of the aberrant gene expression in precancerous and cancerous lesions by comparing the gene expression of stem-like cells in diseased tissues with normal stem cells |
| Entrez ID | Symbol | Replicates | Species | Organ | Tissue | Adj P-value | Log2FC | Malignancy |
| 27044 | SND1 | CCI_2 | Human | Cervix | CC | 8.64e-03 | 6.55e-01 | 0.5249 |
| 27044 | SND1 | HTA11_1391_2000001011 | Human | Colorectum | AD | 9.28e-06 | 6.99e-01 | -0.059 |
| 27044 | SND1 | HTA11_99999970781_79442 | Human | Colorectum | MSS | 6.80e-04 | 4.55e-01 | 0.294 |
| 27044 | SND1 | HTA11_99999965062_69753 | Human | Colorectum | MSI-H | 6.61e-24 | 1.46e+00 | 0.3487 |
| 27044 | SND1 | HTA11_99999965104_69814 | Human | Colorectum | MSS | 3.76e-18 | 1.15e+00 | 0.281 |
| 27044 | SND1 | HTA11_99999971662_82457 | Human | Colorectum | MSS | 9.93e-23 | 1.21e+00 | 0.3859 |
| 27044 | SND1 | A015-C-203 | Human | Colorectum | FAP | 1.12e-35 | -5.97e-01 | -0.1294 |
| 27044 | SND1 | A015-C-204 | Human | Colorectum | FAP | 9.28e-09 | -3.57e-01 | -0.0228 |
| 27044 | SND1 | A014-C-040 | Human | Colorectum | FAP | 9.61e-06 | -5.01e-01 | -0.1184 |
| 27044 | SND1 | A002-C-201 | Human | Colorectum | FAP | 2.28e-14 | -3.46e-01 | 0.0324 |
| 27044 | SND1 | A001-C-119 | Human | Colorectum | FAP | 4.93e-18 | -7.17e-01 | -0.1557 |
| 27044 | SND1 | A001-C-108 | Human | Colorectum | FAP | 3.74e-21 | -5.22e-01 | -0.0272 |
| 27044 | SND1 | A002-C-205 | Human | Colorectum | FAP | 9.20e-32 | -5.91e-01 | -0.1236 |
| 27044 | SND1 | A001-C-104 | Human | Colorectum | FAP | 1.07e-03 | -3.51e-01 | 0.0184 |
| 27044 | SND1 | A015-C-005 | Human | Colorectum | FAP | 1.04e-05 | -3.44e-01 | -0.0336 |
| 27044 | SND1 | A015-C-006 | Human | Colorectum | FAP | 1.96e-20 | -5.21e-01 | -0.0994 |
| 27044 | SND1 | A015-C-106 | Human | Colorectum | FAP | 1.30e-17 | -3.92e-01 | -0.0511 |
| 27044 | SND1 | A002-C-114 | Human | Colorectum | FAP | 8.47e-29 | -6.87e-01 | -0.1561 |
| 27044 | SND1 | A015-C-104 | Human | Colorectum | FAP | 7.76e-40 | -6.97e-01 | -0.1899 |
| 27044 | SND1 | A001-C-014 | Human | Colorectum | FAP | 7.20e-19 | -4.33e-01 | 0.0135 |
| Page: 1 2 3 4 5 6 7 8 9 10 11 |
| Tissue | Expression Dynamics | Abbreviation |
| Cervix | 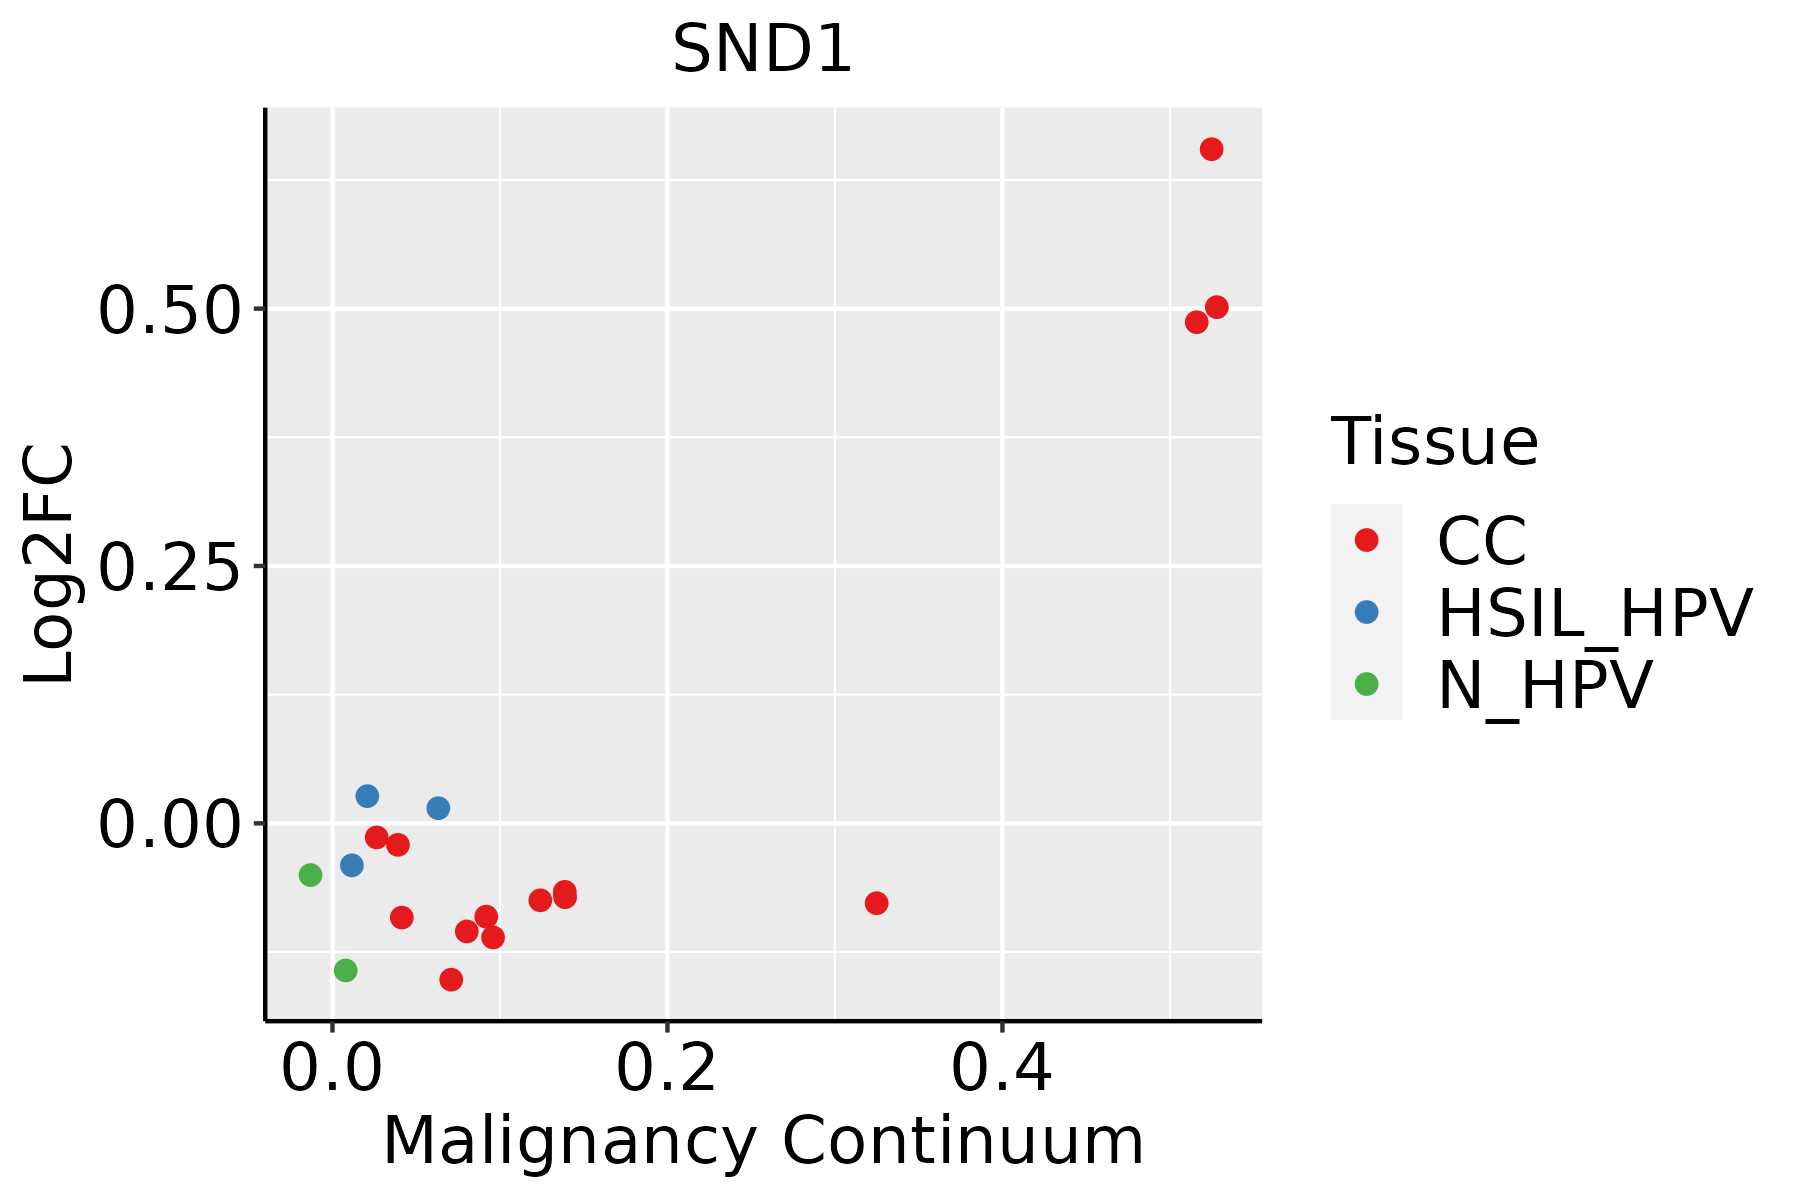 | CC: Cervix cancer |
| HSIL_HPV: HPV-infected high-grade squamous intraepithelial lesions | ||
| N_HPV: HPV-infected normal cervix | ||
| Colorectum (GSE201348) |  | FAP: Familial adenomatous polyposis |
| CRC: Colorectal cancer | ||
| Colorectum (HTA11) |  | AD: Adenomas |
| SER: Sessile serrated lesions | ||
| MSI-H: Microsatellite-high colorectal cancer | ||
| MSS: Microsatellite stable colorectal cancer | ||
| Endometrium | 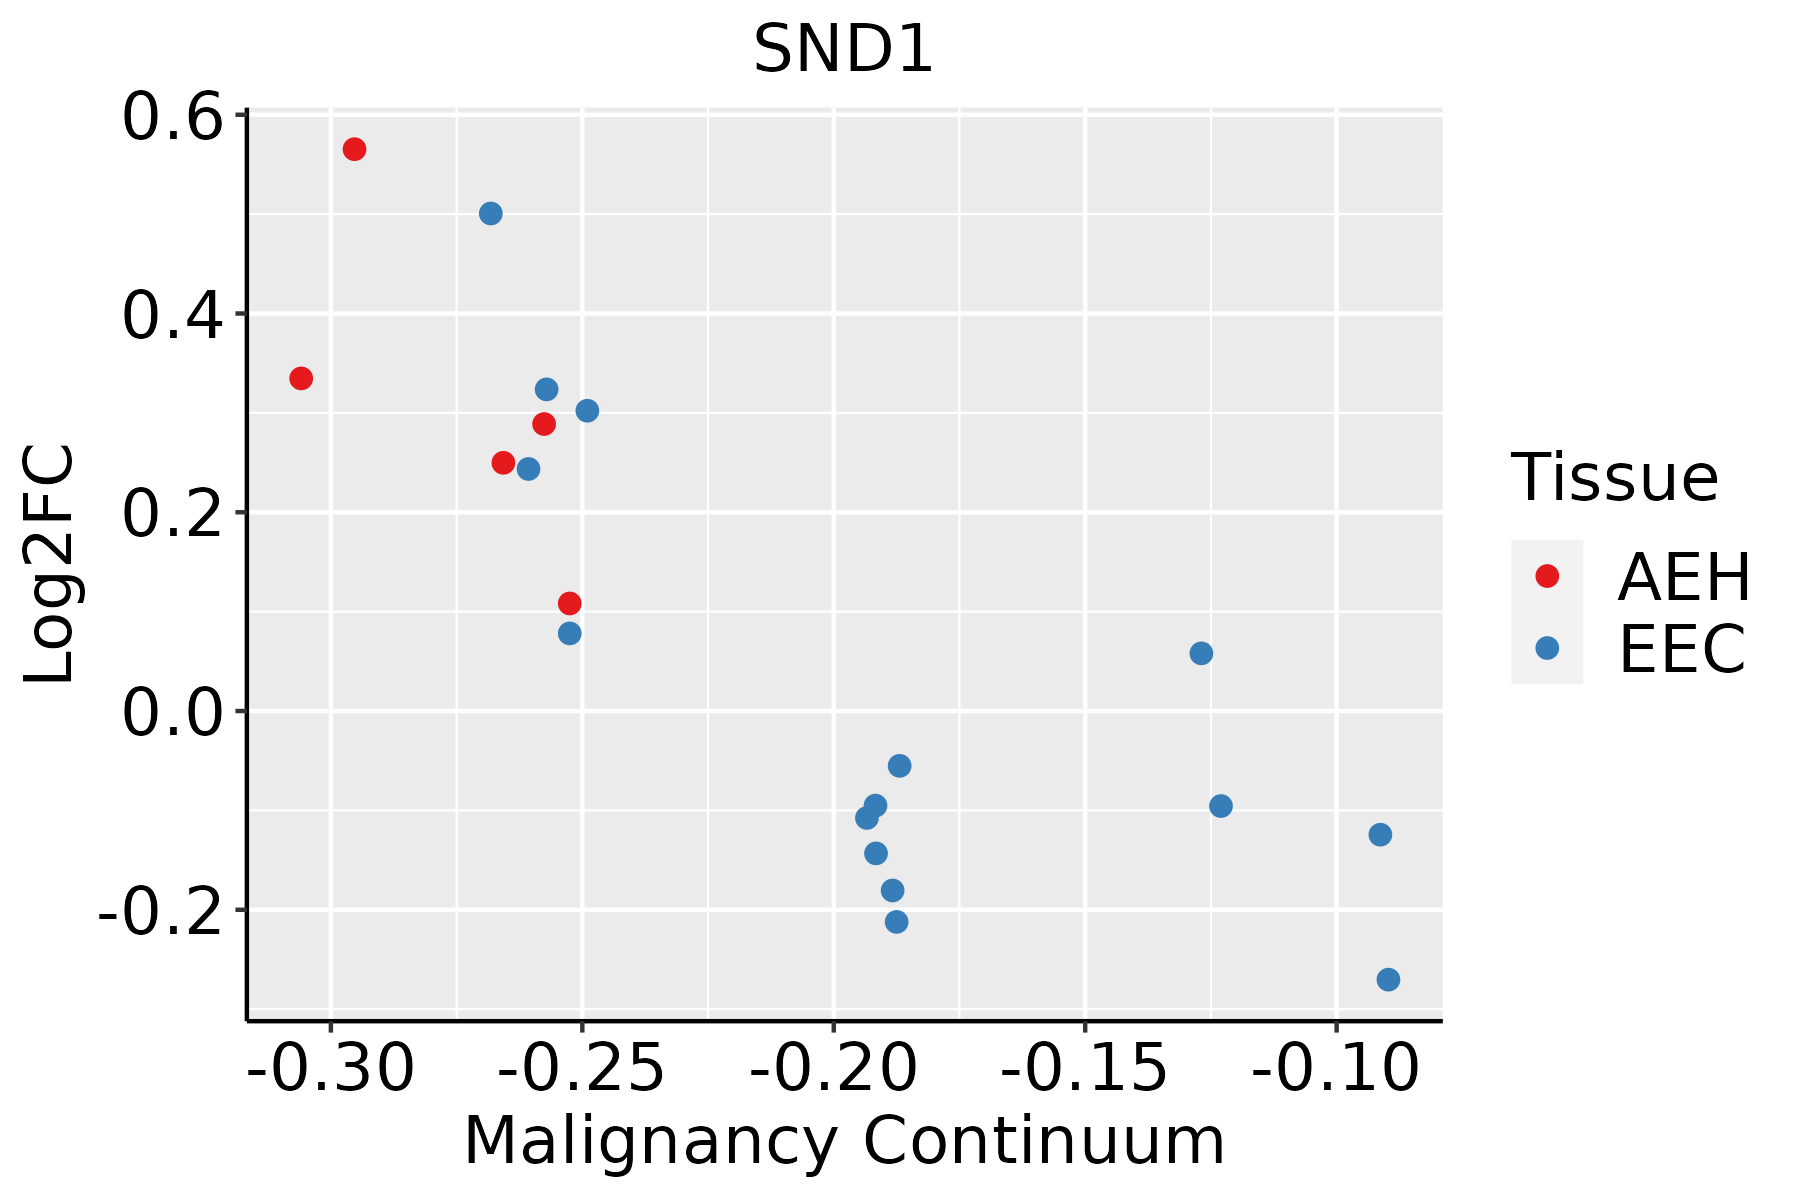 | AEH: Atypical endometrial hyperplasia |
| EEC: Endometrioid Cancer | ||
| Esophagus |  | ESCC: Esophageal squamous cell carcinoma |
| HGIN: High-grade intraepithelial neoplasias | ||
| LGIN: Low-grade intraepithelial neoplasias | ||
| Liver | 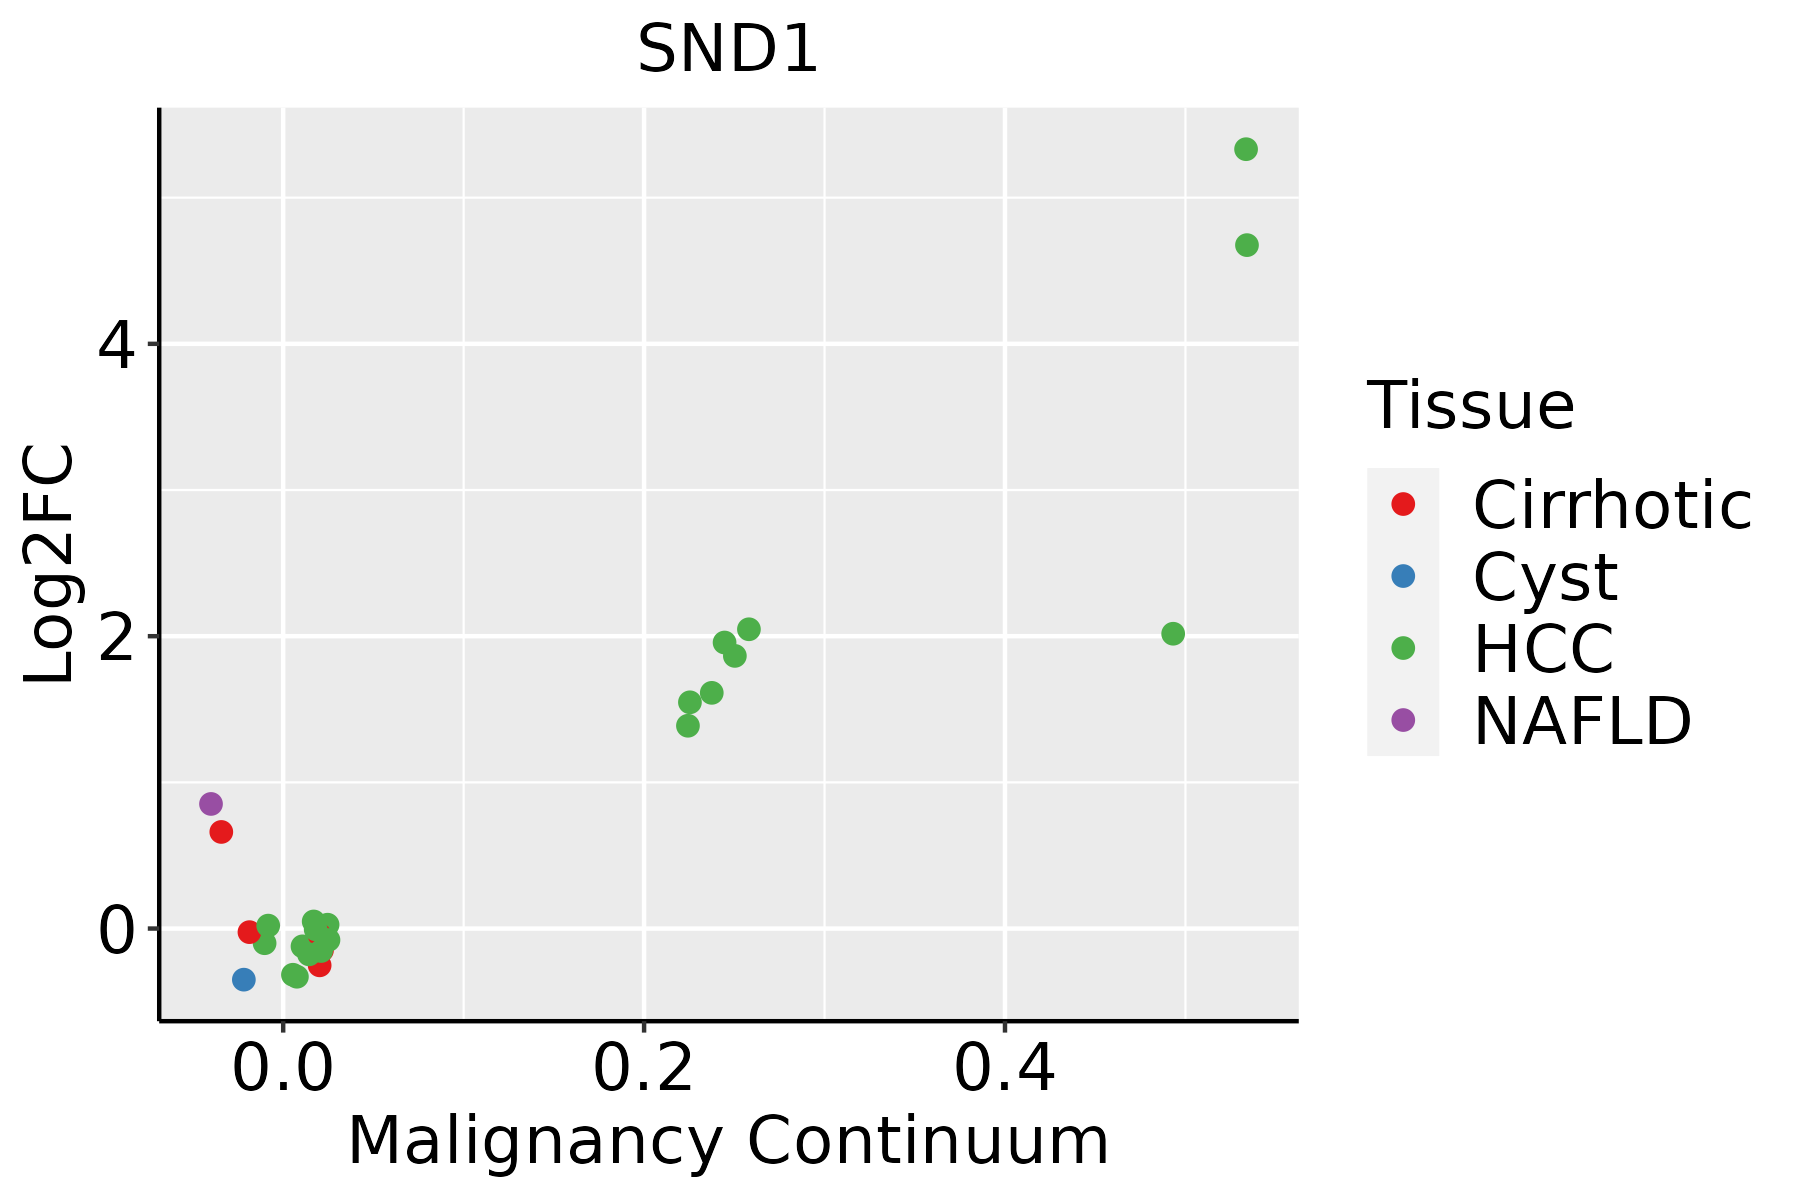 | HCC: Hepatocellular carcinoma |
| NAFLD: Non-alcoholic fatty liver disease | ||
| Lung | 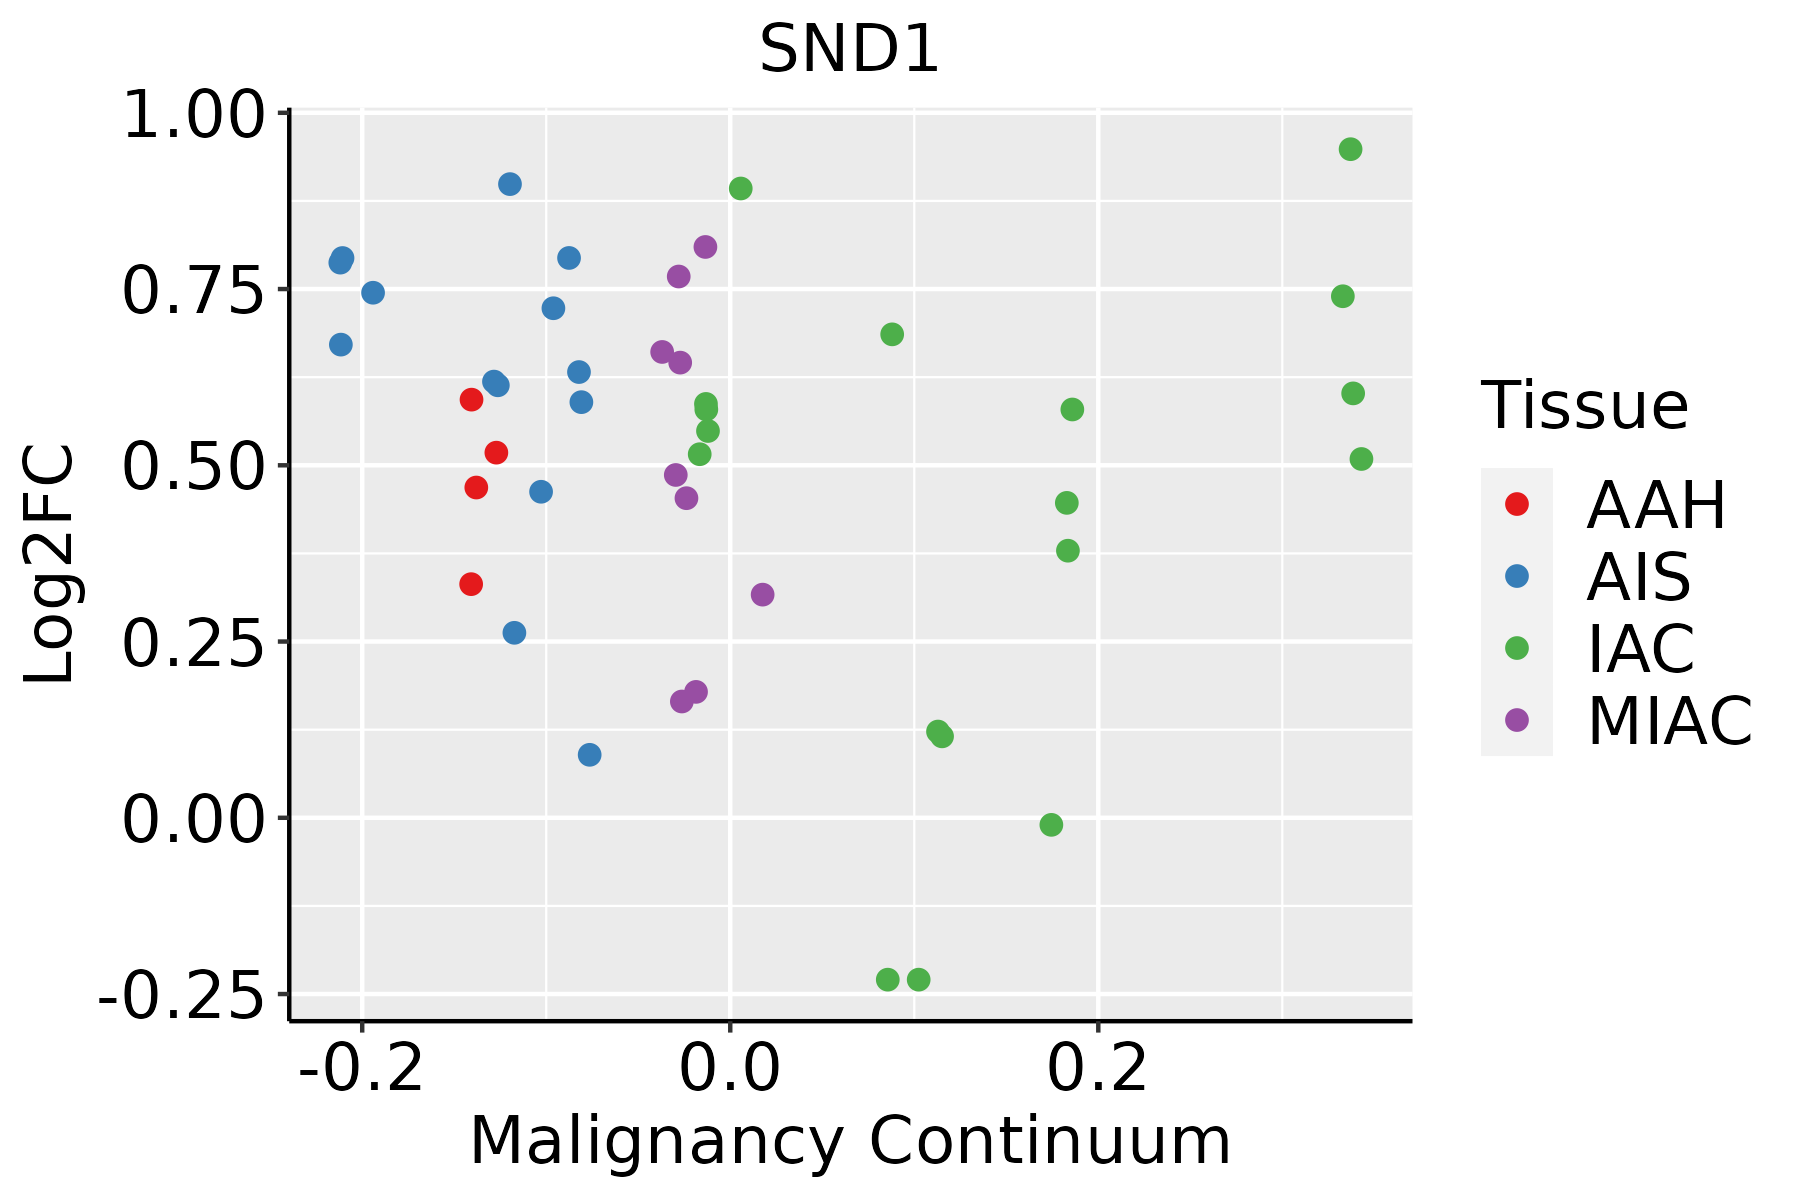 | AAH: Atypical adenomatous hyperplasia |
| AIS: Adenocarcinoma in situ | ||
| IAC: Invasive lung adenocarcinoma | ||
| MIA: Minimally invasive adenocarcinoma | ||
| Oral Cavity | 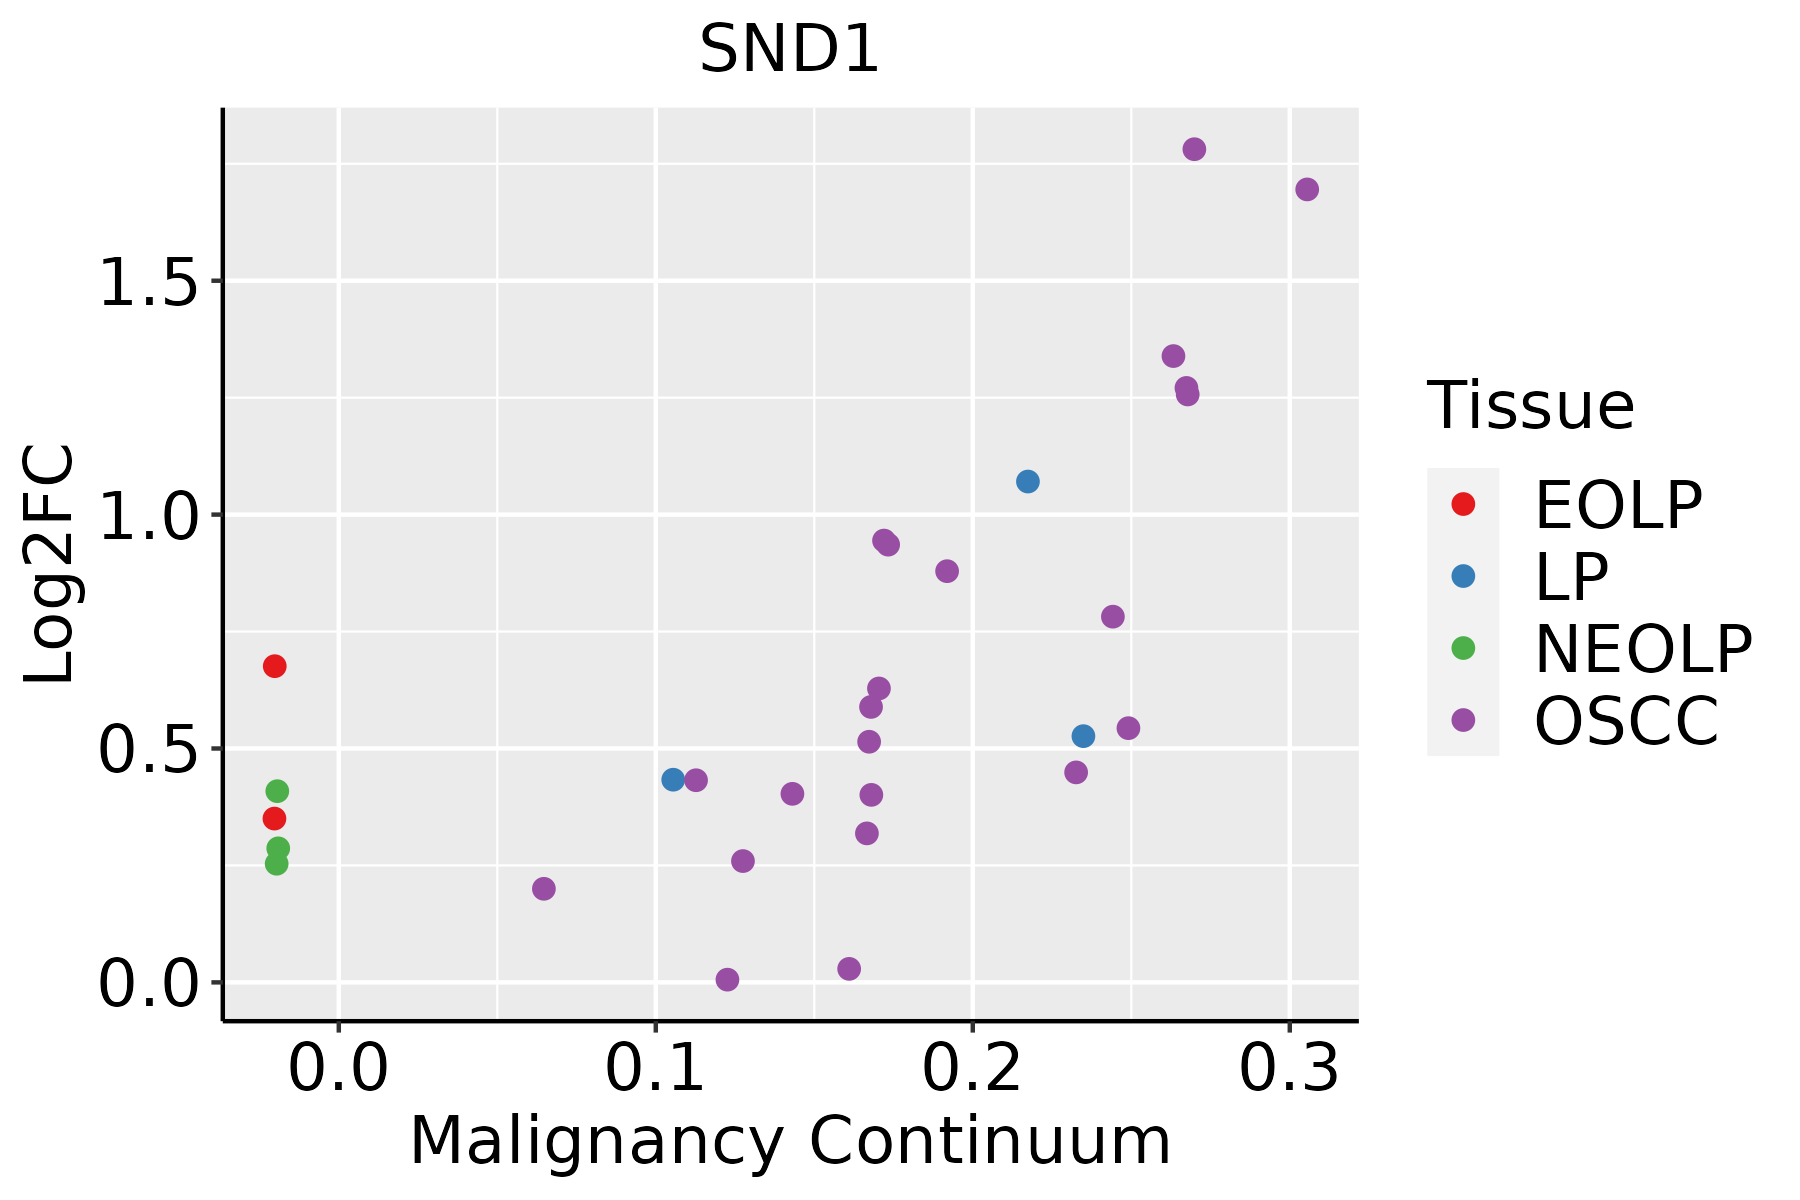 | EOLP: Erosive Oral lichen planus |
| LP: leukoplakia | ||
| NEOLP: Non-erosive oral lichen planus | ||
| OSCC: Oral squamous cell carcinoma | ||
| Prostate | 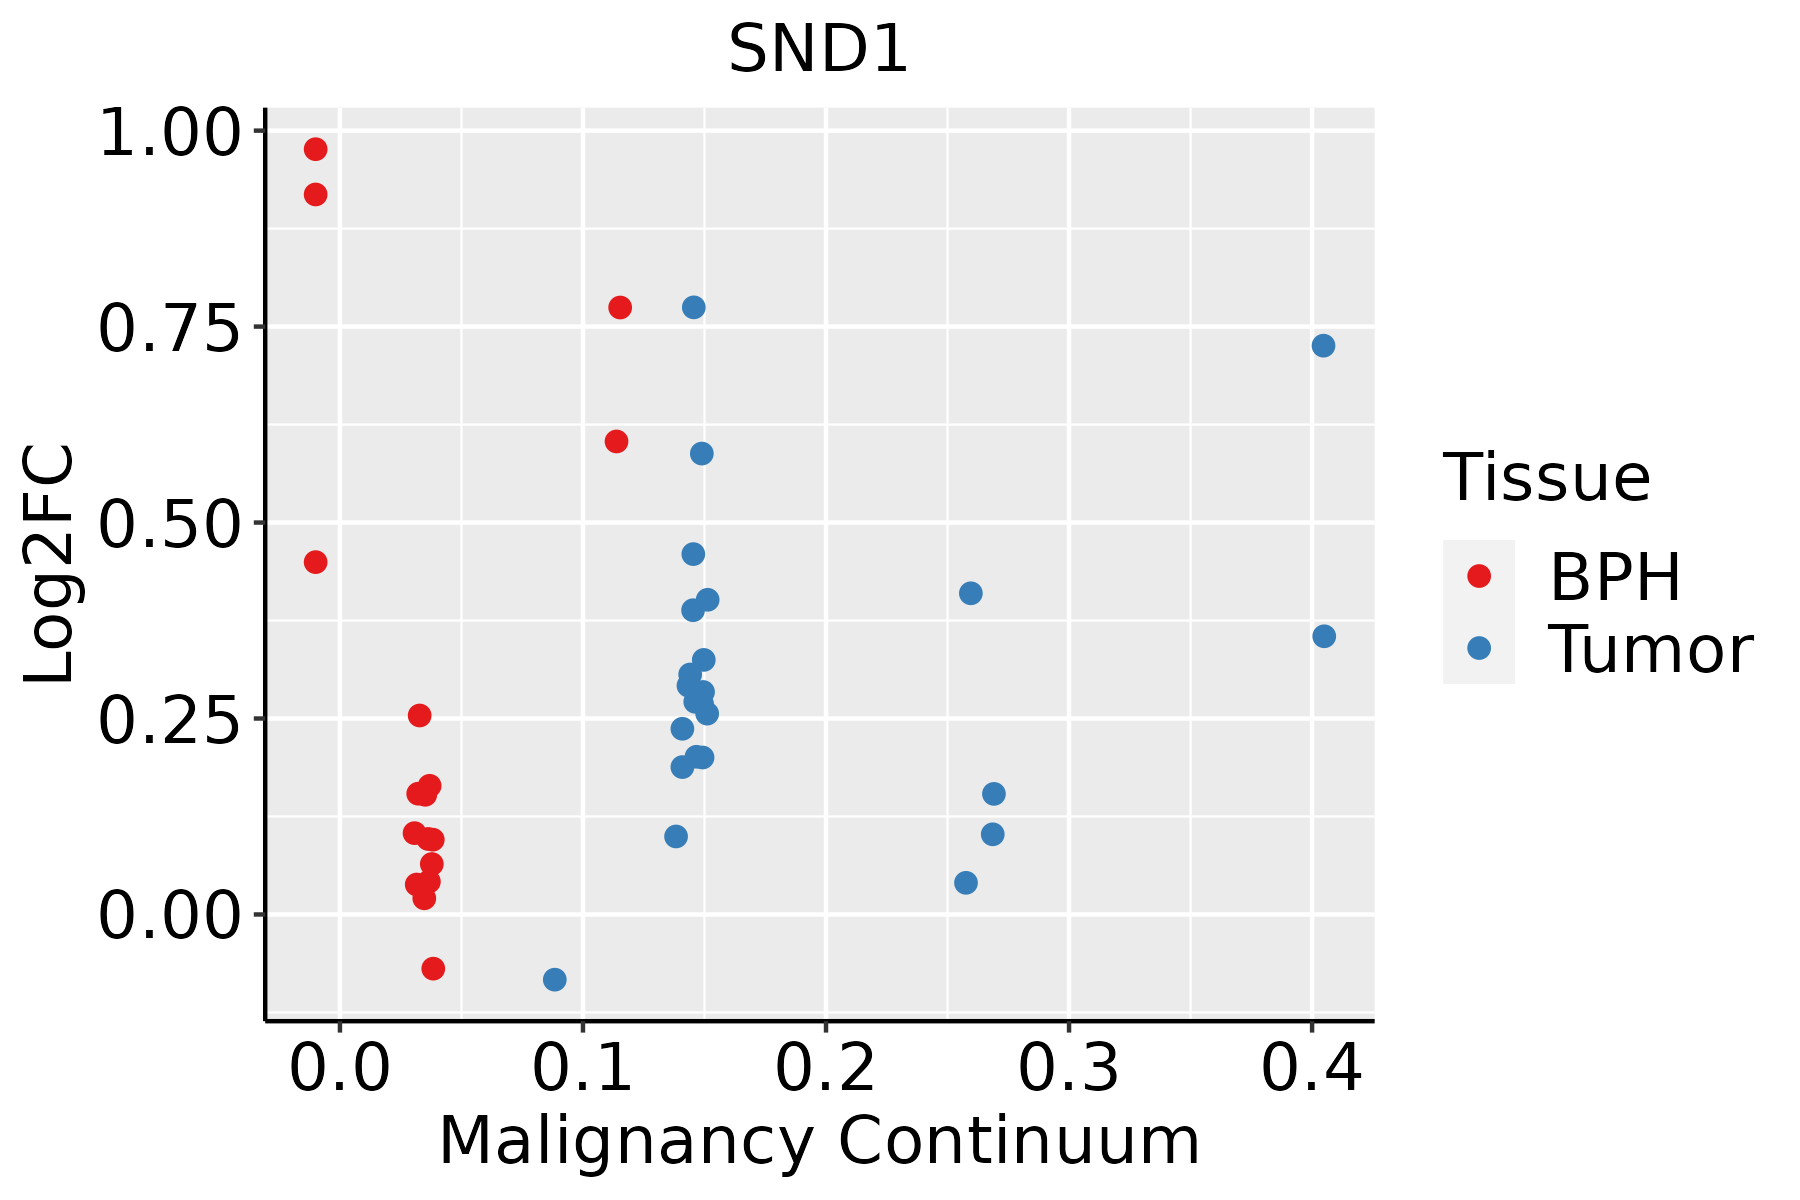 | BPH: Benign Prostatic Hyperplasia |
| Skin | 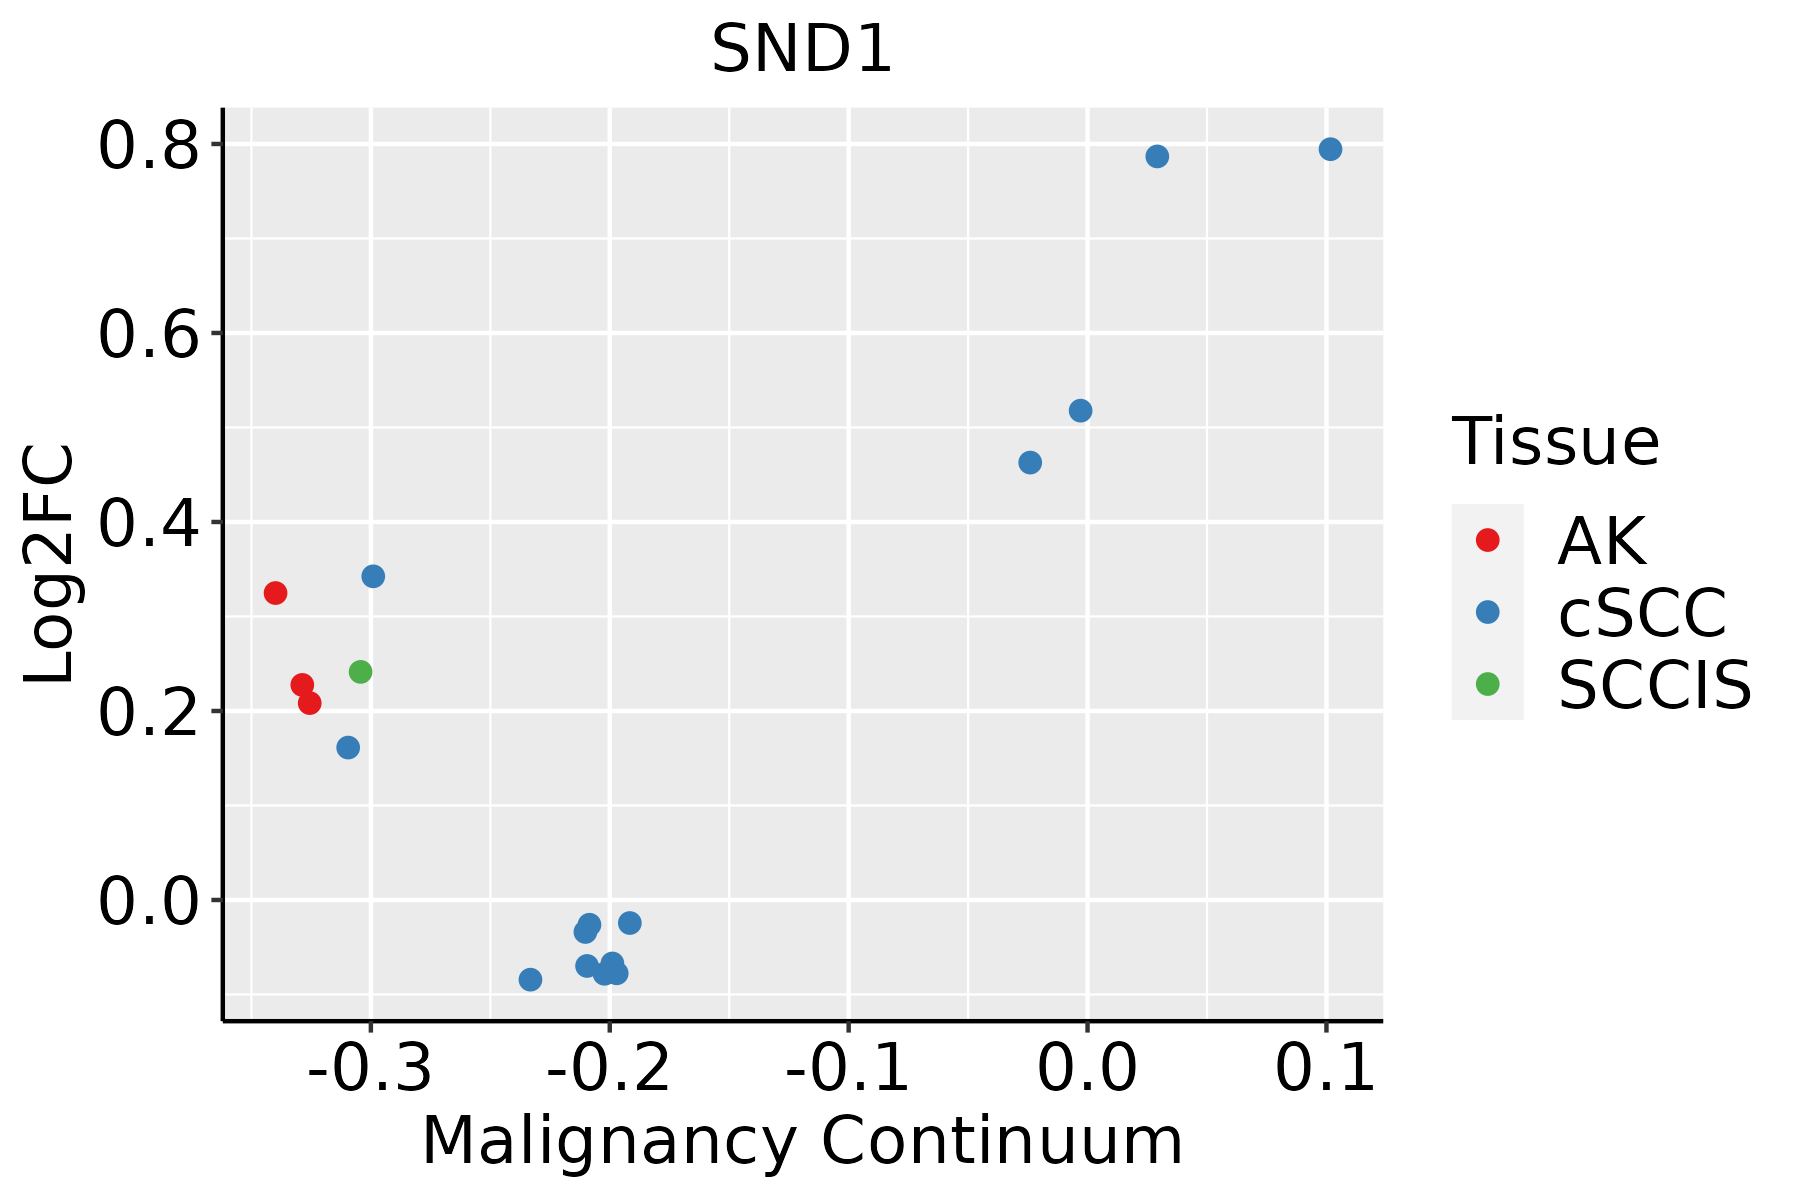 | AK: Actinic keratosis |
| cSCC: Cutaneous squamous cell carcinoma | ||
| SCCIS:squamous cell carcinoma in situ | ||
| Thyroid | 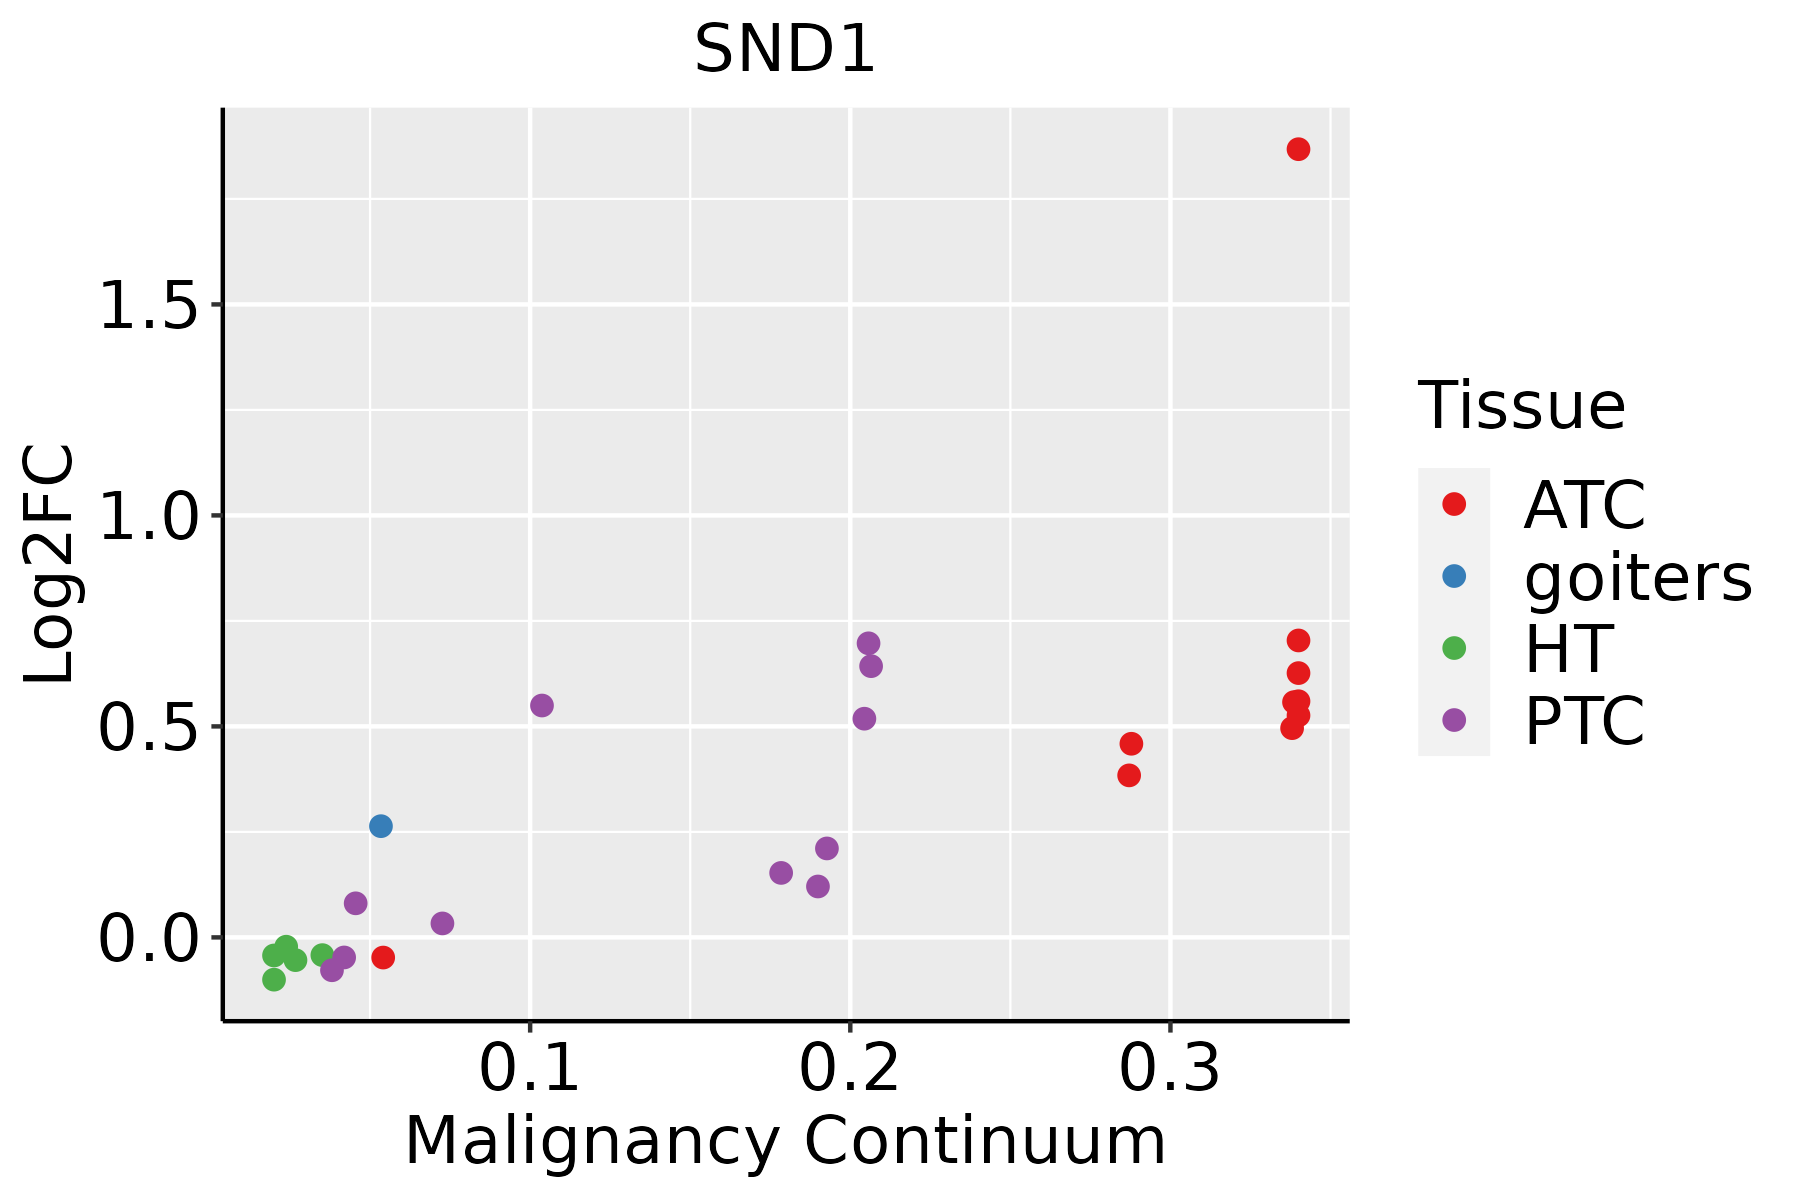 | ATC: Anaplastic thyroid cancer |
| HT: Hashimoto's thyroiditis | ||
| PTC: Papillary thyroid cancer |
| ∗log2FC in expression of this searched gene in stem-like cells from each diseased tissue sample relative to stem-like cells in normal samples in each tissue plotted against the malignancy continuum. Samples are colored based on if they are from different disease stage. |
Top |
Malignant transformation related pathway analysis |
| Find out the enriched GO biological processes and KEGG pathways involved in transition from healthy to precancer to cancer |
| Tissue | Disease Stage | Enriched GO biological Processes |
| Colorectum | AD |  |
| Colorectum | SER |  |
| Colorectum | MSS |  |
| Colorectum | MSI-H |  |
| Colorectum | FAP |  |
| ∗Top 15 enriched GO BP terms are showed in the bar plot of each disease state in each tissue. Each row represents a significant GO biological process which is colored according to the -log10(p.adjust). |
| Page: 1 2 3 4 5 6 7 8 9 |
| GO ID | Tissue | Disease Stage | Description | Gene Ratio | Bg Ratio | pvalue | p.adjust | Count |
| GO:004670019 | Skin | AK | heterocycle catabolic process | 64/1910 | 445/18723 | 3.01e-03 | 1.88e-02 | 64 |
| GO:004427020 | Skin | AK | cellular nitrogen compound catabolic process | 64/1910 | 451/18723 | 4.11e-03 | 2.41e-02 | 64 |
| GO:00105867 | Skin | AK | miRNA metabolic process | 8/1910 | 27/18723 | 4.35e-03 | 2.52e-02 | 8 |
| GO:001943919 | Skin | AK | aromatic compound catabolic process | 65/1910 | 467/18723 | 5.99e-03 | 3.24e-02 | 65 |
| GO:190136119 | Skin | AK | organic cyclic compound catabolic process | 67/1910 | 495/18723 | 9.91e-03 | 4.80e-02 | 67 |
| GO:0001649110 | Skin | SCCIS | osteoblast differentiation | 34/919 | 229/18723 | 7.78e-09 | 2.95e-06 | 34 |
| GO:000150319 | Skin | SCCIS | ossification | 47/919 | 408/18723 | 5.02e-08 | 8.19e-06 | 47 |
| GO:001058614 | Skin | SCCIS | miRNA metabolic process | 6/919 | 27/18723 | 1.68e-03 | 1.84e-02 | 6 |
| GO:003466013 | Skin | cSCC | ncRNA metabolic process | 234/4864 | 485/18723 | 1.37e-26 | 4.77e-24 | 234 |
| GO:0006401111 | Skin | cSCC | RNA catabolic process | 133/4864 | 278/18723 | 2.71e-15 | 2.23e-13 | 133 |
| GO:0006402111 | Skin | cSCC | mRNA catabolic process | 115/4864 | 232/18723 | 9.01e-15 | 6.57e-13 | 115 |
| GO:0034655111 | Skin | cSCC | nucleobase-containing compound catabolic process | 172/4864 | 407/18723 | 4.11e-13 | 2.43e-11 | 172 |
| GO:0046700110 | Skin | cSCC | heterocycle catabolic process | 178/4864 | 445/18723 | 4.45e-11 | 2.13e-09 | 178 |
| GO:0044270110 | Skin | cSCC | cellular nitrogen compound catabolic process | 179/4864 | 451/18723 | 8.34e-11 | 3.79e-09 | 179 |
| GO:0019439110 | Skin | cSCC | aromatic compound catabolic process | 183/4864 | 467/18723 | 1.76e-10 | 7.68e-09 | 183 |
| GO:1901361110 | Skin | cSCC | organic cyclic compound catabolic process | 188/4864 | 495/18723 | 1.92e-09 | 7.01e-08 | 188 |
| GO:00905014 | Skin | cSCC | RNA phosphodiester bond hydrolysis | 71/4864 | 152/18723 | 2.72e-08 | 7.41e-07 | 71 |
| GO:005160419 | Skin | cSCC | protein maturation | 117/4864 | 294/18723 | 1.27e-07 | 2.93e-06 | 117 |
| GO:000164923 | Skin | cSCC | osteoblast differentiation | 89/4864 | 229/18723 | 1.18e-05 | 1.51e-04 | 89 |
| GO:00903054 | Skin | cSCC | nucleic acid phosphodiester bond hydrolysis | 97/4864 | 261/18723 | 4.08e-05 | 4.34e-04 | 97 |
| Page: 1 2 3 4 5 6 7 8 9 10 11 12 13 14 15 16 |
| Pathway ID | Tissue | Disease Stage | Description | Gene Ratio | Bg Ratio | pvalue | p.adjust | qvalue | Count |
| hsa0520325 | Esophagus | ESCC | Viral carcinogenesis | 137/4205 | 204/8465 | 2.47e-07 | 1.88e-06 | 9.62e-07 | 137 |
| hsa0520335 | Esophagus | ESCC | Viral carcinogenesis | 137/4205 | 204/8465 | 2.47e-07 | 1.88e-06 | 9.62e-07 | 137 |
| hsa05203 | Liver | Cirrhotic | Viral carcinogenesis | 76/2530 | 204/8465 | 1.34e-02 | 4.20e-02 | 2.59e-02 | 76 |
| hsa052031 | Liver | Cirrhotic | Viral carcinogenesis | 76/2530 | 204/8465 | 1.34e-02 | 4.20e-02 | 2.59e-02 | 76 |
| hsa052032 | Liver | HCC | Viral carcinogenesis | 117/4020 | 204/8465 | 2.68e-03 | 8.98e-03 | 5.00e-03 | 117 |
| hsa052033 | Liver | HCC | Viral carcinogenesis | 117/4020 | 204/8465 | 2.68e-03 | 8.98e-03 | 5.00e-03 | 117 |
| hsa052034 | Lung | IAC | Viral carcinogenesis | 43/1053 | 204/8465 | 3.02e-04 | 3.07e-03 | 2.04e-03 | 43 |
| hsa0520311 | Lung | IAC | Viral carcinogenesis | 43/1053 | 204/8465 | 3.02e-04 | 3.07e-03 | 2.04e-03 | 43 |
| hsa0520321 | Lung | AIS | Viral carcinogenesis | 37/961 | 204/8465 | 2.49e-03 | 1.49e-02 | 9.55e-03 | 37 |
| hsa0520331 | Lung | AIS | Viral carcinogenesis | 37/961 | 204/8465 | 2.49e-03 | 1.49e-02 | 9.55e-03 | 37 |
| hsa052038 | Oral cavity | OSCC | Viral carcinogenesis | 124/3704 | 204/8465 | 5.57e-07 | 3.28e-06 | 1.67e-06 | 124 |
| hsa0520314 | Oral cavity | OSCC | Viral carcinogenesis | 124/3704 | 204/8465 | 5.57e-07 | 3.28e-06 | 1.67e-06 | 124 |
| hsa0520324 | Oral cavity | LP | Viral carcinogenesis | 90/2418 | 204/8465 | 1.20e-06 | 1.38e-05 | 8.89e-06 | 90 |
| hsa0520334 | Oral cavity | LP | Viral carcinogenesis | 90/2418 | 204/8465 | 1.20e-06 | 1.38e-05 | 8.89e-06 | 90 |
| hsa0520342 | Oral cavity | EOLP | Viral carcinogenesis | 55/1218 | 204/8465 | 1.54e-06 | 1.34e-05 | 7.92e-06 | 55 |
| hsa0520351 | Oral cavity | EOLP | Viral carcinogenesis | 55/1218 | 204/8465 | 1.54e-06 | 1.34e-05 | 7.92e-06 | 55 |
| hsa0520361 | Oral cavity | NEOLP | Viral carcinogenesis | 56/1112 | 204/8465 | 2.90e-08 | 5.34e-07 | 3.36e-07 | 56 |
| hsa0520371 | Oral cavity | NEOLP | Viral carcinogenesis | 56/1112 | 204/8465 | 2.90e-08 | 5.34e-07 | 3.36e-07 | 56 |
| hsa052037 | Prostate | BPH | Viral carcinogenesis | 69/1718 | 204/8465 | 3.40e-06 | 2.87e-05 | 1.78e-05 | 69 |
| hsa0520313 | Prostate | BPH | Viral carcinogenesis | 69/1718 | 204/8465 | 3.40e-06 | 2.87e-05 | 1.78e-05 | 69 |
| Page: 1 2 |
Top |
Cell-cell communication analysis |
| Identification of potential cell-cell interactions between two cell types and their ligand-receptor pairs for different disease states |
| Ligand | Receptor | LRpair | Pathway | Tissue | Disease Stage |
| Page: 1 |
Top |
Single-cell gene regulatory network inference analysis |
| Find out the significant the regulons (TFs) and the target genes of each regulon across cell types for different disease states |
| TF | Cell Type | Tissue | Disease Stage | Target Gene | RSS | Regulon Activity |
| SND1 | TREG | Esophagus | ADJ | LINC00324,ZNF292,MBLAC2, etc. | 3.19e-02 |  |
| SND1 | TREG | Esophagus | ESCC | LINC00324,ZNF292,MBLAC2, etc. | 1.33e-01 |  |
| ∗The dot plots of a searched regulon are shown for all cell subpopulations in each disease state of each tissue based on the regulon specific score inferred using pySCENIC and by calculating the average expression. |
| Page: 1 |
Top |
Somatic mutation of malignant transformation related genes |
| Annotation of somatic variants for genes involved in malignant transformation |
| Hugo Symbol | Variant Class | Variant Classification | dbSNP RS | HGVSc | HGVSp | HGVSp Short | SWISSPROT | BIOTYPE | SIFT | PolyPhen | Tumor Sample Barcode | Tissue | Histology | Sex | Age | Stage | Therapy Types | Drugs | Outcome |
| SND1 | SNV | Missense_Mutation | c.2662N>T | p.Ala888Ser | p.A888S | Q7KZF4 | protein_coding | tolerated(0.8) | benign(0.013) | TCGA-A2-A0ST-01 | Breast | breast invasive carcinoma | Female | <65 | I/II | Chemotherapy | adriamycin | SD | |
| SND1 | SNV | Missense_Mutation | c.2149N>T | p.Asp717Tyr | p.D717Y | Q7KZF4 | protein_coding | deleterious(0.04) | possibly_damaging(0.686) | TCGA-D8-A1JA-01 | Breast | breast invasive carcinoma | Female | <65 | III/IV | Chemotherapy | adriamycin | PD | |
| SND1 | SNV | Missense_Mutation | c.829N>G | p.Ile277Val | p.I277V | Q7KZF4 | protein_coding | tolerated(0.38) | benign(0.074) | TCGA-E2-A14R-01 | Breast | breast invasive carcinoma | Female | <65 | I/II | Chemotherapy | doxorubicin | PD | |
| SND1 | deletion | Frame_Shift_Del | c.752delT | p.Phe251SerfsTer39 | p.F251Sfs*39 | Q7KZF4 | protein_coding | TCGA-A8-A09Z-01 | Breast | breast invasive carcinoma | Female | >=65 | I/II | Unknown | Unknown | SD | |||
| SND1 | insertion | In_Frame_Ins | novel | c.2711_2712insTCATTCCTTTTTATGGCTAAGGGAGAGCTCTGG | p.Asp904_Glu905insHisSerPheLeuTrpLeuArgGluSerSerGly | p.D904_E905insHSFLWLRESSG | Q7KZF4 | protein_coding | TCGA-AO-A0J4-01 | Breast | breast invasive carcinoma | Female | <65 | I/II | Chemotherapy | doxorubicin | SD | ||
| SND1 | insertion | Frame_Shift_Ins | novel | c.2713_2714insCTTACCT | p.Glu905AlafsTer42 | p.E905Afs*42 | Q7KZF4 | protein_coding | TCGA-AO-A0J4-01 | Breast | breast invasive carcinoma | Female | <65 | I/II | Chemotherapy | doxorubicin | SD | ||
| SND1 | SNV | Missense_Mutation | novel | c.2060T>G | p.Val687Gly | p.V687G | Q7KZF4 | protein_coding | deleterious(0) | probably_damaging(0.955) | TCGA-2W-A8YY-01 | Cervix | cervical & endocervical cancer | Female | <65 | I/II | Chemotherapy | cisplatin | CR |
| SND1 | SNV | Missense_Mutation | c.241N>G | p.Pro81Ala | p.P81A | Q7KZF4 | protein_coding | deleterious(0.04) | benign(0.012) | TCGA-C5-A1BQ-01 | Cervix | cervical & endocervical cancer | Female | >=65 | III/IV | Chemotherapy | cisplatin | CR | |
| SND1 | SNV | Missense_Mutation | c.112N>G | p.Gln38Glu | p.Q38E | Q7KZF4 | protein_coding | tolerated(0.11) | benign(0.222) | TCGA-IR-A3LH-01 | Cervix | cervical & endocervical cancer | Female | <65 | I/II | Chemotherapy | cisplatin | CR | |
| SND1 | SNV | Missense_Mutation | c.835N>T | p.His279Tyr | p.H279Y | Q7KZF4 | protein_coding | deleterious(0.04) | possibly_damaging(0.737) | TCGA-JW-A5VL-01 | Cervix | cervical & endocervical cancer | Female | <65 | I/II | Unknown | Unknown | SD |
| Page: 1 2 3 4 5 6 7 8 9 10 11 12 |
Top |
Related drugs of malignant transformation related genes |
| Identification of chemicals and drugs interact with genes involved in malignant transfromation |
| (DGIdb 4.0) |
| Entrez ID | Symbol | Category | Interaction Types | Drug Claim Name | Drug Name | PMIDs |
| Page: 1 |

Copyright 2023-Present -The University of Texas Health Science Center at Houston |