
|
|||||
|
 | |
| |
| |
| |
| |
| |
|
Gene: RREB1 |
Gene summary for RREB1 |
| Gene information | Species | Human | Gene symbol | RREB1 | Gene ID | 6239 |
| Gene name | ras responsive element binding protein 1 | |
| Gene Alias | FINB | |
| Cytomap | 6p24.3 | |
| Gene Type | protein-coding | GO ID | GO:0000122 | UniProtAcc | A0A024QZU8 |
Top |
Malignant transformation analysis |
| Identification of the aberrant gene expression in precancerous and cancerous lesions by comparing the gene expression of stem-like cells in diseased tissues with normal stem cells |
| Entrez ID | Symbol | Replicates | Species | Organ | Tissue | Adj P-value | Log2FC | Malignancy |
| 6239 | RREB1 | CA_HPV_2 | Human | Cervix | CC | 2.30e-02 | 1.70e-01 | 0.0391 |
| 6239 | RREB1 | CCI_1 | Human | Cervix | CC | 8.14e-12 | 1.40e+00 | 0.528 |
| 6239 | RREB1 | CCI_2 | Human | Cervix | CC | 1.56e-12 | 1.34e+00 | 0.5249 |
| 6239 | RREB1 | CCI_3 | Human | Cervix | CC | 5.22e-17 | 1.49e+00 | 0.516 |
| 6239 | RREB1 | HTA11_3410_2000001011 | Human | Colorectum | AD | 5.91e-30 | -7.49e-01 | 0.0155 |
| 6239 | RREB1 | HTA11_3361_2000001011 | Human | Colorectum | AD | 2.54e-06 | -5.37e-01 | -0.1207 |
| 6239 | RREB1 | HTA11_546_2000001011 | Human | Colorectum | AD | 5.98e-03 | -4.03e-01 | -0.0842 |
| 6239 | RREB1 | HTA11_866_3004761011 | Human | Colorectum | AD | 1.15e-13 | -6.51e-01 | 0.096 |
| 6239 | RREB1 | HTA11_8622_2000001021 | Human | Colorectum | SER | 6.89e-04 | -7.30e-01 | 0.0528 |
| 6239 | RREB1 | HTA11_10711_2000001011 | Human | Colorectum | AD | 8.34e-04 | -5.48e-01 | 0.0338 |
| 6239 | RREB1 | HTA11_7696_3000711011 | Human | Colorectum | AD | 1.21e-13 | -5.44e-01 | 0.0674 |
| 6239 | RREB1 | HTA11_99999970781_79442 | Human | Colorectum | MSS | 7.08e-26 | -6.47e-01 | 0.294 |
| 6239 | RREB1 | HTA11_99999971662_82457 | Human | Colorectum | MSS | 9.49e-06 | -3.51e-01 | 0.3859 |
| 6239 | RREB1 | HTA11_99999974143_84620 | Human | Colorectum | MSS | 1.25e-28 | -6.24e-01 | 0.3005 |
| 6239 | RREB1 | A002-C-010 | Human | Colorectum | FAP | 4.16e-02 | -3.04e-01 | 0.242 |
| 6239 | RREB1 | A001-C-207 | Human | Colorectum | FAP | 2.73e-04 | -2.95e-01 | 0.1278 |
| 6239 | RREB1 | A015-C-203 | Human | Colorectum | FAP | 4.62e-36 | -5.48e-01 | -0.1294 |
| 6239 | RREB1 | A015-C-204 | Human | Colorectum | FAP | 2.71e-06 | -4.33e-01 | -0.0228 |
| 6239 | RREB1 | A014-C-040 | Human | Colorectum | FAP | 3.47e-07 | -5.89e-01 | -0.1184 |
| 6239 | RREB1 | A002-C-201 | Human | Colorectum | FAP | 3.01e-13 | -4.48e-01 | 0.0324 |
| Page: 1 2 3 4 5 6 7 8 |
| Tissue | Expression Dynamics | Abbreviation |
| Cervix | 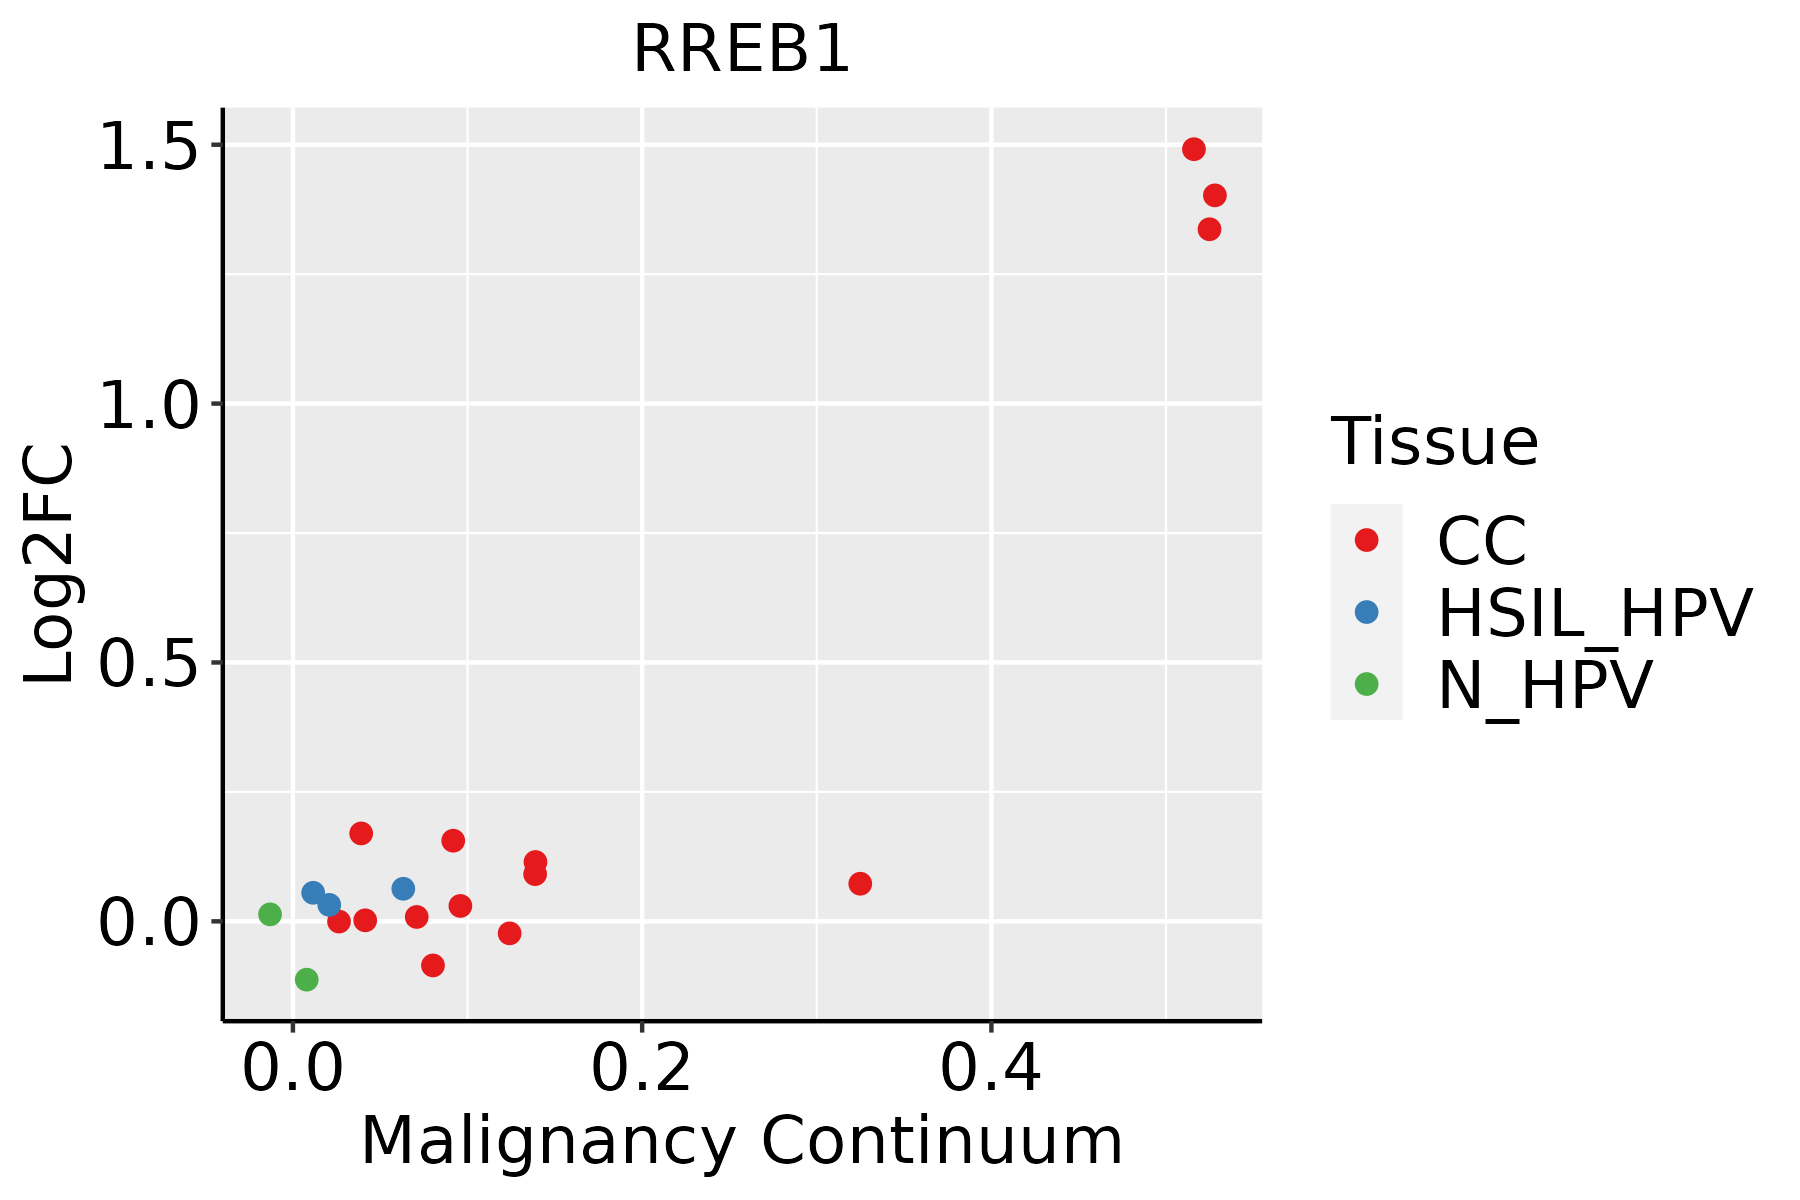 | CC: Cervix cancer |
| HSIL_HPV: HPV-infected high-grade squamous intraepithelial lesions | ||
| N_HPV: HPV-infected normal cervix | ||
| Colorectum (GSE201348) |  | FAP: Familial adenomatous polyposis |
| CRC: Colorectal cancer | ||
| Colorectum (HTA11) |  | AD: Adenomas |
| SER: Sessile serrated lesions | ||
| MSI-H: Microsatellite-high colorectal cancer | ||
| MSS: Microsatellite stable colorectal cancer | ||
| Esophagus |  | ESCC: Esophageal squamous cell carcinoma |
| HGIN: High-grade intraepithelial neoplasias | ||
| LGIN: Low-grade intraepithelial neoplasias | ||
| Oral Cavity |  | EOLP: Erosive Oral lichen planus |
| LP: leukoplakia | ||
| NEOLP: Non-erosive oral lichen planus | ||
| OSCC: Oral squamous cell carcinoma | ||
| Skin | 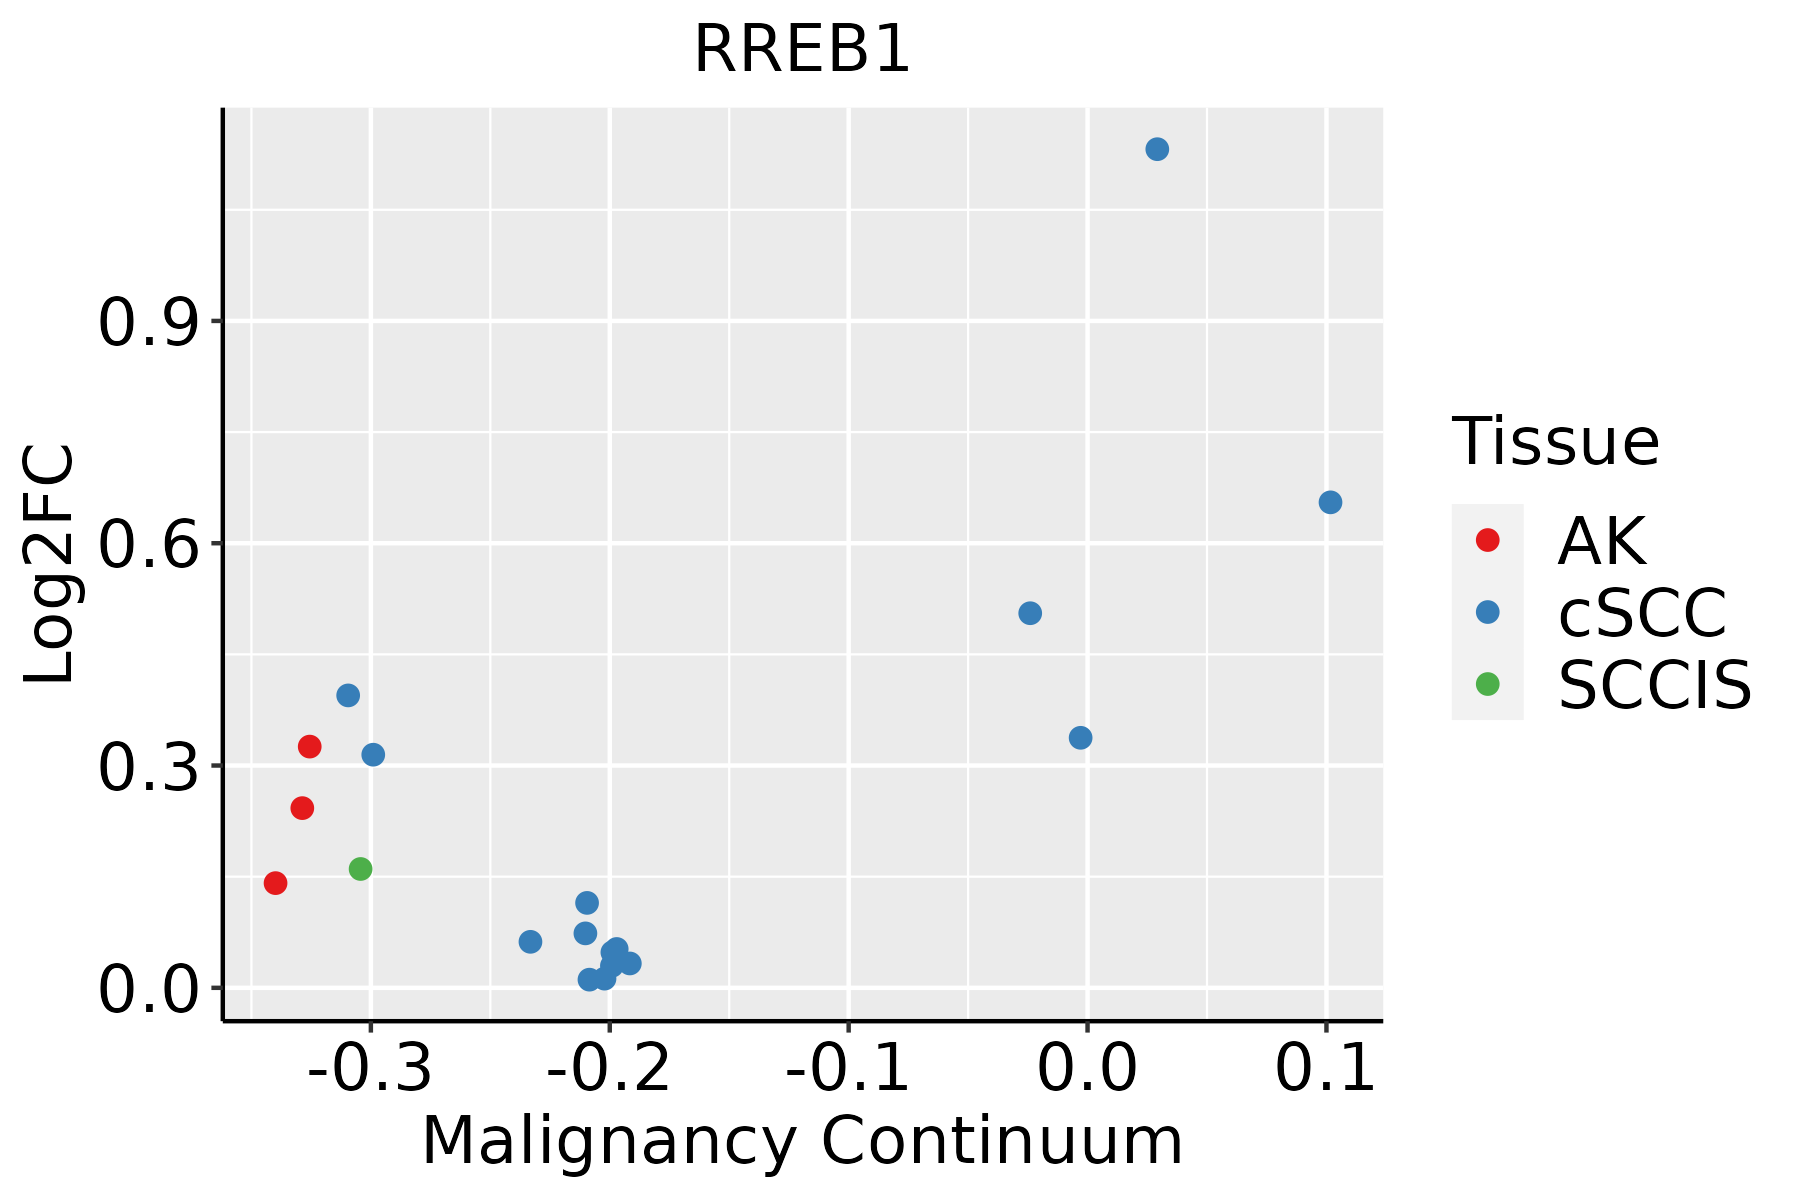 | AK: Actinic keratosis |
| cSCC: Cutaneous squamous cell carcinoma | ||
| SCCIS:squamous cell carcinoma in situ | ||
| Thyroid | 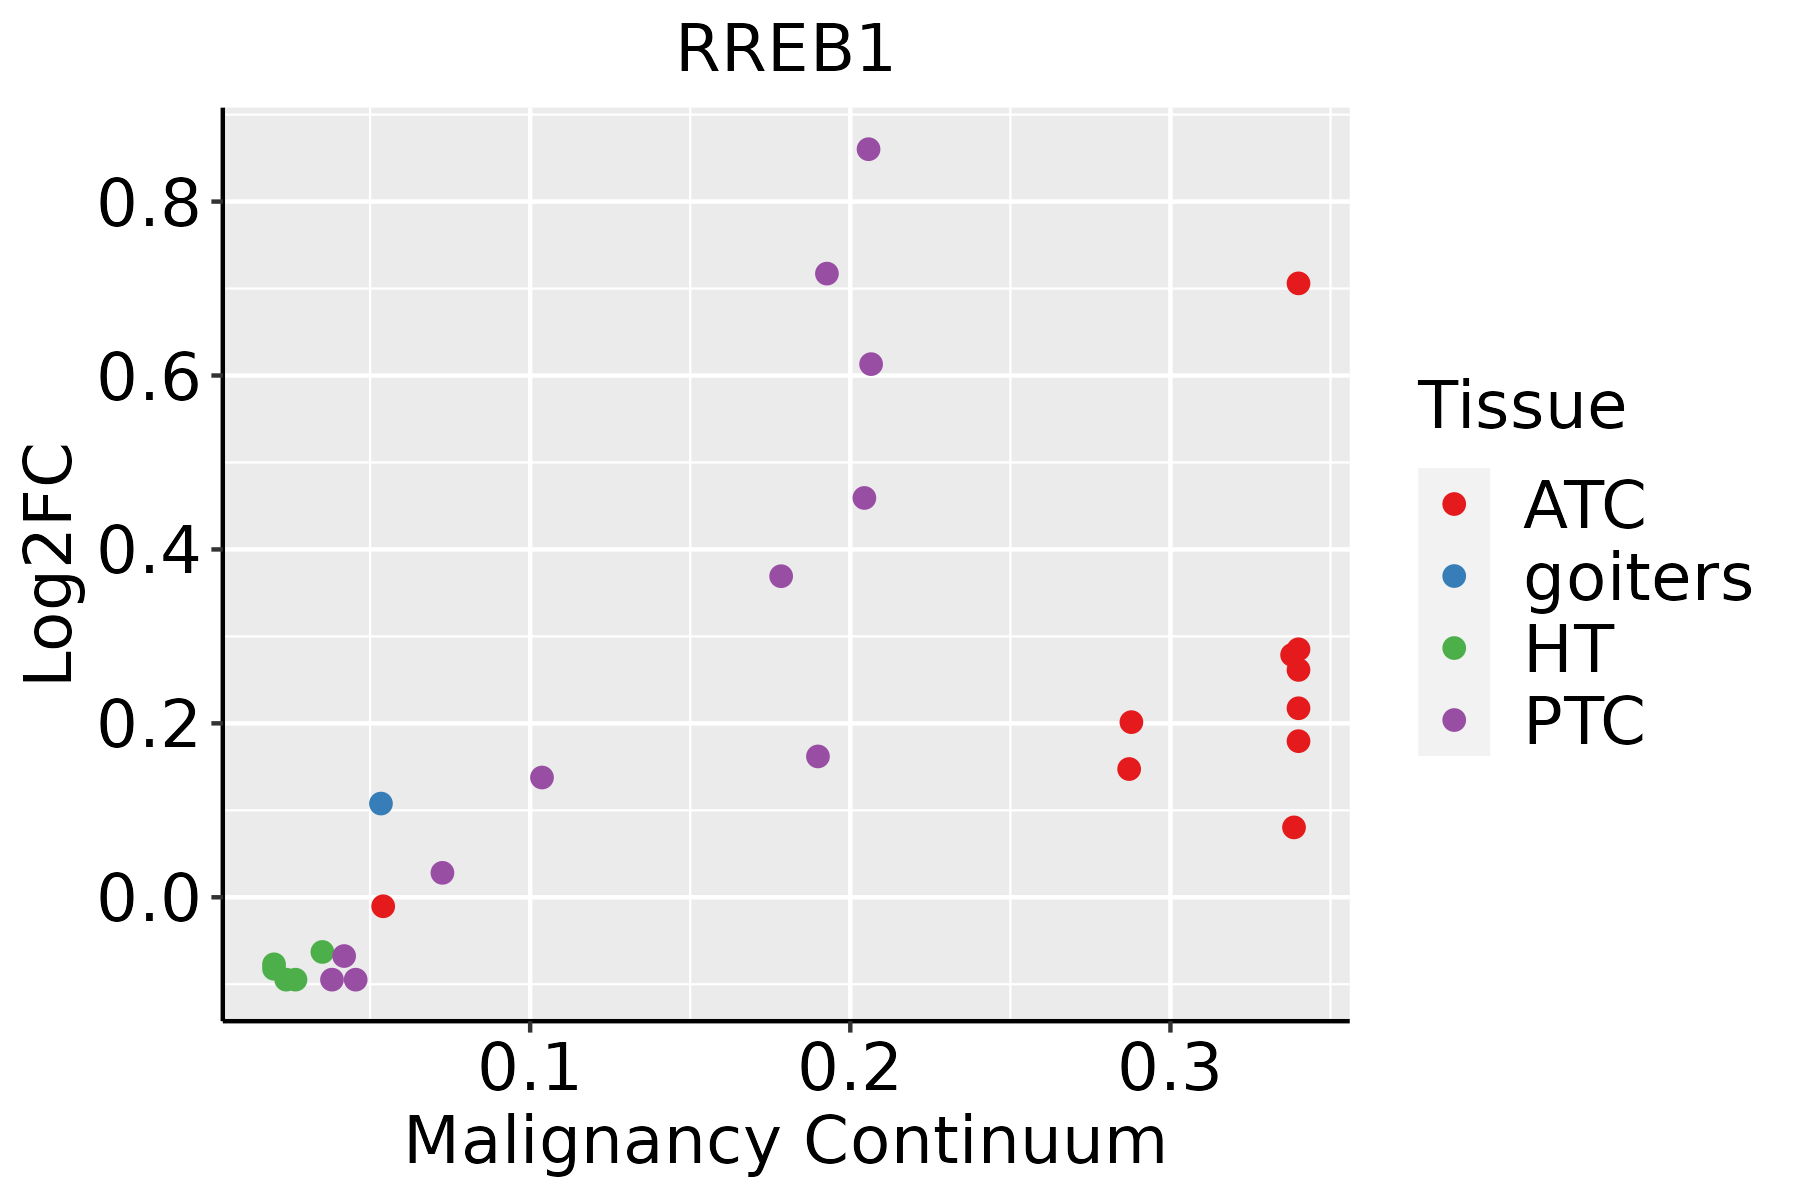 | ATC: Anaplastic thyroid cancer |
| HT: Hashimoto's thyroiditis | ||
| PTC: Papillary thyroid cancer |
| ∗log2FC in expression of this searched gene in stem-like cells from each diseased tissue sample relative to stem-like cells in normal samples in each tissue plotted against the malignancy continuum. Samples are colored based on if they are from different disease stage. |
Top |
Malignant transformation related pathway analysis |
| Find out the enriched GO biological processes and KEGG pathways involved in transition from healthy to precancer to cancer |
| Tissue | Disease Stage | Enriched GO biological Processes |
| Colorectum | AD |  |
| Colorectum | SER |  |
| Colorectum | MSS |  |
| Colorectum | MSI-H |  |
| Colorectum | FAP |  |
| ∗Top 15 enriched GO BP terms are showed in the bar plot of each disease state in each tissue. Each row represents a significant GO biological process which is colored according to the -log10(p.adjust). |
| Page: 1 2 3 4 5 6 7 8 9 |
| GO ID | Tissue | Disease Stage | Description | Gene Ratio | Bg Ratio | pvalue | p.adjust | Count |
| GO:006104116 | Oral cavity | OSCC | regulation of wound healing | 69/7305 | 134/18723 | 2.19e-03 | 9.95e-03 | 69 |
| GO:190303615 | Oral cavity | OSCC | positive regulation of response to wounding | 40/7305 | 72/18723 | 3.21e-03 | 1.38e-02 | 40 |
| GO:001076918 | Oral cavity | OSCC | regulation of cell morphogenesis involved in differentiation | 51/7305 | 96/18723 | 3.43e-03 | 1.45e-02 | 51 |
| GO:003087910 | Oral cavity | OSCC | mammary gland development | 69/7305 | 137/18723 | 4.43e-03 | 1.79e-02 | 69 |
| GO:190274310 | Oral cavity | OSCC | regulation of lamellipodium organization | 31/7305 | 54/18723 | 4.66e-03 | 1.87e-02 | 31 |
| GO:001063218 | Oral cavity | OSCC | regulation of epithelial cell migration | 136/7305 | 292/18723 | 4.82e-03 | 1.92e-02 | 136 |
| GO:20003924 | Oral cavity | OSCC | regulation of lamellipodium morphogenesis | 9/7305 | 11/18723 | 4.85e-03 | 1.92e-02 | 9 |
| GO:00335987 | Oral cavity | OSCC | mammary gland epithelial cell proliferation | 17/7305 | 26/18723 | 5.83e-03 | 2.23e-02 | 17 |
| GO:00903039 | Oral cavity | OSCC | positive regulation of wound healing | 33/7305 | 59/18723 | 6.17e-03 | 2.33e-02 | 33 |
| GO:190274510 | Oral cavity | OSCC | positive regulation of lamellipodium organization | 22/7305 | 37/18723 | 9.34e-03 | 3.34e-02 | 22 |
| GO:0090335 | Oral cavity | OSCC | regulation of brown fat cell differentiation | 15/7305 | 23/18723 | 9.84e-03 | 3.46e-02 | 15 |
| GO:004206026 | Oral cavity | EOLP | wound healing | 99/2218 | 422/18723 | 1.18e-11 | 1.85e-09 | 99 |
| GO:003158925 | Oral cavity | EOLP | cell-substrate adhesion | 84/2218 | 363/18723 | 8.71e-10 | 6.29e-08 | 84 |
| GO:004578526 | Oral cavity | EOLP | positive regulation of cell adhesion | 95/2218 | 437/18723 | 2.30e-09 | 1.47e-07 | 95 |
| GO:0001667110 | Oral cavity | EOLP | ameboidal-type cell migration | 100/2218 | 475/18723 | 5.24e-09 | 2.85e-07 | 100 |
| GO:001081025 | Oral cavity | EOLP | regulation of cell-substrate adhesion | 57/2218 | 221/18723 | 7.77e-09 | 3.94e-07 | 57 |
| GO:001063119 | Oral cavity | EOLP | epithelial cell migration | 80/2218 | 357/18723 | 1.03e-08 | 4.97e-07 | 80 |
| GO:009013219 | Oral cavity | EOLP | epithelium migration | 80/2218 | 360/18723 | 1.52e-08 | 6.97e-07 | 80 |
| GO:009013019 | Oral cavity | EOLP | tissue migration | 80/2218 | 365/18723 | 2.89e-08 | 1.16e-06 | 80 |
| GO:009758122 | Oral cavity | EOLP | lamellipodium organization | 30/2218 | 90/18723 | 6.89e-08 | 2.49e-06 | 30 |
| Page: 1 2 3 4 5 6 7 8 9 10 11 12 13 14 15 16 17 18 19 20 21 22 23 24 25 |
| Pathway ID | Tissue | Disease Stage | Description | Gene Ratio | Bg Ratio | pvalue | p.adjust | qvalue | Count |
| Page: 1 |
Top |
Cell-cell communication analysis |
| Identification of potential cell-cell interactions between two cell types and their ligand-receptor pairs for different disease states |
| Ligand | Receptor | LRpair | Pathway | Tissue | Disease Stage |
| Page: 1 |
Top |
Single-cell gene regulatory network inference analysis |
| Find out the significant the regulons (TFs) and the target genes of each regulon across cell types for different disease states |
| TF | Cell Type | Tissue | Disease Stage | Target Gene | RSS | Regulon Activity |
| RREB1 | ABS | Colorectum | SER | CDYL,GPR39,TCF7L2, etc. | 2.67e-01 |  |
| RREB1 | STM | Endometrium | ADJ | DAB2IP,LOXL2,SRSF8, etc. | 6.48e-01 |  |
| RREB1 | GRA | Oral cavity | Healthy | EPPK1,TRA2A,EIF5A, etc. | 9.53e-02 |  |
| RREB1 | DUCT1 | Pancreas | Healthy | JADE2,PTCH1,METTL2B, etc. | 4.19e-01 |  |
| RREB1 | STM | Thyroid | ADJ | NEAT1,MT-ND3,PHEX, etc. | 5.55e-01 |  |
| RREB1 | STM | Thyroid | PTC | NEAT1,MT-ND3,PHEX, etc. | 4.26e-01 |  |
| ∗The dot plots of a searched regulon are shown for all cell subpopulations in each disease state of each tissue based on the regulon specific score inferred using pySCENIC and by calculating the average expression. |
| Page: 1 |
Top |
Somatic mutation of malignant transformation related genes |
| Annotation of somatic variants for genes involved in malignant transformation |
| Hugo Symbol | Variant Class | Variant Classification | dbSNP RS | HGVSc | HGVSp | HGVSp Short | SWISSPROT | BIOTYPE | SIFT | PolyPhen | Tumor Sample Barcode | Tissue | Histology | Sex | Age | Stage | Therapy Types | Drugs | Outcome |
| RREB1 | SNV | Missense_Mutation | novel | c.4799N>C | p.Cys1600Ser | p.C1600S | Q92766 | protein_coding | deleterious(0) | probably_damaging(0.98) | TCGA-5L-AAT0-01 | Breast | breast invasive carcinoma | Female | <65 | I/II | Hormone Therapy | tamoxiphen | SD |
| RREB1 | SNV | Missense_Mutation | novel | c.953G>T | p.Cys318Phe | p.C318F | Q92766 | protein_coding | deleterious(0) | probably_damaging(0.999) | TCGA-5T-A9QA-01 | Breast | breast invasive carcinoma | Female | <65 | I/II | Chemotherapy | taxol | SD |
| RREB1 | SNV | Missense_Mutation | novel | c.4672G>A | p.Val1558Met | p.V1558M | Q92766 | protein_coding | tolerated(0.13) | benign(0.023) | TCGA-A2-A0CT-01 | Breast | breast invasive carcinoma | Female | >=65 | I/II | Chemotherapy | cytoxan | SD |
| RREB1 | SNV | Missense_Mutation | novel | c.220N>G | p.Ile74Val | p.I74V | Q92766 | protein_coding | tolerated(0.42) | benign(0.001) | TCGA-A8-A06P-01 | Breast | breast invasive carcinoma | Female | <65 | III/IV | Unspecific | SD | |
| RREB1 | SNV | Missense_Mutation | c.4658N>G | p.Asp1553Gly | p.D1553G | Q92766 | protein_coding | tolerated(0.12) | benign(0.42) | TCGA-A8-A09Z-01 | Breast | breast invasive carcinoma | Female | >=65 | I/II | Unknown | Unknown | SD | |
| RREB1 | SNV | Missense_Mutation | c.694G>A | p.Asp232Asn | p.D232N | Q92766 | protein_coding | tolerated(0.07) | possibly_damaging(0.892) | TCGA-AN-A0FY-01 | Breast | breast invasive carcinoma | Female | <65 | I/II | Unknown | Unknown | SD | |
| RREB1 | SNV | Missense_Mutation | c.1636C>T | p.Pro546Ser | p.P546S | Q92766 | protein_coding | tolerated(0.11) | benign(0.037) | TCGA-B6-A0RE-01 | Breast | breast invasive carcinoma | Female | <65 | I/II | Unknown | Unknown | SD | |
| RREB1 | SNV | Missense_Mutation | c.601N>A | p.Glu201Lys | p.E201K | Q92766 | protein_coding | tolerated(0.16) | benign(0.234) | TCGA-C8-A138-01 | Breast | breast invasive carcinoma | Female | <65 | III/IV | Unknown | Unknown | SD | |
| RREB1 | SNV | Missense_Mutation | c.4854N>C | p.Gln1618His | p.Q1618H | Q92766 | protein_coding | deleterious(0) | probably_damaging(0.994) | TCGA-C8-A27B-01 | Breast | breast invasive carcinoma | Female | <65 | I/II | Chemotherapy | 5-fluorouracil | CR | |
| RREB1 | SNV | Missense_Mutation | c.2088N>C | p.Glu696Asp | p.E696D | Q92766 | protein_coding | deleterious(0) | probably_damaging(0.984) | TCGA-D8-A1XQ-01 | Breast | breast invasive carcinoma | Female | >=65 | I/II | Unknown | Unknown | SD |
| Page: 1 2 3 4 5 6 7 8 9 10 11 12 13 14 15 |
Top |
Related drugs of malignant transformation related genes |
| Identification of chemicals and drugs interact with genes involved in malignant transfromation |
| (DGIdb 4.0) |
| Entrez ID | Symbol | Category | Interaction Types | Drug Claim Name | Drug Name | PMIDs |
| Page: 1 |

Copyright 2023-Present -The University of Texas Health Science Center at Houston |