
|
|||||
|
 | |
| |
| |
| |
| |
| |
|
Gene: RALB |
Gene summary for RALB |
| Gene information | Species | Human | Gene symbol | RALB | Gene ID | 5899 |
| Gene name | RAS like proto-oncogene B | |
| Gene Alias | RALB | |
| Cytomap | 2q14.2 | |
| Gene Type | protein-coding | GO ID | GO:0000045 | UniProtAcc | A0A024RAG3 |
Top |
Malignant transformation analysis |
| Identification of the aberrant gene expression in precancerous and cancerous lesions by comparing the gene expression of stem-like cells in diseased tissues with normal stem cells |
| Entrez ID | Symbol | Replicates | Species | Organ | Tissue | Adj P-value | Log2FC | Malignancy |
| 5899 | RALB | LZE2T | Human | Esophagus | ESCC | 7.09e-03 | 5.93e-01 | 0.082 |
| 5899 | RALB | LZE4T | Human | Esophagus | ESCC | 5.80e-11 | 3.71e-01 | 0.0811 |
| 5899 | RALB | LZE8T | Human | Esophagus | ESCC | 2.12e-03 | 9.81e-02 | 0.067 |
| 5899 | RALB | LZE20T | Human | Esophagus | ESCC | 9.93e-03 | 1.27e-01 | 0.0662 |
| 5899 | RALB | LZE22T | Human | Esophagus | ESCC | 4.77e-02 | 1.78e-01 | 0.068 |
| 5899 | RALB | LZE24T | Human | Esophagus | ESCC | 1.62e-11 | 2.89e-01 | 0.0596 |
| 5899 | RALB | P1T-E | Human | Esophagus | ESCC | 4.60e-04 | 2.11e-01 | 0.0875 |
| 5899 | RALB | P2T-E | Human | Esophagus | ESCC | 7.65e-10 | 2.51e-01 | 0.1177 |
| 5899 | RALB | P4T-E | Human | Esophagus | ESCC | 9.41e-29 | 5.41e-01 | 0.1323 |
| 5899 | RALB | P5T-E | Human | Esophagus | ESCC | 1.81e-14 | 4.38e-01 | 0.1327 |
| 5899 | RALB | P8T-E | Human | Esophagus | ESCC | 9.12e-15 | 3.58e-01 | 0.0889 |
| 5899 | RALB | P9T-E | Human | Esophagus | ESCC | 8.98e-13 | 3.33e-01 | 0.1131 |
| 5899 | RALB | P10T-E | Human | Esophagus | ESCC | 3.32e-30 | 8.53e-01 | 0.116 |
| 5899 | RALB | P11T-E | Human | Esophagus | ESCC | 4.09e-10 | 4.24e-01 | 0.1426 |
| 5899 | RALB | P12T-E | Human | Esophagus | ESCC | 1.12e-26 | 8.77e-01 | 0.1122 |
| 5899 | RALB | P15T-E | Human | Esophagus | ESCC | 5.76e-26 | 5.96e-01 | 0.1149 |
| 5899 | RALB | P16T-E | Human | Esophagus | ESCC | 1.90e-13 | 1.59e-01 | 0.1153 |
| 5899 | RALB | P17T-E | Human | Esophagus | ESCC | 7.55e-10 | 4.07e-01 | 0.1278 |
| 5899 | RALB | P19T-E | Human | Esophagus | ESCC | 2.82e-09 | 7.54e-01 | 0.1662 |
| 5899 | RALB | P20T-E | Human | Esophagus | ESCC | 7.93e-11 | 2.44e-01 | 0.1124 |
| Page: 1 2 3 4 5 6 |
| Tissue | Expression Dynamics | Abbreviation |
| Esophagus | 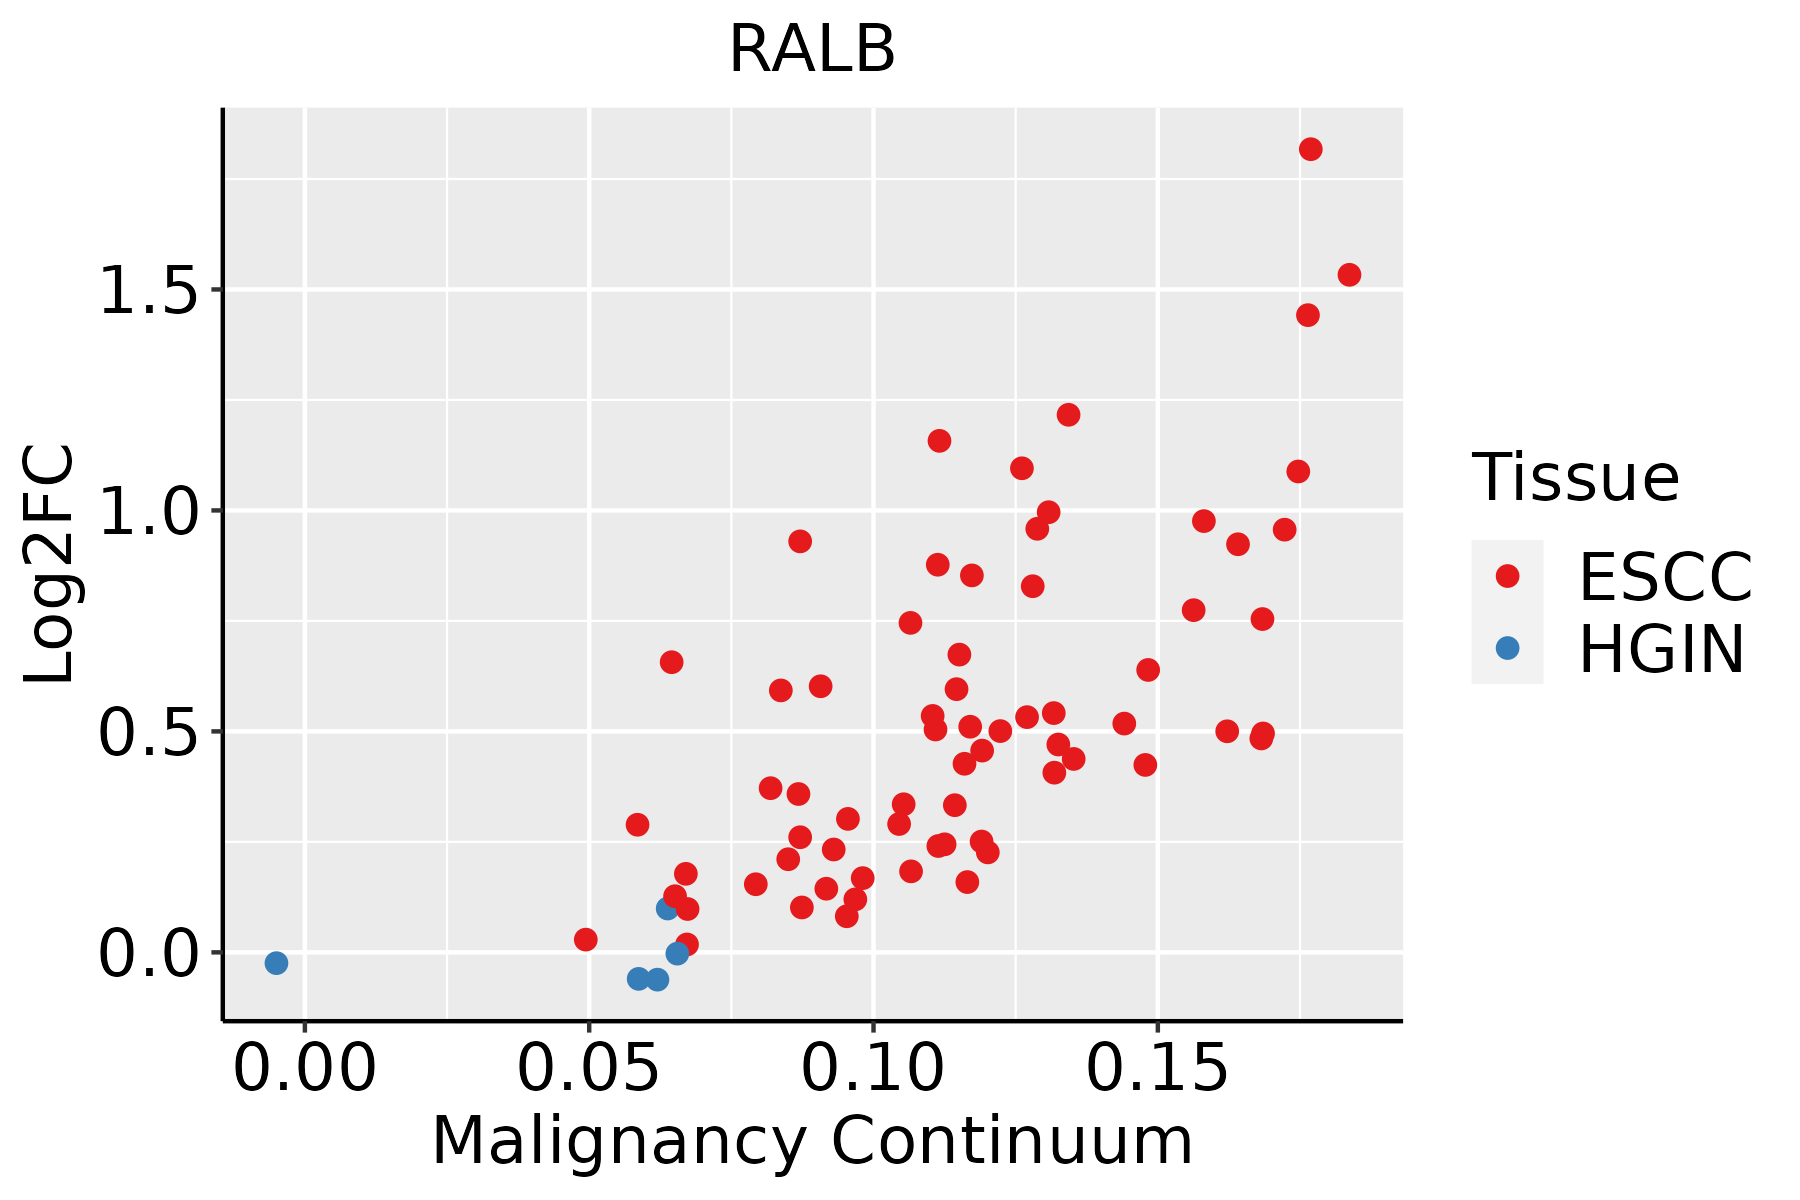 | ESCC: Esophageal squamous cell carcinoma |
| HGIN: High-grade intraepithelial neoplasias | ||
| LGIN: Low-grade intraepithelial neoplasias | ||
| Liver |  | HCC: Hepatocellular carcinoma |
| NAFLD: Non-alcoholic fatty liver disease | ||
| Oral Cavity |  | EOLP: Erosive Oral lichen planus |
| LP: leukoplakia | ||
| NEOLP: Non-erosive oral lichen planus | ||
| OSCC: Oral squamous cell carcinoma | ||
| Skin |  | AK: Actinic keratosis |
| cSCC: Cutaneous squamous cell carcinoma | ||
| SCCIS:squamous cell carcinoma in situ | ||
| Thyroid | 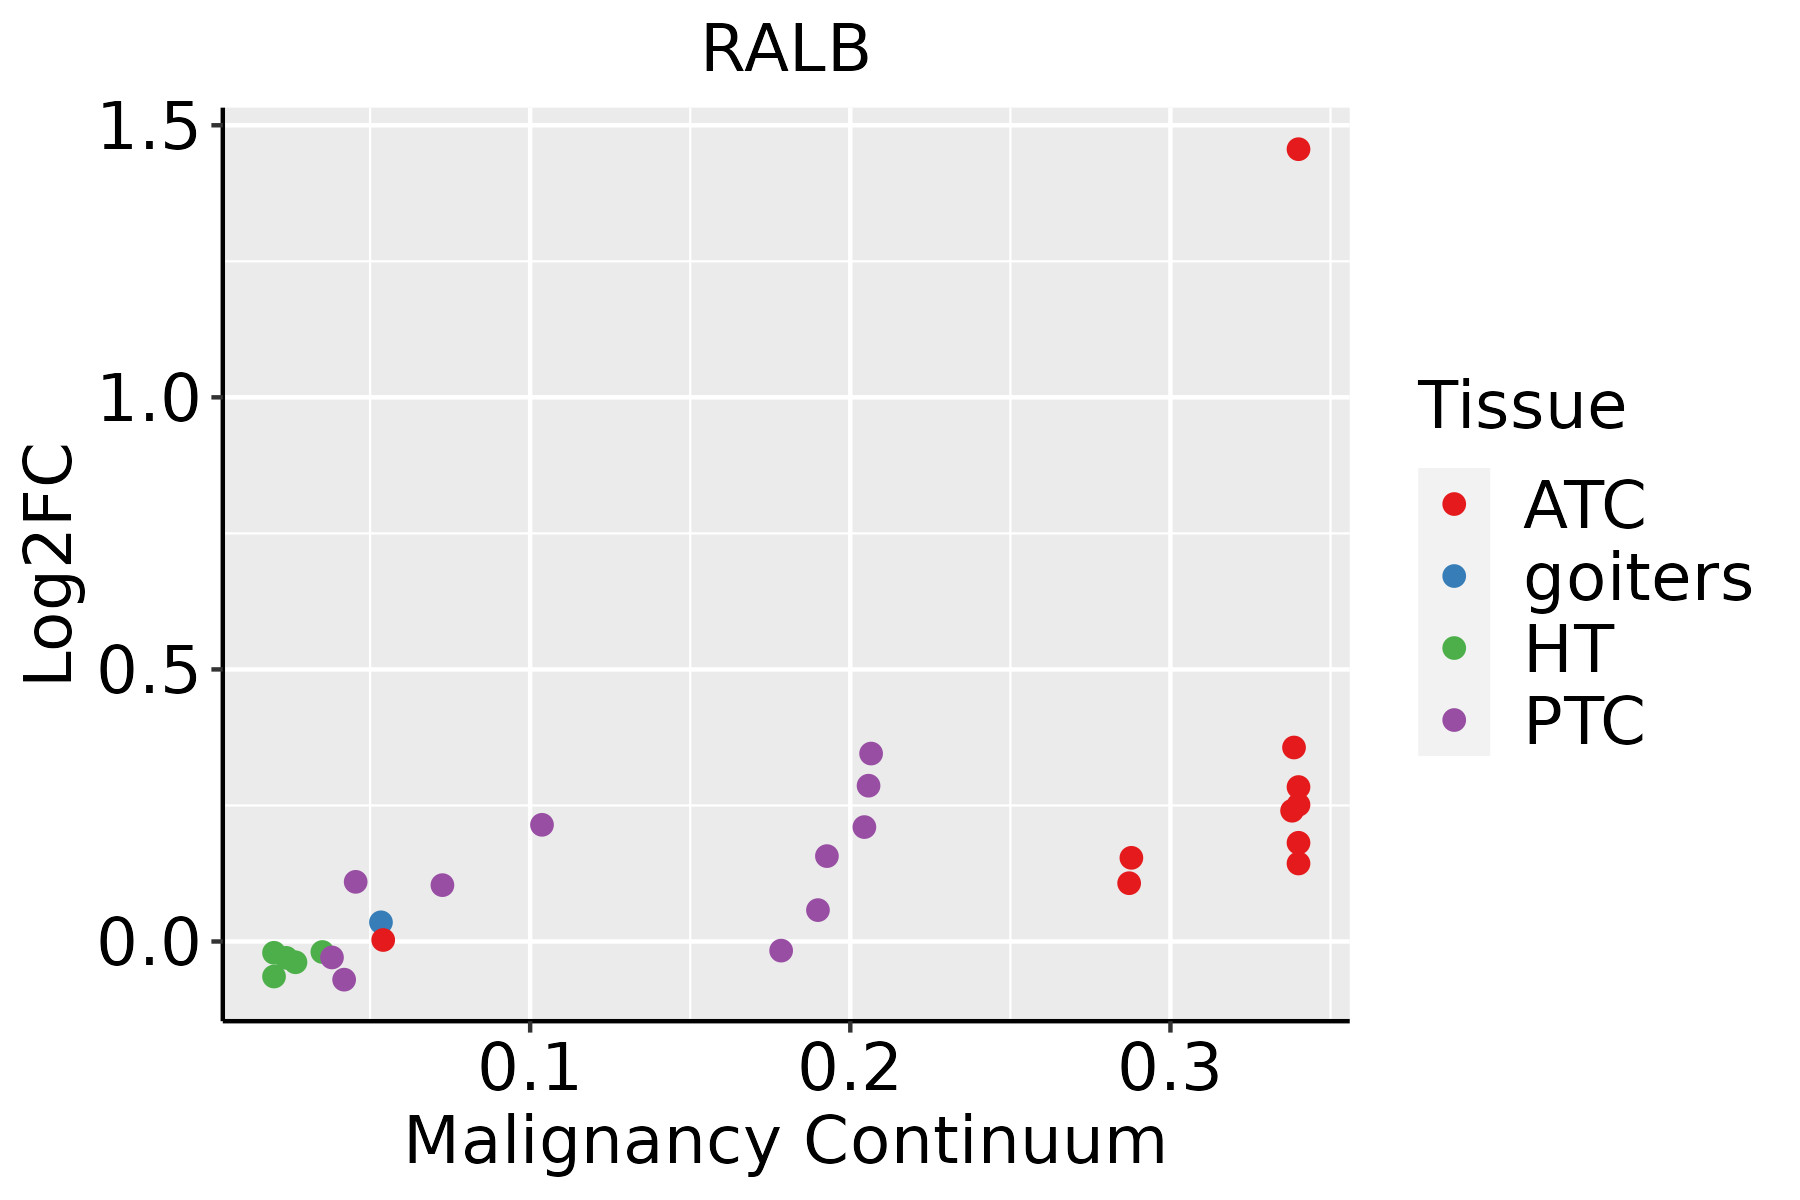 | ATC: Anaplastic thyroid cancer |
| HT: Hashimoto's thyroiditis | ||
| PTC: Papillary thyroid cancer |
| ∗log2FC in expression of this searched gene in stem-like cells from each diseased tissue sample relative to stem-like cells in normal samples in each tissue plotted against the malignancy continuum. Samples are colored based on if they are from different disease stage. |
Top |
Malignant transformation related pathway analysis |
| Find out the enriched GO biological processes and KEGG pathways involved in transition from healthy to precancer to cancer |
| Tissue | Disease Stage | Enriched GO biological Processes |
| Colorectum | AD |  |
| Colorectum | SER |  |
| Colorectum | MSS |  |
| Colorectum | MSI-H |  |
| Colorectum | FAP |  |
| ∗Top 15 enriched GO BP terms are showed in the bar plot of each disease state in each tissue. Each row represents a significant GO biological process which is colored according to the -log10(p.adjust). |
| Page: 1 2 3 4 5 6 7 8 9 |
| GO ID | Tissue | Disease Stage | Description | Gene Ratio | Bg Ratio | pvalue | p.adjust | Count |
| GO:004657814 | Prostate | Tumor | regulation of Ras protein signal transduction | 53/3246 | 189/18723 | 1.63e-04 | 1.46e-03 | 53 |
| GO:001082213 | Prostate | Tumor | positive regulation of mitochondrion organization | 25/3246 | 74/18723 | 4.62e-04 | 3.47e-03 | 25 |
| GO:009875417 | Prostate | Tumor | detoxification | 43/3246 | 152/18723 | 5.27e-04 | 3.85e-03 | 43 |
| GO:000726614 | Prostate | Tumor | Rho protein signal transduction | 39/3246 | 137/18723 | 8.18e-04 | 5.53e-03 | 39 |
| GO:004354713 | Prostate | Tumor | positive regulation of GTPase activity | 60/3246 | 255/18723 | 6.87e-03 | 3.11e-02 | 60 |
| GO:000726516 | Skin | AK | Ras protein signal transduction | 68/1910 | 337/18723 | 2.83e-08 | 1.57e-06 | 68 |
| GO:000726616 | Skin | AK | Rho protein signal transduction | 31/1910 | 137/18723 | 1.60e-05 | 3.09e-04 | 31 |
| GO:001082120 | Skin | AK | regulation of mitochondrion organization | 28/1910 | 144/18723 | 6.05e-04 | 5.32e-03 | 28 |
| GO:004308716 | Skin | AK | regulation of GTPase activity | 54/1910 | 348/18723 | 1.17e-03 | 8.98e-03 | 54 |
| GO:005105615 | Skin | AK | regulation of small GTPase mediated signal transduction | 48/1910 | 302/18723 | 1.28e-03 | 9.69e-03 | 48 |
| GO:004657810 | Skin | AK | regulation of Ras protein signal transduction | 33/1910 | 189/18723 | 1.49e-03 | 1.08e-02 | 33 |
| GO:000963626 | Skin | AK | response to toxic substance | 42/1910 | 262/18723 | 2.11e-03 | 1.40e-02 | 42 |
| GO:000989628 | Skin | cSCC | positive regulation of catabolic process | 206/4864 | 492/18723 | 6.06e-15 | 4.64e-13 | 206 |
| GO:001623619 | Skin | cSCC | macroautophagy | 136/4864 | 291/18723 | 1.36e-14 | 9.78e-13 | 136 |
| GO:003133128 | Skin | cSCC | positive regulation of cellular catabolic process | 182/4864 | 427/18723 | 3.29e-14 | 2.22e-12 | 182 |
| GO:00482854 | Skin | cSCC | organelle fission | 197/4864 | 488/18723 | 1.51e-12 | 8.36e-11 | 197 |
| GO:005109827 | Skin | cSCC | regulation of binding | 152/4864 | 363/18723 | 2.21e-11 | 1.10e-09 | 152 |
| GO:004325429 | Skin | cSCC | regulation of protein-containing complex assembly | 167/4864 | 428/18723 | 1.60e-09 | 5.97e-08 | 167 |
| GO:003150315 | Skin | cSCC | protein-containing complex localization | 95/4864 | 220/18723 | 2.00e-08 | 5.82e-07 | 95 |
| GO:001050619 | Skin | cSCC | regulation of autophagy | 127/4864 | 317/18723 | 2.36e-08 | 6.71e-07 | 127 |
| Page: 1 2 3 4 5 6 7 8 9 10 11 12 13 14 15 16 17 18 19 20 21 |
| Pathway ID | Tissue | Disease Stage | Description | Gene Ratio | Bg Ratio | pvalue | p.adjust | qvalue | Count |
| hsa0521020 | Esophagus | ESCC | Colorectal cancer | 69/4205 | 86/8465 | 4.06e-09 | 4.13e-08 | 2.11e-08 | 69 |
| hsa0521216 | Esophagus | ESCC | Pancreatic cancer | 62/4205 | 76/8465 | 7.37e-09 | 6.85e-08 | 3.51e-08 | 62 |
| hsa05210110 | Esophagus | ESCC | Colorectal cancer | 69/4205 | 86/8465 | 4.06e-09 | 4.13e-08 | 2.11e-08 | 69 |
| hsa0521217 | Esophagus | ESCC | Pancreatic cancer | 62/4205 | 76/8465 | 7.37e-09 | 6.85e-08 | 3.51e-08 | 62 |
| hsa052107 | Liver | Cirrhotic | Colorectal cancer | 39/2530 | 86/8465 | 1.67e-03 | 8.01e-03 | 4.94e-03 | 39 |
| hsa052126 | Liver | Cirrhotic | Pancreatic cancer | 34/2530 | 76/8465 | 4.20e-03 | 1.63e-02 | 1.00e-02 | 34 |
| hsa0521012 | Liver | Cirrhotic | Colorectal cancer | 39/2530 | 86/8465 | 1.67e-03 | 8.01e-03 | 4.94e-03 | 39 |
| hsa0521211 | Liver | Cirrhotic | Pancreatic cancer | 34/2530 | 76/8465 | 4.20e-03 | 1.63e-02 | 1.00e-02 | 34 |
| hsa0521022 | Liver | HCC | Colorectal cancer | 65/4020 | 86/8465 | 8.85e-08 | 1.23e-06 | 6.87e-07 | 65 |
| hsa0521221 | Liver | HCC | Pancreatic cancer | 54/4020 | 76/8465 | 2.50e-05 | 1.64e-04 | 9.12e-05 | 54 |
| hsa0521032 | Liver | HCC | Colorectal cancer | 65/4020 | 86/8465 | 8.85e-08 | 1.23e-06 | 6.87e-07 | 65 |
| hsa0521231 | Liver | HCC | Pancreatic cancer | 54/4020 | 76/8465 | 2.50e-05 | 1.64e-04 | 9.12e-05 | 54 |
| hsa0521210 | Oral cavity | OSCC | Pancreatic cancer | 60/3704 | 76/8465 | 3.32e-10 | 4.45e-09 | 2.26e-09 | 60 |
| hsa0521018 | Oral cavity | OSCC | Colorectal cancer | 66/3704 | 86/8465 | 3.99e-10 | 4.95e-09 | 2.52e-09 | 66 |
| hsa0401518 | Oral cavity | OSCC | Rap1 signaling pathway | 107/3704 | 210/8465 | 2.01e-02 | 4.34e-02 | 2.21e-02 | 107 |
| hsa0521215 | Oral cavity | OSCC | Pancreatic cancer | 60/3704 | 76/8465 | 3.32e-10 | 4.45e-09 | 2.26e-09 | 60 |
| hsa0521019 | Oral cavity | OSCC | Colorectal cancer | 66/3704 | 86/8465 | 3.99e-10 | 4.95e-09 | 2.52e-09 | 66 |
| hsa0401519 | Oral cavity | OSCC | Rap1 signaling pathway | 107/3704 | 210/8465 | 2.01e-02 | 4.34e-02 | 2.21e-02 | 107 |
| hsa0521223 | Oral cavity | LP | Pancreatic cancer | 40/2418 | 76/8465 | 8.08e-06 | 6.11e-05 | 3.94e-05 | 40 |
| hsa0521026 | Oral cavity | LP | Colorectal cancer | 41/2418 | 86/8465 | 1.25e-04 | 7.56e-04 | 4.87e-04 | 41 |
| Page: 1 2 |
Top |
Cell-cell communication analysis |
| Identification of potential cell-cell interactions between two cell types and their ligand-receptor pairs for different disease states |
| Ligand | Receptor | LRpair | Pathway | Tissue | Disease Stage |
| Page: 1 |
Top |
Single-cell gene regulatory network inference analysis |
| Find out the significant the regulons (TFs) and the target genes of each regulon across cell types for different disease states |
| TF | Cell Type | Tissue | Disease Stage | Target Gene | RSS | Regulon Activity |
| ∗The dot plots of a searched regulon are shown for all cell subpopulations in each disease state of each tissue based on the regulon specific score inferred using pySCENIC and by calculating the average expression. |
| Page: 1 |
Top |
Somatic mutation of malignant transformation related genes |
| Annotation of somatic variants for genes involved in malignant transformation |
| Hugo Symbol | Variant Class | Variant Classification | dbSNP RS | HGVSc | HGVSp | HGVSp Short | SWISSPROT | BIOTYPE | SIFT | PolyPhen | Tumor Sample Barcode | Tissue | Histology | Sex | Age | Stage | Therapy Types | Drugs | Outcome |
| RALB | SNV | Missense_Mutation | c.281N>T | p.Ser94Leu | p.S94L | P11234 | protein_coding | deleterious(0) | probably_damaging(0.993) | TCGA-AR-A24S-01 | Breast | breast invasive carcinoma | Female | <65 | I/II | Hormone Therapy | anastrozole | SD | |
| RALB | SNV | Missense_Mutation | c.68G>A | p.Gly23Glu | p.G23E | P11234 | protein_coding | deleterious(0.05) | possibly_damaging(0.767) | TCGA-AR-A2LE-01 | Breast | breast invasive carcinoma | Female | >=65 | I/II | Hormone Therapy | tamoxiphen | PD | |
| RALB | insertion | Nonsense_Mutation | novel | c.588_589insTATGGTTCACGCTAATGGATACAAAGACTTTGTGATTTTCTGTTTCC | p.Lys197TyrfsTer5 | p.K197Yfs*5 | P11234 | protein_coding | TCGA-A2-A04Y-01 | Breast | breast invasive carcinoma | Female | <65 | I/II | Chemotherapy | cytoxan | SD | ||
| RALB | insertion | Frame_Shift_Ins | novel | c.226_227insAA | p.Ala76GlufsTer40 | p.A76Efs*40 | P11234 | protein_coding | TCGA-AC-A3QQ-01 | Breast | breast invasive carcinoma | Female | <65 | I/II | Unknown | Unknown | SD | ||
| RALB | SNV | Missense_Mutation | rs139389446 | c.316N>A | p.Glu106Lys | p.E106K | P11234 | protein_coding | tolerated(0.27) | possibly_damaging(0.583) | TCGA-CA-6717-01 | Colorectum | colon adenocarcinoma | Male | <65 | I/II | Chemotherapy | oxaliplatin | CR |
| RALB | SNV | Missense_Mutation | c.70N>T | p.Gly24Cys | p.G24C | P11234 | protein_coding | deleterious(0) | probably_damaging(1) | TCGA-CM-6674-01 | Colorectum | colon adenocarcinoma | Male | <65 | I/II | Unknown | Unknown | SD | |
| RALB | SNV | Missense_Mutation | c.92C>T | p.Thr31Met | p.T31M | P11234 | protein_coding | deleterious(0.01) | probably_damaging(1) | TCGA-D5-6530-01 | Colorectum | colon adenocarcinoma | Male | <65 | I/II | Unknown | Unknown | SD | |
| RALB | SNV | Missense_Mutation | rs745653359 | c.332N>C | p.Ile111Thr | p.I111T | P11234 | protein_coding | deleterious(0) | probably_damaging(0.997) | TCGA-AG-A002-01 | Colorectum | rectum adenocarcinoma | Male | <65 | I/II | Unknown | Unknown | SD |
| RALB | SNV | Missense_Mutation | novel | c.588N>T | p.Lys196Asn | p.K196N | P11234 | protein_coding | tolerated(0.08) | benign(0.188) | TCGA-AG-A002-01 | Colorectum | rectum adenocarcinoma | Male | <65 | I/II | Unknown | Unknown | SD |
| RALB | SNV | Missense_Mutation | novel | c.523G>A | p.Glu175Lys | p.E175K | P11234 | protein_coding | deleterious(0.03) | benign(0.109) | TCGA-EI-6917-01 | Colorectum | rectum adenocarcinoma | Male | <65 | III/IV | Chemotherapy | 5fluorouracil+oxaciplatina+l-folinian | SD |
| Page: 1 2 3 4 |
Top |
Related drugs of malignant transformation related genes |
| Identification of chemicals and drugs interact with genes involved in malignant transfromation |
| (DGIdb 4.0) |
| Entrez ID | Symbol | Category | Interaction Types | Drug Claim Name | Drug Name | PMIDs |
| Page: 1 |

Copyright 2023-Present -The University of Texas Health Science Center at Houston |