
|
|||||
|
 | |
| |
| |
| |
| |
| |
|
Gene: PTPN1 |
Gene summary for PTPN1 |
| Gene information | Species | Human | Gene symbol | PTPN1 | Gene ID | 5770 |
| Gene name | protein tyrosine phosphatase non-receptor type 1 | |
| Gene Alias | PTP1B | |
| Cytomap | 20q13.13 | |
| Gene Type | protein-coding | GO ID | GO:0000165 | UniProtAcc | B4DSN5 |
Top |
Malignant transformation analysis |
| Identification of the aberrant gene expression in precancerous and cancerous lesions by comparing the gene expression of stem-like cells in diseased tissues with normal stem cells |
| Entrez ID | Symbol | Replicates | Species | Organ | Tissue | Adj P-value | Log2FC | Malignancy |
| 5770 | PTPN1 | LZE2T | Human | Esophagus | ESCC | 4.35e-02 | 1.84e-01 | 0.082 |
| 5770 | PTPN1 | LZE4T | Human | Esophagus | ESCC | 1.52e-18 | 8.84e-01 | 0.0811 |
| 5770 | PTPN1 | LZE7T | Human | Esophagus | ESCC | 3.34e-06 | 3.47e-01 | 0.0667 |
| 5770 | PTPN1 | LZE8T | Human | Esophagus | ESCC | 3.14e-11 | 3.28e-01 | 0.067 |
| 5770 | PTPN1 | LZE20T | Human | Esophagus | ESCC | 9.57e-05 | 2.33e-01 | 0.0662 |
| 5770 | PTPN1 | LZE24T | Human | Esophagus | ESCC | 6.04e-13 | 3.30e-01 | 0.0596 |
| 5770 | PTPN1 | LZE6T | Human | Esophagus | ESCC | 4.03e-09 | 1.23e-01 | 0.0845 |
| 5770 | PTPN1 | P1T-E | Human | Esophagus | ESCC | 2.84e-13 | 5.70e-01 | 0.0875 |
| 5770 | PTPN1 | P2T-E | Human | Esophagus | ESCC | 1.22e-46 | 9.35e-01 | 0.1177 |
| 5770 | PTPN1 | P4T-E | Human | Esophagus | ESCC | 6.90e-24 | 5.10e-01 | 0.1323 |
| 5770 | PTPN1 | P5T-E | Human | Esophagus | ESCC | 9.33e-19 | 4.11e-01 | 0.1327 |
| 5770 | PTPN1 | P8T-E | Human | Esophagus | ESCC | 4.73e-20 | 2.74e-01 | 0.0889 |
| 5770 | PTPN1 | P9T-E | Human | Esophagus | ESCC | 3.95e-12 | 1.42e-01 | 0.1131 |
| 5770 | PTPN1 | P10T-E | Human | Esophagus | ESCC | 2.96e-24 | 3.96e-01 | 0.116 |
| 5770 | PTPN1 | P11T-E | Human | Esophagus | ESCC | 3.20e-07 | 7.25e-01 | 0.1426 |
| 5770 | PTPN1 | P12T-E | Human | Esophagus | ESCC | 3.79e-38 | 8.06e-01 | 0.1122 |
| 5770 | PTPN1 | P15T-E | Human | Esophagus | ESCC | 6.67e-20 | 6.31e-01 | 0.1149 |
| 5770 | PTPN1 | P16T-E | Human | Esophagus | ESCC | 6.60e-34 | 7.10e-01 | 0.1153 |
| 5770 | PTPN1 | P17T-E | Human | Esophagus | ESCC | 1.22e-15 | 6.13e-01 | 0.1278 |
| 5770 | PTPN1 | P20T-E | Human | Esophagus | ESCC | 4.92e-20 | 5.70e-01 | 0.1124 |
| Page: 1 2 3 4 5 6 7 |
| Tissue | Expression Dynamics | Abbreviation |
| Esophagus |  | ESCC: Esophageal squamous cell carcinoma |
| HGIN: High-grade intraepithelial neoplasias | ||
| LGIN: Low-grade intraepithelial neoplasias | ||
| Liver | 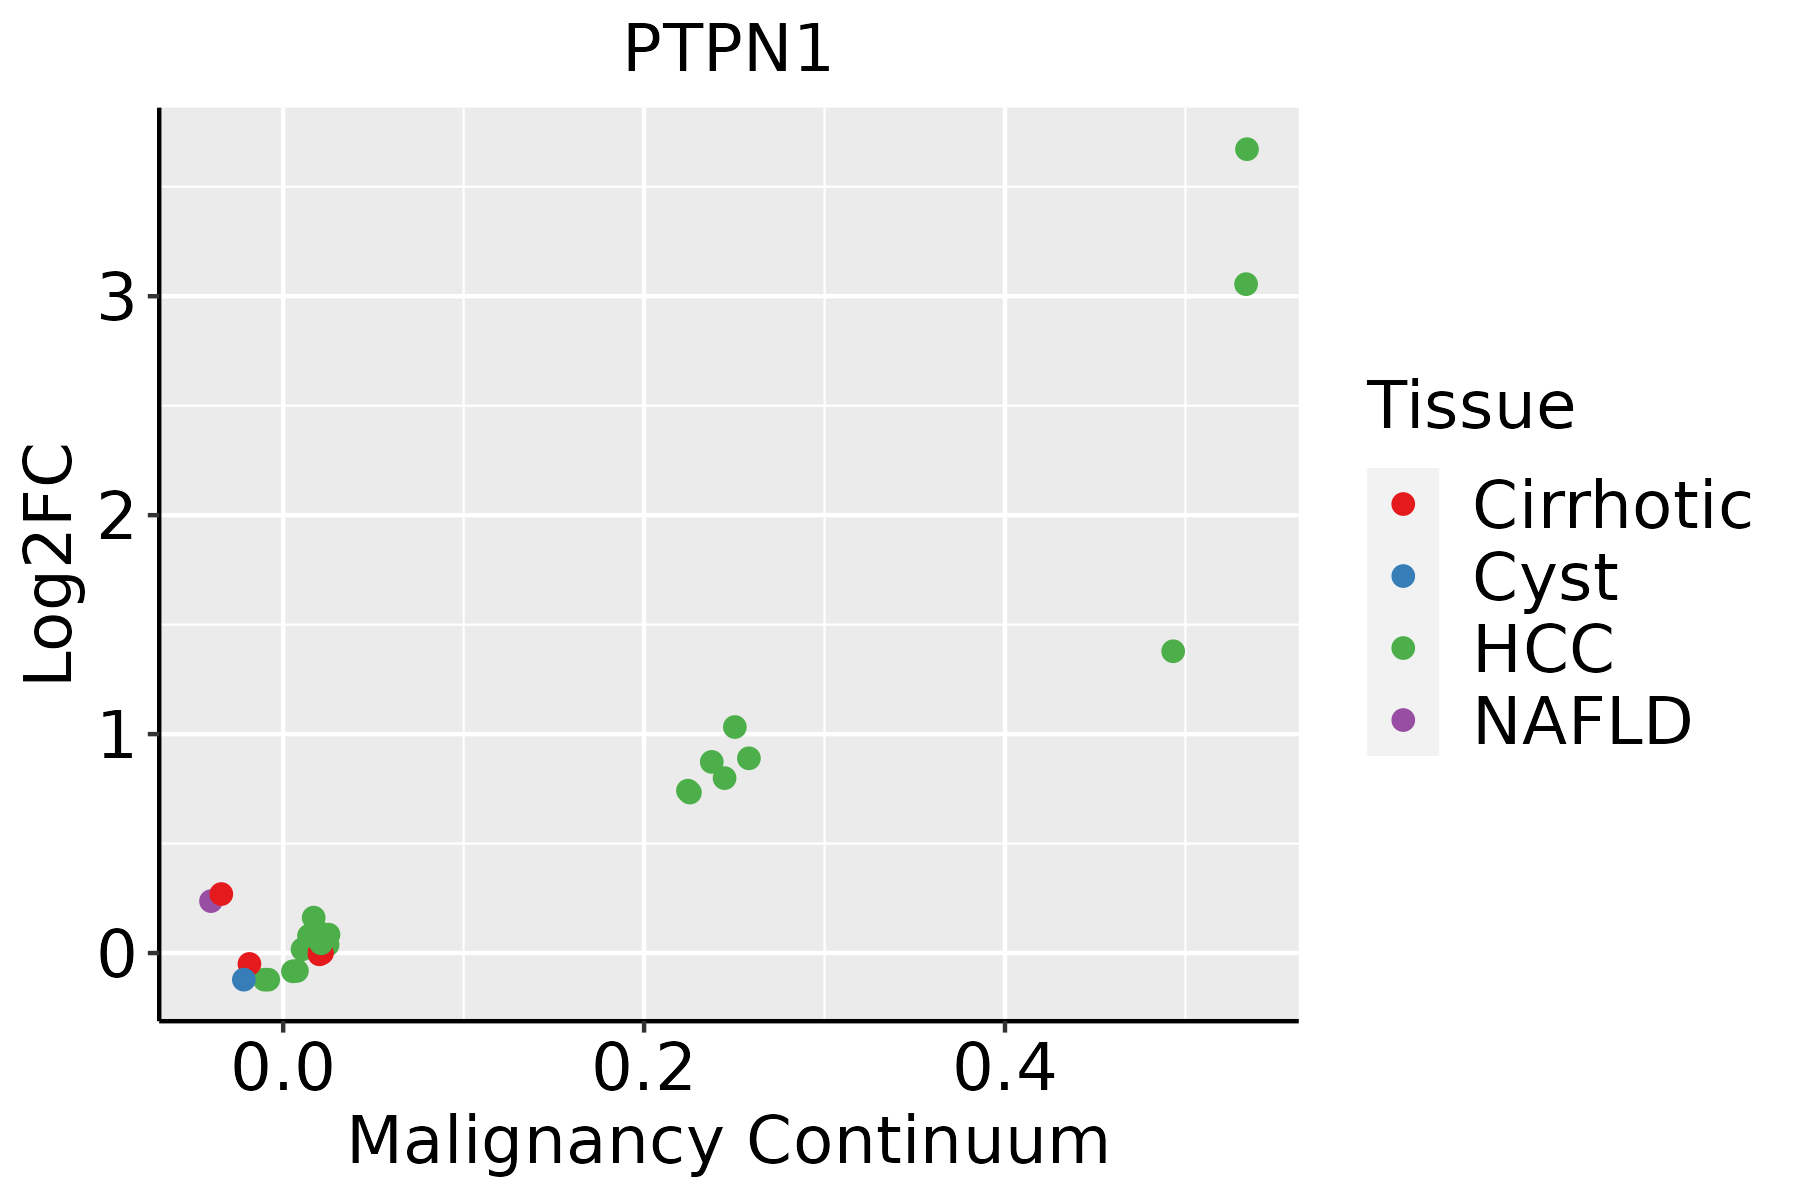 | HCC: Hepatocellular carcinoma |
| NAFLD: Non-alcoholic fatty liver disease | ||
| Lung | 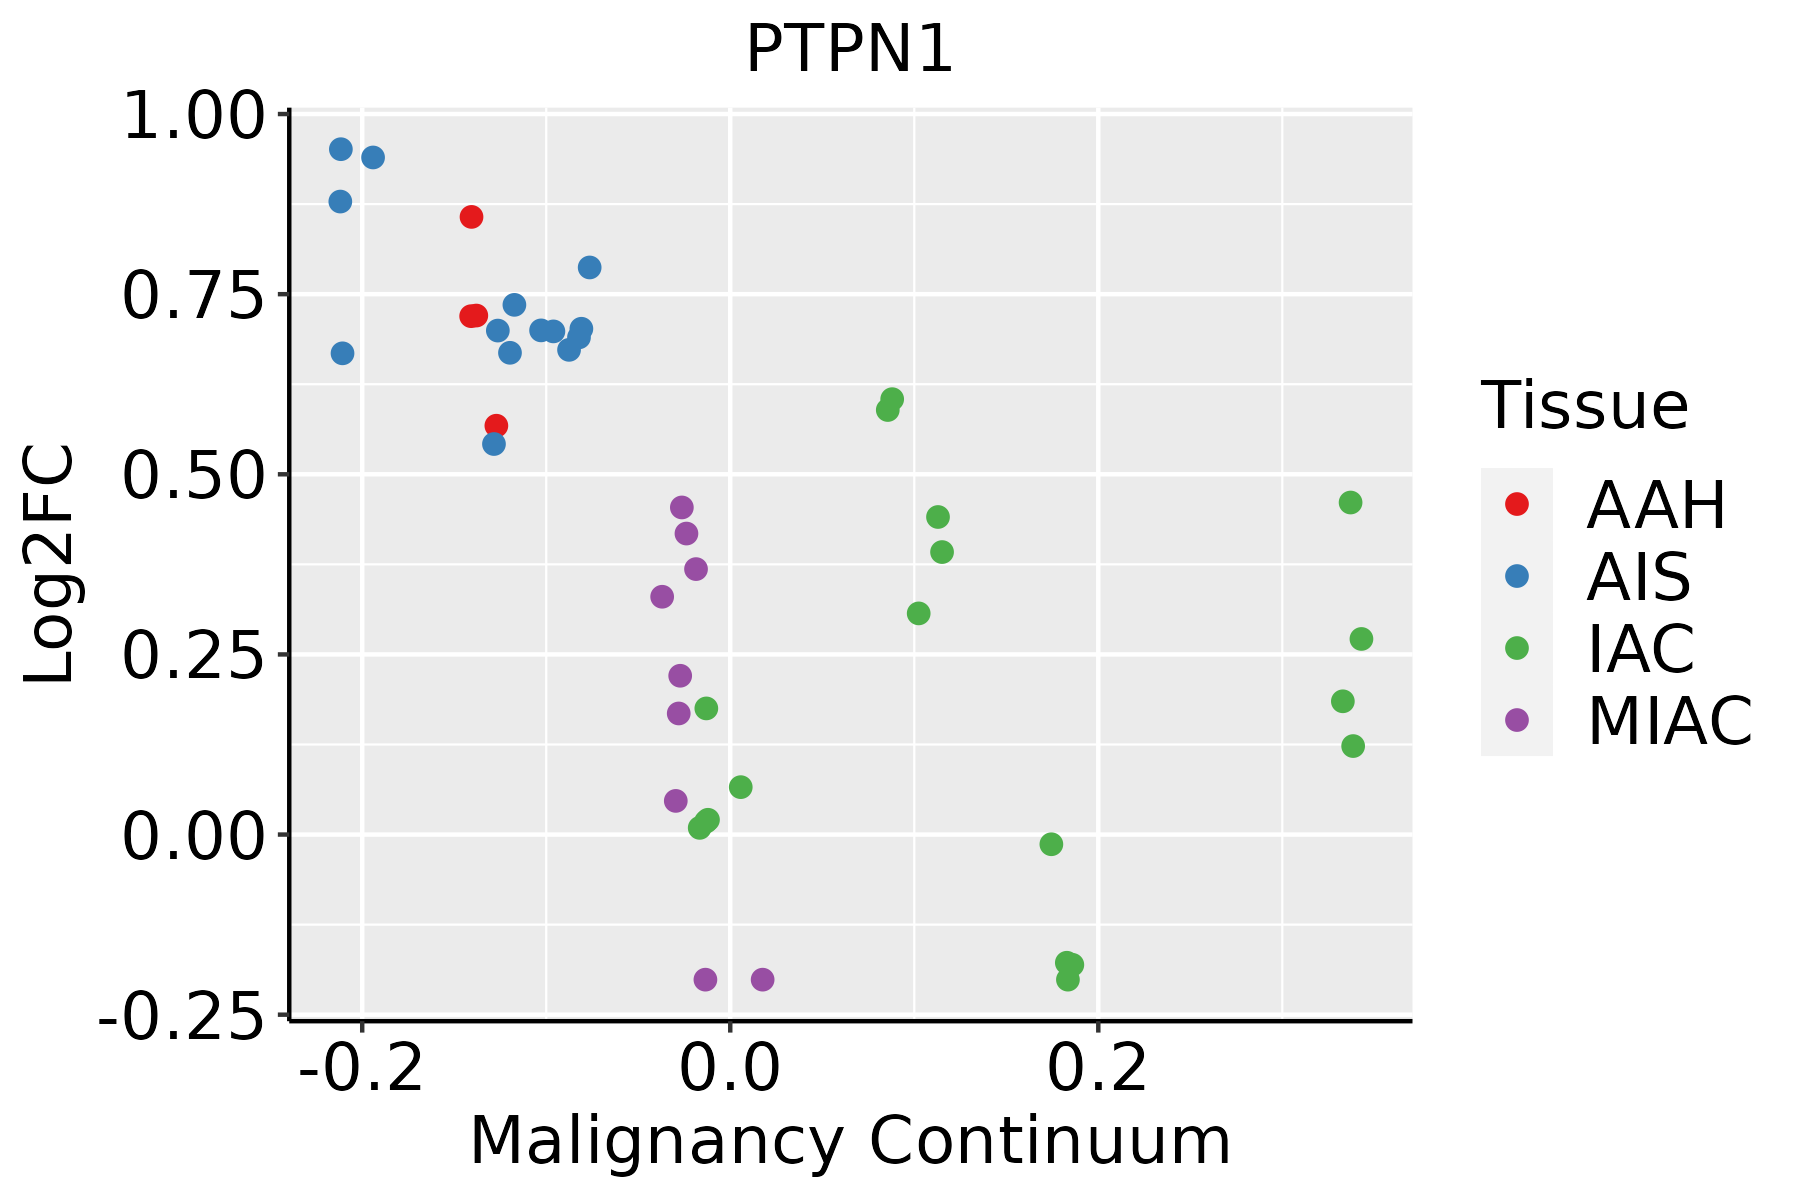 | AAH: Atypical adenomatous hyperplasia |
| AIS: Adenocarcinoma in situ | ||
| IAC: Invasive lung adenocarcinoma | ||
| MIA: Minimally invasive adenocarcinoma | ||
| Oral Cavity | 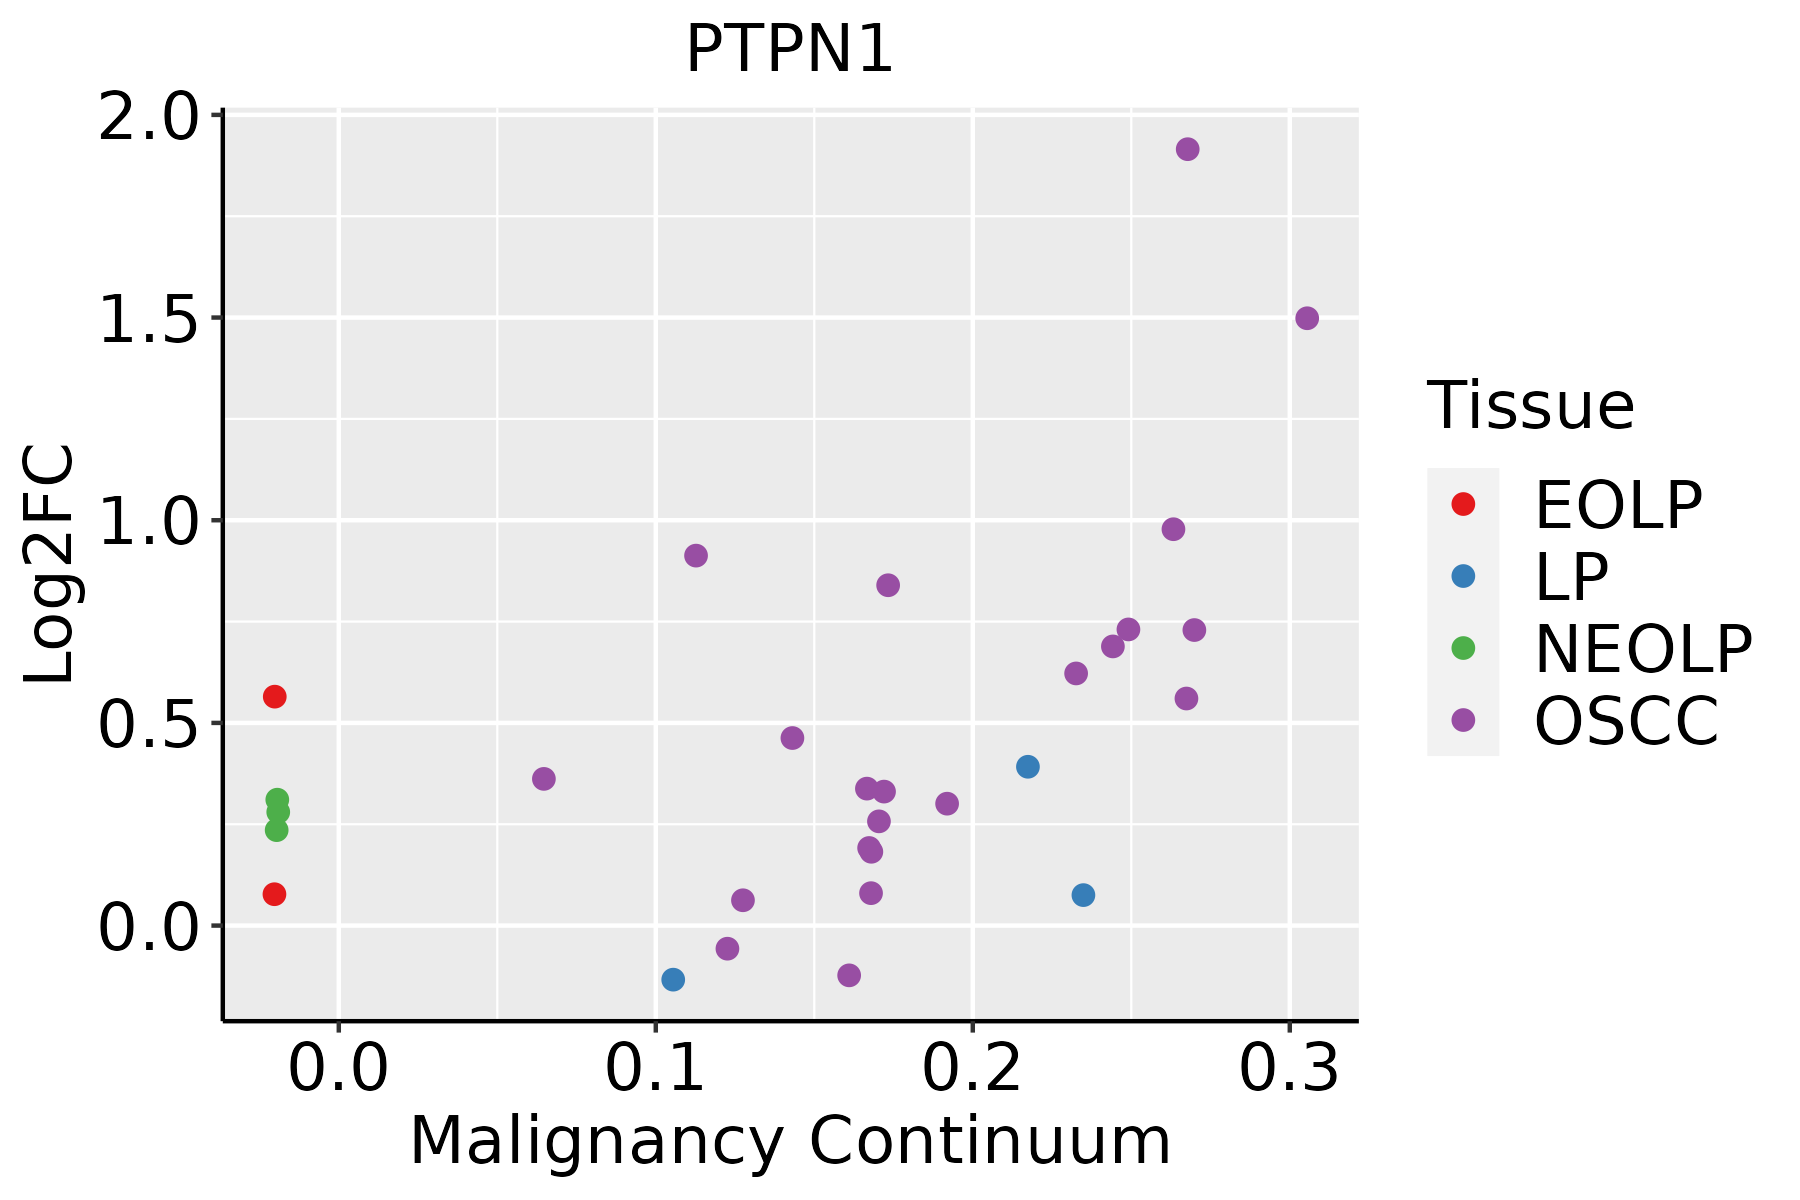 | EOLP: Erosive Oral lichen planus |
| LP: leukoplakia | ||
| NEOLP: Non-erosive oral lichen planus | ||
| OSCC: Oral squamous cell carcinoma | ||
| Prostate |  | BPH: Benign Prostatic Hyperplasia |
| Skin | 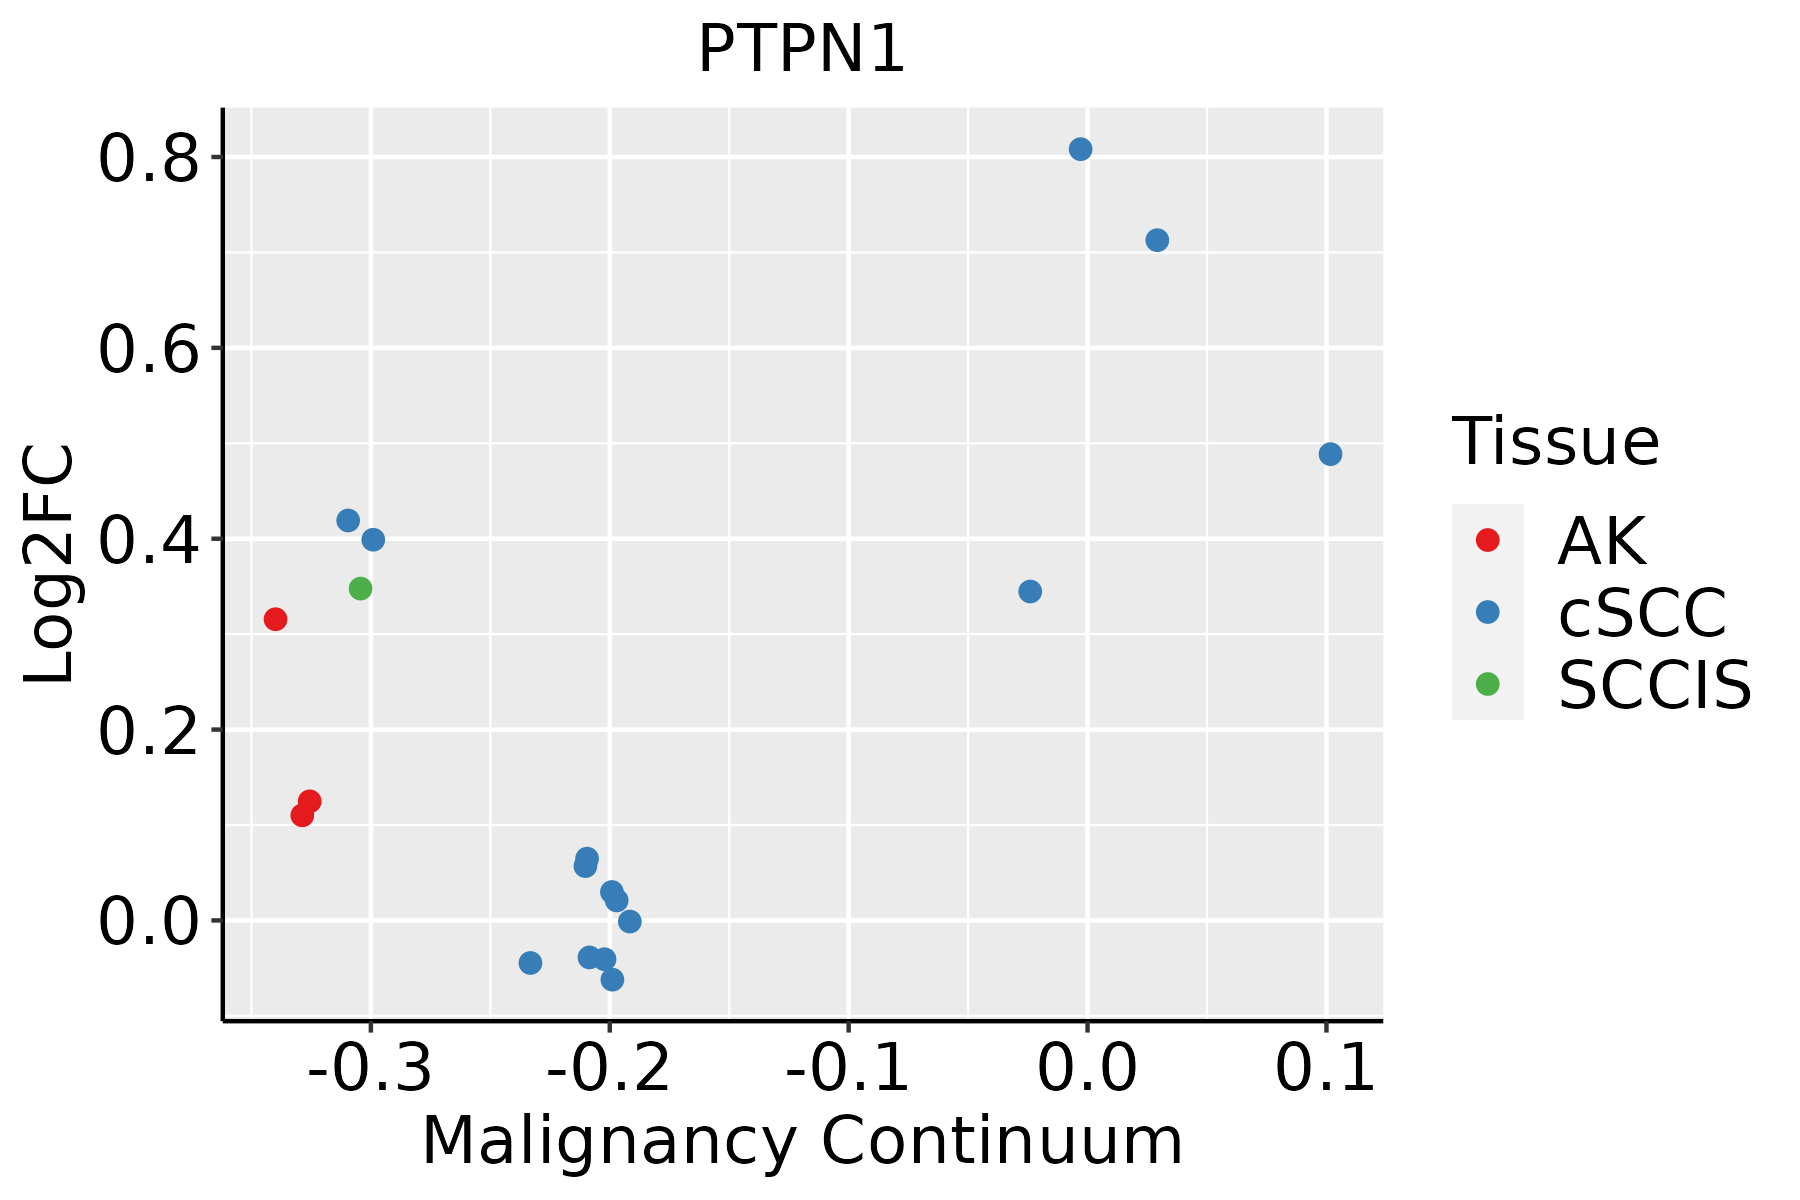 | AK: Actinic keratosis |
| cSCC: Cutaneous squamous cell carcinoma | ||
| SCCIS:squamous cell carcinoma in situ | ||
| Thyroid | 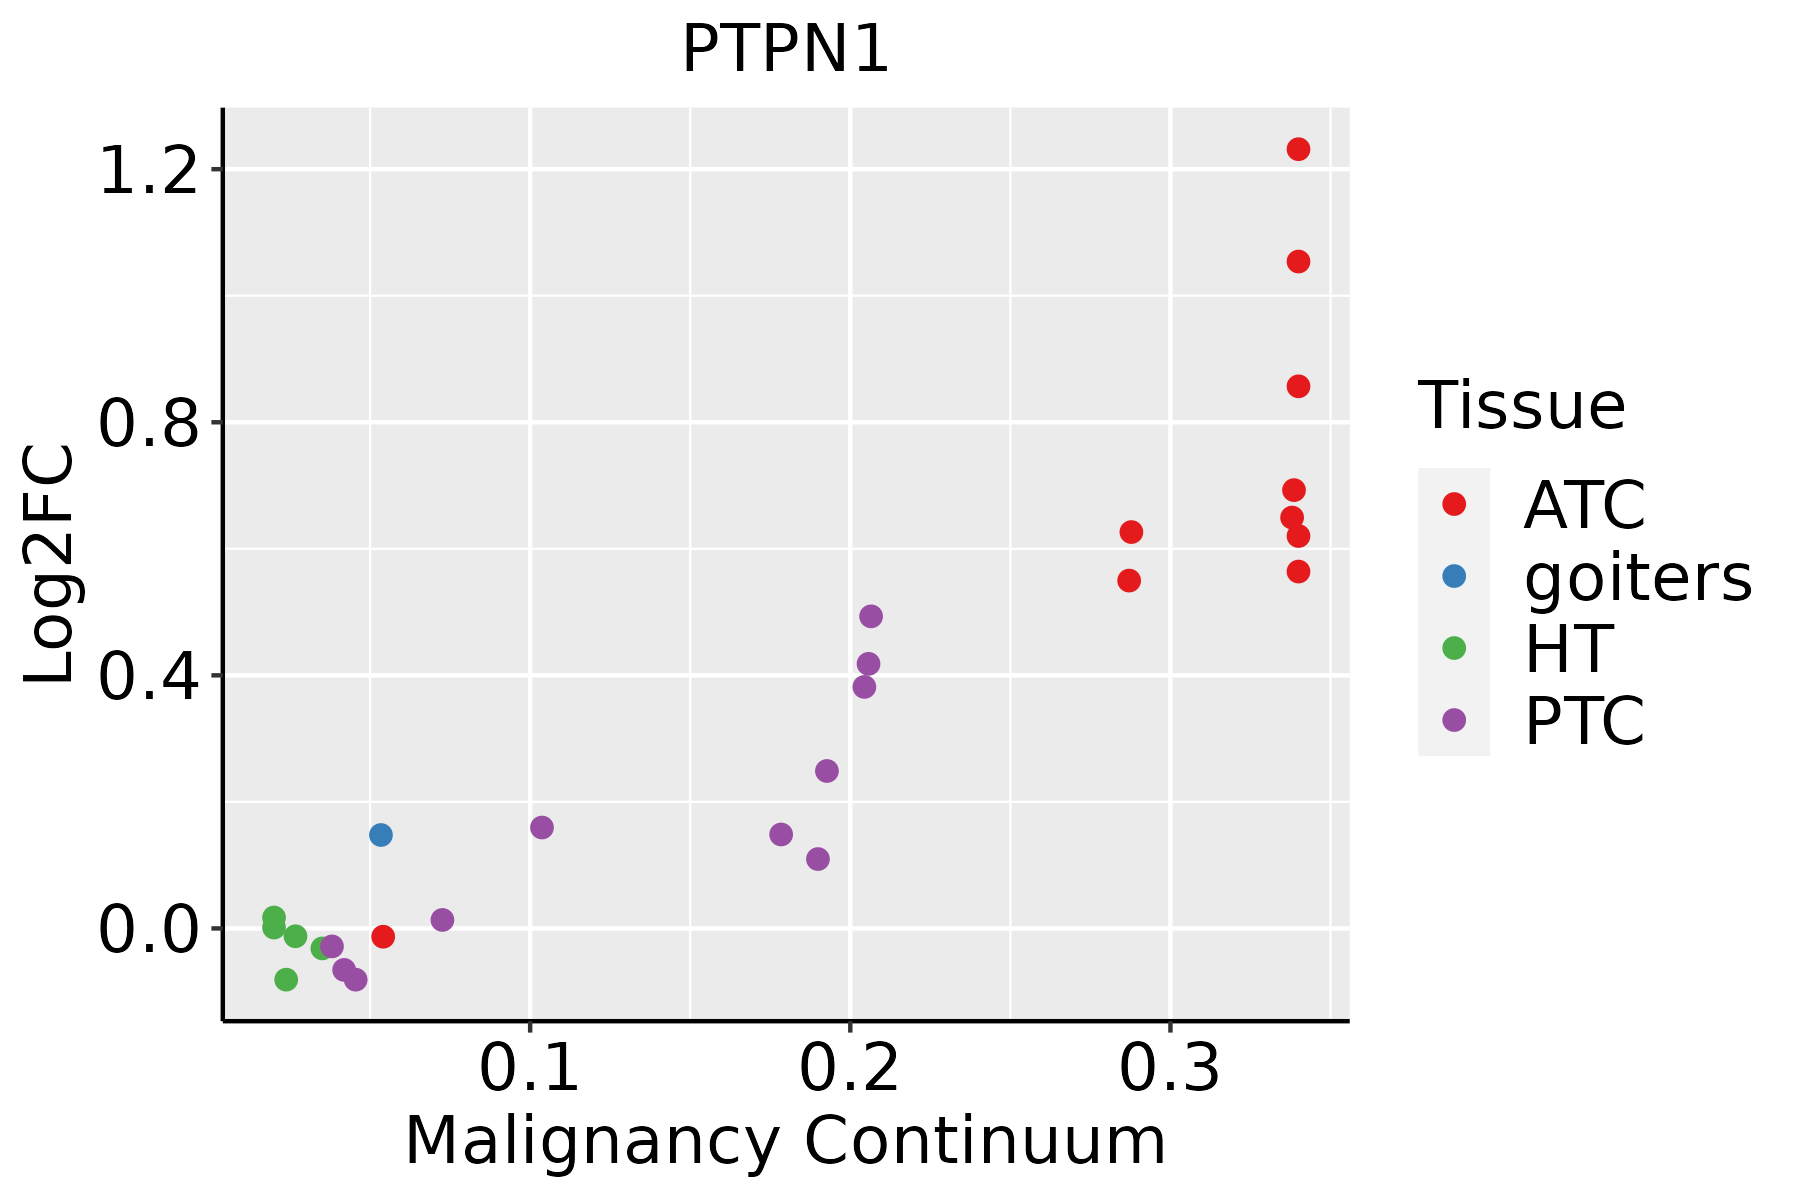 | ATC: Anaplastic thyroid cancer |
| HT: Hashimoto's thyroiditis | ||
| PTC: Papillary thyroid cancer |
| ∗log2FC in expression of this searched gene in stem-like cells from each diseased tissue sample relative to stem-like cells in normal samples in each tissue plotted against the malignancy continuum. Samples are colored based on if they are from different disease stage. |
Top |
Malignant transformation related pathway analysis |
| Find out the enriched GO biological processes and KEGG pathways involved in transition from healthy to precancer to cancer |
| Tissue | Disease Stage | Enriched GO biological Processes |
| Colorectum | AD |  |
| Colorectum | SER |  |
| Colorectum | MSS |  |
| Colorectum | MSI-H |  |
| Colorectum | FAP |  |
| ∗Top 15 enriched GO BP terms are showed in the bar plot of each disease state in each tissue. Each row represents a significant GO biological process which is colored according to the -log10(p.adjust). |
| Page: 1 2 3 4 5 6 7 8 9 |
| GO ID | Tissue | Disease Stage | Description | Gene Ratio | Bg Ratio | pvalue | p.adjust | Count |
| GO:190223516 | Esophagus | ESCC | regulation of endoplasmic reticulum stress-induced intrinsic apoptotic signaling pathway | 24/8552 | 32/18723 | 7.22e-04 | 3.77e-03 | 24 |
| GO:00434055 | Esophagus | ESCC | regulation of MAP kinase activity | 102/8552 | 177/18723 | 8.89e-04 | 4.55e-03 | 102 |
| GO:004211018 | Esophagus | ESCC | T cell activation | 256/8552 | 487/18723 | 1.18e-03 | 5.87e-03 | 256 |
| GO:003649913 | Esophagus | ESCC | PERK-mediated unfolded protein response | 15/8552 | 18/18723 | 1.20e-03 | 5.88e-03 | 15 |
| GO:00101711 | Esophagus | ESCC | body morphogenesis | 30/8552 | 43/18723 | 1.21e-03 | 5.88e-03 | 30 |
| GO:000166720 | Esophagus | ESCC | ameboidal-type cell migration | 250/8552 | 475/18723 | 1.22e-03 | 5.97e-03 | 250 |
| GO:00182124 | Esophagus | ESCC | peptidyl-tyrosine modification | 202/8552 | 378/18723 | 1.34e-03 | 6.39e-03 | 202 |
| GO:002240919 | Esophagus | ESCC | positive regulation of cell-cell adhesion | 155/8552 | 284/18723 | 1.50e-03 | 7.06e-03 | 155 |
| GO:00603253 | Esophagus | ESCC | face morphogenesis | 21/8552 | 28/18723 | 1.57e-03 | 7.33e-03 | 21 |
| GO:00181084 | Esophagus | ESCC | peptidyl-tyrosine phosphorylation | 200/8552 | 375/18723 | 1.60e-03 | 7.45e-03 | 200 |
| GO:00603485 | Esophagus | ESCC | bone development | 115/8552 | 205/18723 | 1.67e-03 | 7.72e-03 | 115 |
| GO:1902236111 | Esophagus | ESCC | negative regulation of endoplasmic reticulum stress-induced intrinsic apoptotic signaling pathway | 16/8552 | 20/18723 | 1.85e-03 | 8.40e-03 | 16 |
| GO:00507303 | Esophagus | ESCC | regulation of peptidyl-tyrosine phosphorylation | 144/8552 | 264/18723 | 2.22e-03 | 9.78e-03 | 144 |
| GO:00610972 | Esophagus | ESCC | regulation of protein tyrosine kinase activity | 55/8552 | 90/18723 | 2.27e-03 | 9.99e-03 | 55 |
| GO:000181916 | Esophagus | ESCC | positive regulation of cytokine production | 244/8552 | 467/18723 | 2.29e-03 | 1.01e-02 | 244 |
| GO:19038943 | Esophagus | ESCC | regulation of IRE1-mediated unfolded protein response | 12/8552 | 14/18723 | 2.51e-03 | 1.08e-02 | 12 |
| GO:20006444 | Esophagus | ESCC | regulation of receptor catabolic process | 10/8552 | 11/18723 | 2.54e-03 | 1.08e-02 | 10 |
| GO:00512244 | Esophagus | ESCC | negative regulation of protein transport | 74/8552 | 127/18723 | 2.86e-03 | 1.21e-02 | 74 |
| GO:19049505 | Esophagus | ESCC | negative regulation of establishment of protein localization | 76/8552 | 131/18723 | 2.96e-03 | 1.24e-02 | 76 |
| GO:00336275 | Esophagus | ESCC | cell adhesion mediated by integrin | 45/8552 | 72/18723 | 2.97e-03 | 1.24e-02 | 45 |
| Page: 1 2 3 4 5 6 7 8 9 10 11 12 13 14 15 16 17 18 19 20 21 22 23 24 25 26 27 28 29 30 31 32 33 34 35 36 37 38 39 40 41 42 43 44 45 46 47 48 49 50 51 52 53 54 55 56 57 58 59 60 61 62 63 64 65 66 67 68 69 70 71 72 73 74 75 76 77 78 79 80 81 82 83 84 85 86 87 88 89 90 91 92 93 94 95 96 97 98 99 100 101 102 103 104 105 106 107 |
| Pathway ID | Tissue | Disease Stage | Description | Gene Ratio | Bg Ratio | pvalue | p.adjust | qvalue | Count |
| hsa05208211 | Esophagus | ESCC | Chemical carcinogenesis - reactive oxygen species | 168/4205 | 223/8465 | 1.83e-15 | 6.81e-14 | 3.49e-14 | 168 |
| hsa0452030 | Esophagus | ESCC | Adherens junction | 69/4205 | 93/8465 | 1.08e-06 | 6.83e-06 | 3.50e-06 | 69 |
| hsa049109 | Esophagus | ESCC | Insulin signaling pathway | 89/4205 | 137/8465 | 1.97e-04 | 7.32e-04 | 3.75e-04 | 89 |
| hsa049318 | Esophagus | ESCC | Insulin resistance | 69/4205 | 108/8465 | 1.92e-03 | 5.54e-03 | 2.84e-03 | 69 |
| hsa05208310 | Esophagus | ESCC | Chemical carcinogenesis - reactive oxygen species | 168/4205 | 223/8465 | 1.83e-15 | 6.81e-14 | 3.49e-14 | 168 |
| hsa04520114 | Esophagus | ESCC | Adherens junction | 69/4205 | 93/8465 | 1.08e-06 | 6.83e-06 | 3.50e-06 | 69 |
| hsa0491014 | Esophagus | ESCC | Insulin signaling pathway | 89/4205 | 137/8465 | 1.97e-04 | 7.32e-04 | 3.75e-04 | 89 |
| hsa0493113 | Esophagus | ESCC | Insulin resistance | 69/4205 | 108/8465 | 1.92e-03 | 5.54e-03 | 2.84e-03 | 69 |
| hsa0520842 | Liver | HCC | Chemical carcinogenesis - reactive oxygen species | 167/4020 | 223/8465 | 2.85e-17 | 1.91e-15 | 1.06e-15 | 167 |
| hsa0491041 | Liver | HCC | Insulin signaling pathway | 95/4020 | 137/8465 | 1.53e-07 | 1.97e-06 | 1.10e-06 | 95 |
| hsa0493121 | Liver | HCC | Insulin resistance | 77/4020 | 108/8465 | 3.89e-07 | 4.46e-06 | 2.48e-06 | 77 |
| hsa0452042 | Liver | HCC | Adherens junction | 68/4020 | 93/8465 | 3.99e-07 | 4.46e-06 | 2.48e-06 | 68 |
| hsa0520852 | Liver | HCC | Chemical carcinogenesis - reactive oxygen species | 167/4020 | 223/8465 | 2.85e-17 | 1.91e-15 | 1.06e-15 | 167 |
| hsa0491051 | Liver | HCC | Insulin signaling pathway | 95/4020 | 137/8465 | 1.53e-07 | 1.97e-06 | 1.10e-06 | 95 |
| hsa0493131 | Liver | HCC | Insulin resistance | 77/4020 | 108/8465 | 3.89e-07 | 4.46e-06 | 2.48e-06 | 77 |
| hsa0452052 | Liver | HCC | Adherens junction | 68/4020 | 93/8465 | 3.99e-07 | 4.46e-06 | 2.48e-06 | 68 |
| hsa0452016 | Lung | IAC | Adherens junction | 37/1053 | 93/8465 | 1.99e-11 | 2.16e-09 | 1.43e-09 | 37 |
| hsa0520816 | Lung | IAC | Chemical carcinogenesis - reactive oxygen species | 51/1053 | 223/8465 | 8.45e-06 | 2.14e-04 | 1.42e-04 | 51 |
| hsa0452017 | Lung | IAC | Adherens junction | 37/1053 | 93/8465 | 1.99e-11 | 2.16e-09 | 1.43e-09 | 37 |
| hsa0520817 | Lung | IAC | Chemical carcinogenesis - reactive oxygen species | 51/1053 | 223/8465 | 8.45e-06 | 2.14e-04 | 1.42e-04 | 51 |
| Page: 1 2 3 |
Top |
Cell-cell communication analysis |
| Identification of potential cell-cell interactions between two cell types and their ligand-receptor pairs for different disease states |
| Ligand | Receptor | LRpair | Pathway | Tissue | Disease Stage |
| Page: 1 |
Top |
Single-cell gene regulatory network inference analysis |
| Find out the significant the regulons (TFs) and the target genes of each regulon across cell types for different disease states |
| TF | Cell Type | Tissue | Disease Stage | Target Gene | RSS | Regulon Activity |
| ∗The dot plots of a searched regulon are shown for all cell subpopulations in each disease state of each tissue based on the regulon specific score inferred using pySCENIC and by calculating the average expression. |
| Page: 1 |
Top |
Somatic mutation of malignant transformation related genes |
| Annotation of somatic variants for genes involved in malignant transformation |
| Hugo Symbol | Variant Class | Variant Classification | dbSNP RS | HGVSc | HGVSp | HGVSp Short | SWISSPROT | BIOTYPE | SIFT | PolyPhen | Tumor Sample Barcode | Tissue | Histology | Sex | Age | Stage | Therapy Types | Drugs | Outcome |
| PTPN1 | SNV | Missense_Mutation | novel | c.255N>T | p.Gln85His | p.Q85H | P18031 | protein_coding | deleterious(0) | probably_damaging(1) | TCGA-A2-A25A-01 | Breast | breast invasive carcinoma | Female | <65 | I/II | Unspecific | Cytoxan | SD |
| PTPN1 | SNV | Missense_Mutation | novel | c.1192N>T | p.Asp398Tyr | p.D398Y | P18031 | protein_coding | deleterious(0.02) | benign(0.071) | TCGA-A7-A6VX-01 | Breast | breast invasive carcinoma | Female | >=65 | I/II | Chemotherapy | docetaxel | CR |
| PTPN1 | SNV | Missense_Mutation | novel | c.1058N>G | p.Pro353Arg | p.P353R | P18031 | protein_coding | tolerated(0.62) | benign(0.024) | TCGA-AN-A0FN-01 | Breast | breast invasive carcinoma | Female | <65 | I/II | Unknown | Unknown | SD |
| PTPN1 | insertion | Nonsense_Mutation | novel | c.836_837insGGCTTTTGGCATCTTTATGGAAACAAAATCCTGAAAGTGGTTT | p.Phe280AlafsTer11 | p.F280Afs*11 | P18031 | protein_coding | TCGA-A8-A09X-01 | Breast | breast invasive carcinoma | Female | <65 | III/IV | Unknown | Unknown | SD | ||
| PTPN1 | insertion | Nonsense_Mutation | novel | c.1060_1061insGTTAGAAATGAGGAAGTTTCGGATGGGGC | p.Leu354CysfsTer2 | p.L354Cfs*2 | P18031 | protein_coding | TCGA-AN-A0FN-01 | Breast | breast invasive carcinoma | Female | <65 | I/II | Unknown | Unknown | SD | ||
| PTPN1 | deletion | Frame_Shift_Del | c.1125delN | p.Gly377GlufsTer27 | p.G377Efs*27 | P18031 | protein_coding | TCGA-EW-A2FV-01 | Breast | breast invasive carcinoma | Female | <65 | III/IV | Chemotherapy | docetaxel | SD | |||
| PTPN1 | SNV | Missense_Mutation | rs138343840 | c.1123G>A | p.Val375Met | p.V375M | P18031 | protein_coding | tolerated(0.08) | benign(0.031) | TCGA-A6-2672-01 | Colorectum | colon adenocarcinoma | Female | >=65 | III/IV | Unknown | Unknown | SD |
| PTPN1 | SNV | Missense_Mutation | novel | c.845N>C | p.Met282Thr | p.M282T | P18031 | protein_coding | deleterious(0.05) | benign(0.041) | TCGA-AA-3663-01 | Colorectum | colon adenocarcinoma | Male | <65 | I/II | Unknown | Unknown | SD |
| PTPN1 | SNV | Missense_Mutation | c.136T>C | p.Tyr46His | p.Y46H | P18031 | protein_coding | deleterious(0.02) | probably_damaging(0.989) | TCGA-AA-3713-01 | Colorectum | colon adenocarcinoma | Male | >=65 | III/IV | Chemotherapy | 5-fluorouracil | PR | |
| PTPN1 | SNV | Missense_Mutation | novel | c.1027G>A | p.Asp343Asn | p.D343N | P18031 | protein_coding | tolerated(0.44) | benign(0.014) | TCGA-AA-3984-01 | Colorectum | colon adenocarcinoma | Female | <65 | I/II | Unknown | Unknown | SD |
| Page: 1 2 3 4 5 |
Top |
Related drugs of malignant transformation related genes |
| Identification of chemicals and drugs interact with genes involved in malignant transfromation |
| (DGIdb 4.0) |
| Entrez ID | Symbol | Category | Interaction Types | Drug Claim Name | Drug Name | PMIDs |
| 5770 | PTPN1 | DRUGGABLE GENOME, PROTEIN PHOSPHATASE, ENZYME, KINASE | inhibitor | 252827507 | ||
| 5770 | PTPN1 | DRUGGABLE GENOME, PROTEIN PHOSPHATASE, ENZYME, KINASE | OLEANOLIC_ACID | OLEANOLIC_ACID | 21453996 | |
| 5770 | PTPN1 | DRUGGABLE GENOME, PROTEIN PHOSPHATASE, ENZYME, KINASE | inhibitor | 384403654 | ||
| 5770 | PTPN1 | DRUGGABLE GENOME, PROTEIN PHOSPHATASE, ENZYME, KINASE | ALLYL ISOTHIOCYANATE | ALLYL ISOTHIOCYANATE | 26338358 | |
| 5770 | PTPN1 | DRUGGABLE GENOME, PROTEIN PHOSPHATASE, ENZYME, KINASE | LICOAGRODIN | LICOAGRODIN | 24047800 | |
| 5770 | PTPN1 | DRUGGABLE GENOME, PROTEIN PHOSPHATASE, ENZYME, KINASE | REL-HUEAFURANOID A | CHEMBL2207339 | 23141910 | |
| 5770 | PTPN1 | DRUGGABLE GENOME, PROTEIN PHOSPHATASE, ENZYME, KINASE | ISIS 113715 | |||
| 5770 | PTPN1 | DRUGGABLE GENOME, PROTEIN PHOSPHATASE, ENZYME, KINASE | TILUDRONATE | TILUDRONIC ACID | ||
| 5770 | PTPN1 | DRUGGABLE GENOME, PROTEIN PHOSPHATASE, ENZYME, KINASE | GLISOFLAVONE | GLISOFLAVONE | 20724155 | |
| 5770 | PTPN1 | DRUGGABLE GENOME, PROTEIN PHOSPHATASE, ENZYME, KINASE | INSULIN | INSULIN | 8826975 |
| Page: 1 2 3 4 |

Copyright 2023-Present -The University of Texas Health Science Center at Houston |