
|
|||||
|
 | |
| |
| |
| |
| |
| |
|
Gene: OGA |
Gene summary for OGA |
| Gene information | Species | Human | Gene symbol | OGA | Gene ID | 10724 |
| Gene name | O-GlcNAcase | |
| Gene Alias | MEA5 | |
| Cytomap | 10q24.32 | |
| Gene Type | protein-coding | GO ID | GO:0006040 | UniProtAcc | O60502 |
Top |
Malignant transformation analysis |
| Identification of the aberrant gene expression in precancerous and cancerous lesions by comparing the gene expression of stem-like cells in diseased tissues with normal stem cells |
| Entrez ID | Symbol | Replicates | Species | Organ | Tissue | Adj P-value | Log2FC | Malignancy |
| 10724 | OGA | GSM4909281 | Human | Breast | IDC | 1.18e-03 | 2.42e-01 | 0.21 |
| 10724 | OGA | GSM4909286 | Human | Breast | IDC | 2.48e-03 | 1.34e-01 | 0.1081 |
| 10724 | OGA | GSM4909293 | Human | Breast | IDC | 2.12e-12 | 2.82e-01 | 0.1581 |
| 10724 | OGA | GSM4909295 | Human | Breast | IDC | 2.36e-03 | 3.10e-01 | 0.0898 |
| 10724 | OGA | GSM4909298 | Human | Breast | IDC | 8.00e-11 | 3.39e-01 | 0.1551 |
| 10724 | OGA | GSM4909299 | Human | Breast | IDC | 2.37e-03 | 1.87e-01 | 0.035 |
| 10724 | OGA | GSM4909301 | Human | Breast | IDC | 4.79e-05 | 3.81e-01 | 0.1577 |
| 10724 | OGA | GSM4909302 | Human | Breast | IDC | 4.74e-02 | 2.44e-01 | 0.1545 |
| 10724 | OGA | GSM4909304 | Human | Breast | IDC | 2.67e-04 | 2.22e-01 | 0.1636 |
| 10724 | OGA | GSM4909305 | Human | Breast | IDC | 2.87e-05 | 2.75e-01 | 0.0436 |
| 10724 | OGA | GSM4909308 | Human | Breast | IDC | 6.78e-08 | 2.35e-01 | 0.158 |
| 10724 | OGA | GSM4909311 | Human | Breast | IDC | 9.30e-05 | -8.74e-02 | 0.1534 |
| 10724 | OGA | GSM4909317 | Human | Breast | IDC | 4.48e-05 | 2.17e-01 | 0.1355 |
| 10724 | OGA | GSM4909319 | Human | Breast | IDC | 2.72e-08 | -1.49e-01 | 0.1563 |
| 10724 | OGA | ctrl6 | Human | Breast | Precancer | 7.17e-17 | 5.94e-01 | -0.0061 |
| 10724 | OGA | brca1 | Human | Breast | Precancer | 8.07e-06 | -2.10e-01 | -0.0338 |
| 10724 | OGA | brca2 | Human | Breast | Precancer | 8.25e-07 | -2.10e-01 | -0.024 |
| 10724 | OGA | brca3 | Human | Breast | Precancer | 8.25e-07 | -2.10e-01 | -0.0263 |
| 10724 | OGA | M1 | Human | Breast | IDC | 1.93e-18 | 5.52e-01 | 0.1577 |
| 10724 | OGA | P1 | Human | Breast | IDC | 5.18e-06 | 3.21e-01 | 0.1527 |
| Page: 1 2 3 4 5 6 7 8 |
| Tissue | Expression Dynamics | Abbreviation |
| Breast |  | IDC: Invasive ductal carcinoma |
| DCIS: Ductal carcinoma in situ | ||
| Precancer(BRCA1-mut): Precancerous lesion from BRCA1 mutation carriers | ||
| Cervix | 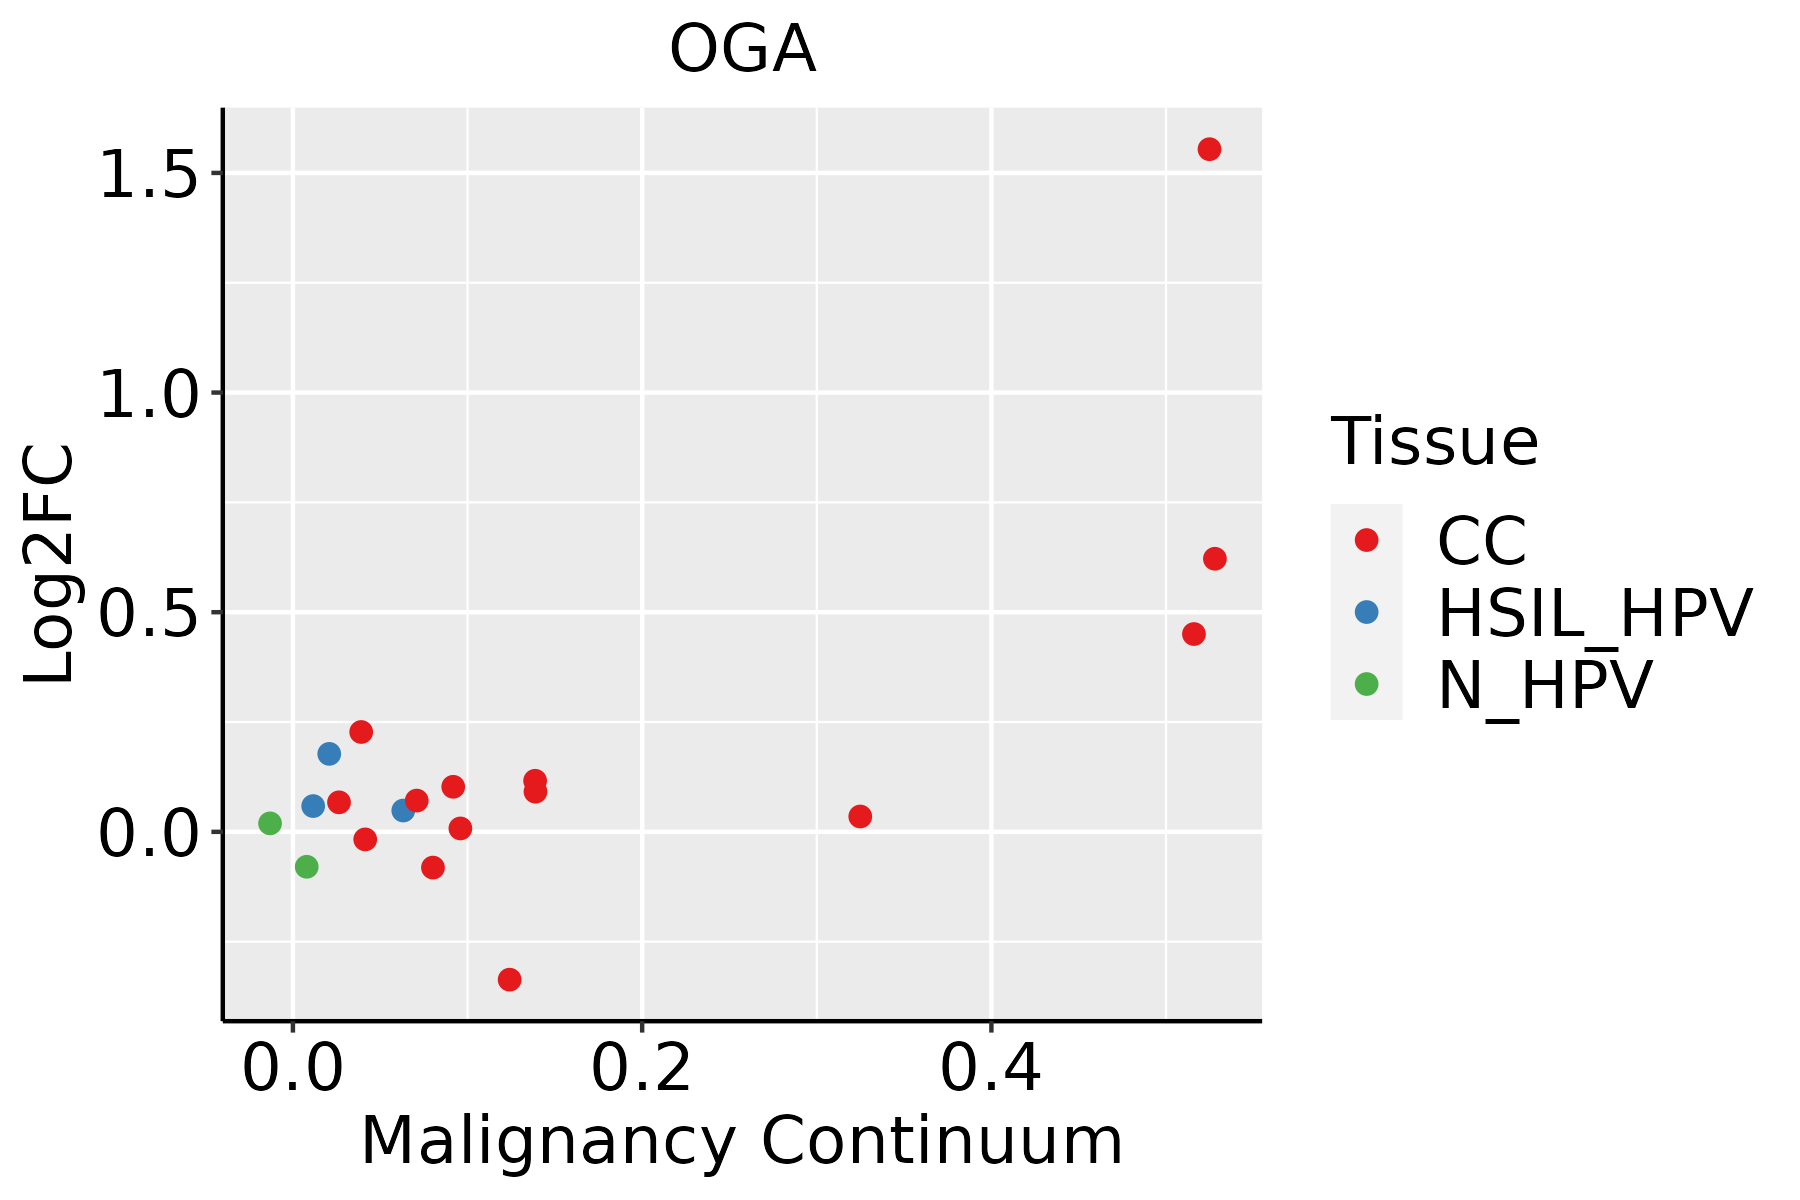 | CC: Cervix cancer |
| HSIL_HPV: HPV-infected high-grade squamous intraepithelial lesions | ||
| N_HPV: HPV-infected normal cervix | ||
| Colorectum (GSE201348) |  | FAP: Familial adenomatous polyposis |
| CRC: Colorectal cancer | ||
| Colorectum (HTA11) |  | AD: Adenomas |
| SER: Sessile serrated lesions | ||
| MSI-H: Microsatellite-high colorectal cancer | ||
| MSS: Microsatellite stable colorectal cancer | ||
| Endometrium | 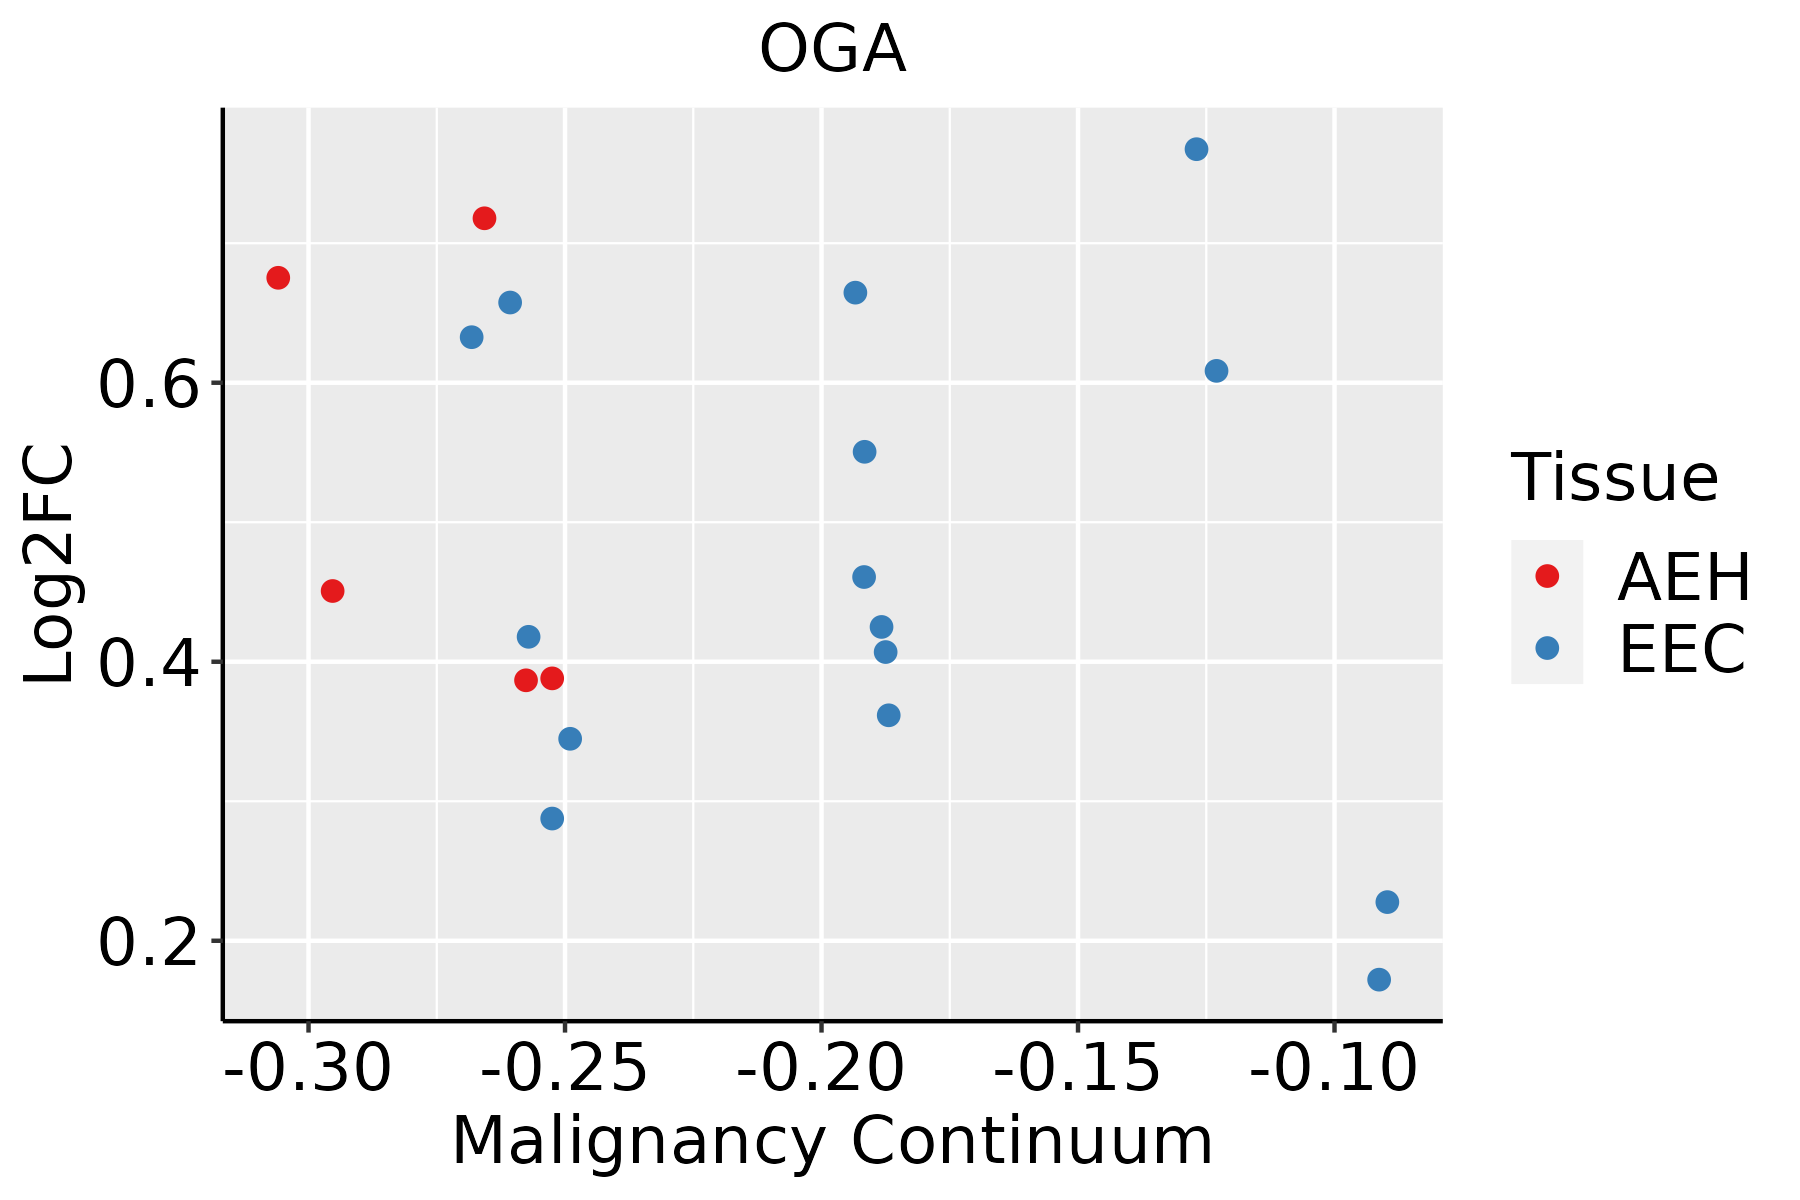 | AEH: Atypical endometrial hyperplasia |
| EEC: Endometrioid Cancer | ||
| Esophagus | 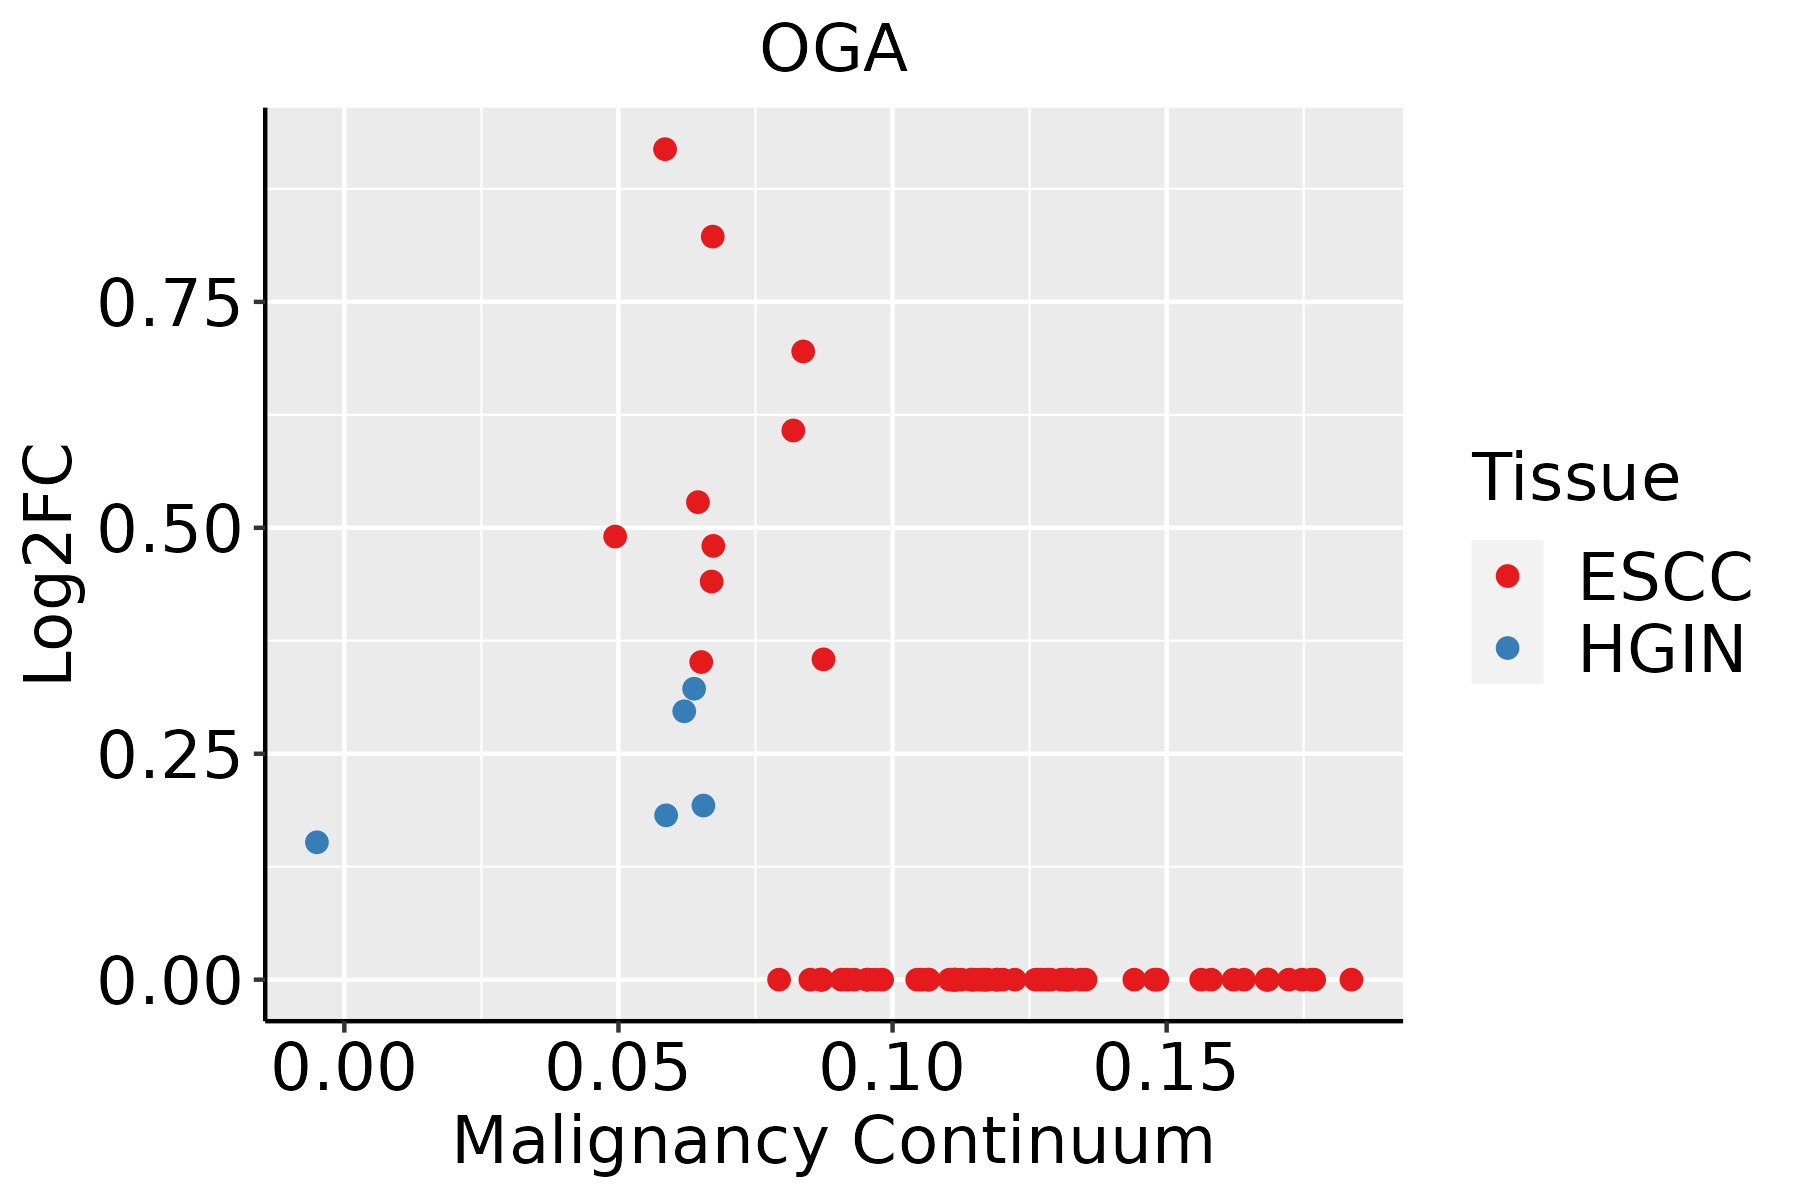 | ESCC: Esophageal squamous cell carcinoma |
| HGIN: High-grade intraepithelial neoplasias | ||
| LGIN: Low-grade intraepithelial neoplasias | ||
| Liver | 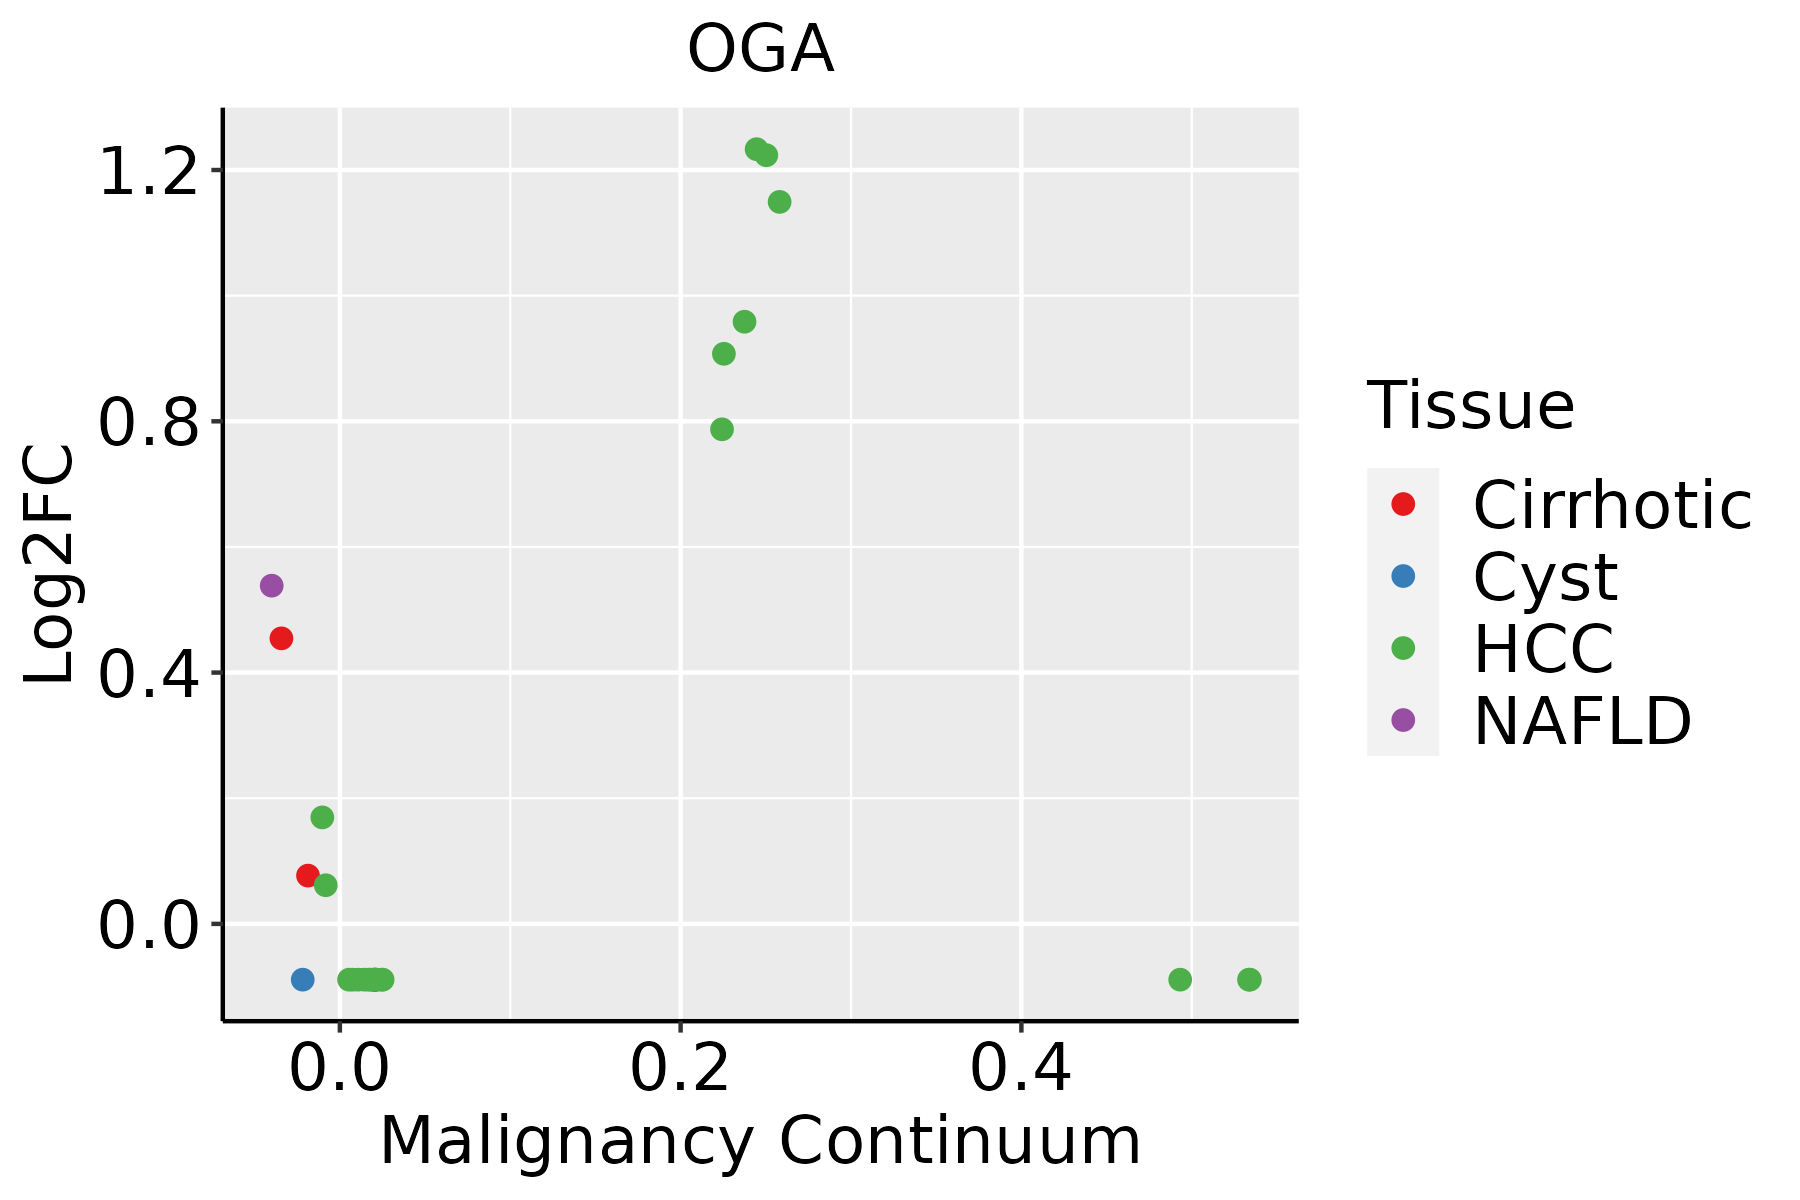 | HCC: Hepatocellular carcinoma |
| NAFLD: Non-alcoholic fatty liver disease | ||
| Lung | 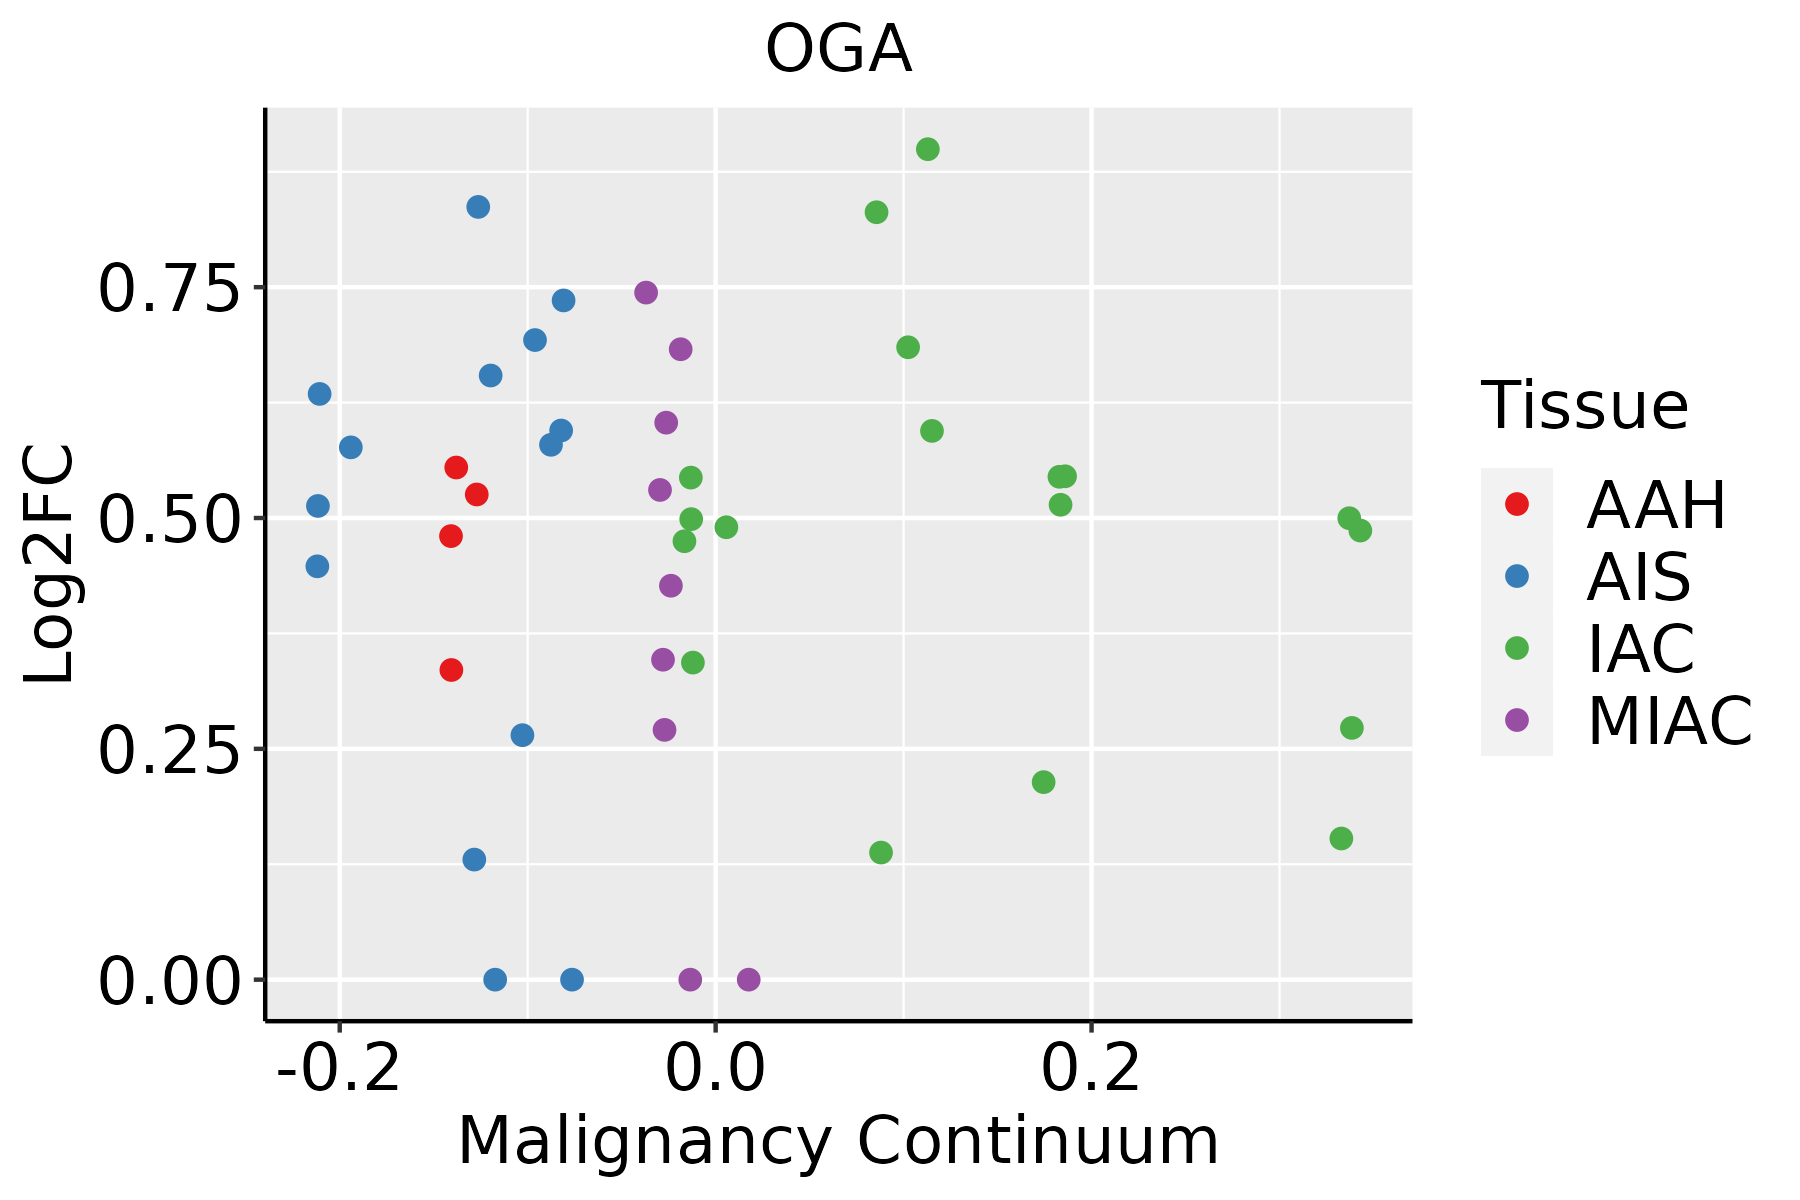 | AAH: Atypical adenomatous hyperplasia |
| AIS: Adenocarcinoma in situ | ||
| IAC: Invasive lung adenocarcinoma | ||
| MIA: Minimally invasive adenocarcinoma | ||
| Thyroid |  | ATC: Anaplastic thyroid cancer |
| HT: Hashimoto's thyroiditis | ||
| PTC: Papillary thyroid cancer |
| ∗log2FC in expression of this searched gene in stem-like cells from each diseased tissue sample relative to stem-like cells in normal samples in each tissue plotted against the malignancy continuum. Samples are colored based on if they are from different disease stage. |
Top |
Malignant transformation related pathway analysis |
| Find out the enriched GO biological processes and KEGG pathways involved in transition from healthy to precancer to cancer |
| Tissue | Disease Stage | Enriched GO biological Processes |
| Colorectum | AD |  |
| Colorectum | SER |  |
| Colorectum | MSS |  |
| Colorectum | MSI-H |  |
| Colorectum | FAP |  |
| ∗Top 15 enriched GO BP terms are showed in the bar plot of each disease state in each tissue. Each row represents a significant GO biological process which is colored according to the -log10(p.adjust). |
| Page: 1 2 3 4 5 6 7 8 9 |
| GO ID | Tissue | Disease Stage | Description | Gene Ratio | Bg Ratio | pvalue | p.adjust | Count |
| GO:000705222 | Thyroid | ATC | mitotic spindle organization | 80/6293 | 120/18723 | 1.27e-13 | 6.46e-12 | 80 |
| GO:000705122 | Thyroid | ATC | spindle organization | 109/6293 | 184/18723 | 7.99e-13 | 3.46e-11 | 109 |
| GO:005125829 | Thyroid | ATC | protein polymerization | 159/6293 | 297/18723 | 9.33e-13 | 3.96e-11 | 159 |
| GO:0051495111 | Thyroid | ATC | positive regulation of cytoskeleton organization | 125/6293 | 226/18723 | 1.39e-11 | 5.08e-10 | 125 |
| GO:190290529 | Thyroid | ATC | positive regulation of supramolecular fiber organization | 117/6293 | 209/18723 | 2.19e-11 | 7.80e-10 | 117 |
| GO:003227129 | Thyroid | ATC | regulation of protein polymerization | 127/6293 | 233/18723 | 3.64e-11 | 1.20e-09 | 127 |
| GO:003133428 | Thyroid | ATC | positive regulation of protein-containing complex assembly | 127/6293 | 237/18723 | 1.64e-10 | 4.93e-09 | 127 |
| GO:004828512 | Thyroid | ATC | organelle fission | 229/6293 | 488/18723 | 4.79e-10 | 1.29e-08 | 229 |
| GO:000028011 | Thyroid | ATC | nuclear division | 207/6293 | 439/18723 | 1.98e-09 | 4.80e-08 | 207 |
| GO:007050723 | Thyroid | ATC | regulation of microtubule cytoskeleton organization | 85/6293 | 148/18723 | 2.17e-09 | 5.21e-08 | 85 |
| GO:190165325 | Thyroid | ATC | cellular response to peptide | 173/6293 | 359/18723 | 5.87e-09 | 1.28e-07 | 173 |
| GO:004343428 | Thyroid | ATC | response to peptide hormone | 192/6293 | 414/18723 | 3.63e-08 | 6.70e-07 | 192 |
| GO:0032273113 | Thyroid | ATC | positive regulation of protein polymerization | 77/6293 | 138/18723 | 6.67e-08 | 1.17e-06 | 77 |
| GO:005122521 | Thyroid | ATC | spindle assembly | 66/6293 | 117/18723 | 3.28e-07 | 4.88e-06 | 66 |
| GO:007137524 | Thyroid | ATC | cellular response to peptide hormone stimulus | 138/6293 | 290/18723 | 4.90e-07 | 7.05e-06 | 138 |
| GO:009030721 | Thyroid | ATC | mitotic spindle assembly | 41/6293 | 65/18723 | 1.10e-06 | 1.43e-05 | 41 |
| GO:003286824 | Thyroid | ATC | response to insulin | 126/6293 | 264/18723 | 1.24e-06 | 1.59e-05 | 126 |
| GO:003286923 | Thyroid | ATC | cellular response to insulin stimulus | 101/6293 | 203/18723 | 1.34e-06 | 1.69e-05 | 101 |
| GO:003288613 | Thyroid | ATC | regulation of microtubule-based process | 114/6293 | 240/18723 | 5.17e-06 | 5.59e-05 | 114 |
| GO:001931814 | Thyroid | ATC | hexose metabolic process | 111/6293 | 237/18723 | 1.51e-05 | 1.41e-04 | 111 |
| Page: 1 2 3 4 5 6 7 8 9 10 11 12 13 14 15 |
| Pathway ID | Tissue | Disease Stage | Description | Gene Ratio | Bg Ratio | pvalue | p.adjust | qvalue | Count |
| hsa04931 | Colorectum | MSS | Insulin resistance | 36/1875 | 108/8465 | 4.74e-03 | 2.01e-02 | 1.23e-02 | 36 |
| hsa049311 | Colorectum | MSS | Insulin resistance | 36/1875 | 108/8465 | 4.74e-03 | 2.01e-02 | 1.23e-02 | 36 |
| hsa049312 | Colorectum | FAP | Insulin resistance | 32/1404 | 108/8465 | 4.90e-04 | 3.56e-03 | 2.16e-03 | 32 |
| hsa049313 | Colorectum | FAP | Insulin resistance | 32/1404 | 108/8465 | 4.90e-04 | 3.56e-03 | 2.16e-03 | 32 |
| hsa049314 | Colorectum | CRC | Insulin resistance | 28/1091 | 108/8465 | 1.78e-04 | 2.37e-03 | 1.61e-03 | 28 |
| hsa049315 | Colorectum | CRC | Insulin resistance | 28/1091 | 108/8465 | 1.78e-04 | 2.37e-03 | 1.61e-03 | 28 |
| hsa049318 | Esophagus | ESCC | Insulin resistance | 69/4205 | 108/8465 | 1.92e-03 | 5.54e-03 | 2.84e-03 | 69 |
| hsa0493113 | Esophagus | ESCC | Insulin resistance | 69/4205 | 108/8465 | 1.92e-03 | 5.54e-03 | 2.84e-03 | 69 |
| hsa049316 | Liver | NAFLD | Insulin resistance | 29/1043 | 108/8465 | 3.01e-05 | 7.59e-04 | 6.11e-04 | 29 |
| hsa0493111 | Liver | NAFLD | Insulin resistance | 29/1043 | 108/8465 | 3.01e-05 | 7.59e-04 | 6.11e-04 | 29 |
| hsa0493121 | Liver | HCC | Insulin resistance | 77/4020 | 108/8465 | 3.89e-07 | 4.46e-06 | 2.48e-06 | 77 |
| hsa0493131 | Liver | HCC | Insulin resistance | 77/4020 | 108/8465 | 3.89e-07 | 4.46e-06 | 2.48e-06 | 77 |
| Page: 1 |
Top |
Cell-cell communication analysis |
| Identification of potential cell-cell interactions between two cell types and their ligand-receptor pairs for different disease states |
| Ligand | Receptor | LRpair | Pathway | Tissue | Disease Stage |
| Page: 1 |
Top |
Single-cell gene regulatory network inference analysis |
| Find out the significant the regulons (TFs) and the target genes of each regulon across cell types for different disease states |
| TF | Cell Type | Tissue | Disease Stage | Target Gene | RSS | Regulon Activity |
| ∗The dot plots of a searched regulon are shown for all cell subpopulations in each disease state of each tissue based on the regulon specific score inferred using pySCENIC and by calculating the average expression. |
| Page: 1 |
Top |
Somatic mutation of malignant transformation related genes |
| Annotation of somatic variants for genes involved in malignant transformation |
| Hugo Symbol | Variant Class | Variant Classification | dbSNP RS | HGVSc | HGVSp | HGVSp Short | SWISSPROT | BIOTYPE | SIFT | PolyPhen | Tumor Sample Barcode | Tissue | Histology | Sex | Age | Stage | Therapy Types | Drugs | Outcome |
| Page: 1 |
Top |
Related drugs of malignant transformation related genes |
| Identification of chemicals and drugs interact with genes involved in malignant transfromation |
| (DGIdb 4.0) |
| Entrez ID | Symbol | Category | Interaction Types | Drug Claim Name | Drug Name | PMIDs |
| 10724 | OGA | ENZYME, DRUGGABLE GENOME | MK 8719 | |||
| 10724 | OGA | ENZYME, DRUGGABLE GENOME | inhibitor | 387065591 | CHEMBL1213603 | |
| 10724 | OGA | ENZYME, DRUGGABLE GENOME | inhibitor | 387065590 | ||
| 10724 | OGA | ENZYME, DRUGGABLE GENOME | STZ | STREPTOZOCIN | 11336633 |
| Page: 1 |

Copyright 2023-Present -The University of Texas Health Science Center at Houston |