
|
|||||
|
 | |
| |
| |
| |
| |
| |
|
Gene: LSM1 |
Gene summary for LSM1 |
| Gene information | Species | Human | Gene symbol | LSM1 | Gene ID | 27257 |
| Gene name | LSM1 homolog, mRNA degradation associated | |
| Gene Alias | CASM | |
| Cytomap | 8p11.23 | |
| Gene Type | protein-coding | GO ID | GO:0000288 | UniProtAcc | A0A0S2Z590 |
Top |
Malignant transformation analysis |
| Identification of the aberrant gene expression in precancerous and cancerous lesions by comparing the gene expression of stem-like cells in diseased tissues with normal stem cells |
| Entrez ID | Symbol | Replicates | Species | Organ | Tissue | Adj P-value | Log2FC | Malignancy |
| 27257 | LSM1 | GSM4909291 | Human | Breast | IDC | 6.32e-03 | 3.49e-01 | 0.1753 |
| 27257 | LSM1 | GSM4909296 | Human | Breast | IDC | 4.64e-04 | -6.91e-02 | 0.1524 |
| 27257 | LSM1 | GSM4909297 | Human | Breast | IDC | 6.30e-17 | 5.33e-01 | 0.1517 |
| 27257 | LSM1 | GSM4909308 | Human | Breast | IDC | 6.73e-04 | 3.05e-01 | 0.158 |
| 27257 | LSM1 | GSM4909309 | Human | Breast | IDC | 8.63e-13 | 5.17e-01 | 0.0483 |
| 27257 | LSM1 | GSM4909311 | Human | Breast | IDC | 7.79e-14 | -1.80e-01 | 0.1534 |
| 27257 | LSM1 | GSM4909312 | Human | Breast | IDC | 3.51e-06 | -1.30e-01 | 0.1552 |
| 27257 | LSM1 | GSM4909313 | Human | Breast | IDC | 1.46e-03 | -1.44e-01 | 0.0391 |
| 27257 | LSM1 | GSM4909317 | Human | Breast | IDC | 3.39e-16 | 5.37e-01 | 0.1355 |
| 27257 | LSM1 | GSM4909318 | Human | Breast | IDC | 6.17e-20 | 1.08e+00 | 0.2031 |
| 27257 | LSM1 | GSM4909319 | Human | Breast | IDC | 2.50e-19 | -6.03e-02 | 0.1563 |
| 27257 | LSM1 | GSM4909321 | Human | Breast | IDC | 6.95e-07 | -7.68e-02 | 0.1559 |
| 27257 | LSM1 | brca1 | Human | Breast | Precancer | 1.82e-03 | 3.27e-01 | -0.0338 |
| 27257 | LSM1 | NCCBC14 | Human | Breast | DCIS | 1.15e-02 | 6.47e-02 | 0.2021 |
| 27257 | LSM1 | NCCBC2 | Human | Breast | DCIS | 1.12e-06 | 4.76e-01 | 0.1554 |
| 27257 | LSM1 | NCCBC5 | Human | Breast | DCIS | 1.12e-04 | 1.01e-03 | 0.2046 |
| 27257 | LSM1 | P1 | Human | Breast | IDC | 1.80e-08 | -2.00e-01 | 0.1527 |
| 27257 | LSM1 | P2 | Human | Breast | IDC | 1.25e-26 | 8.66e-01 | 0.21 |
| 27257 | LSM1 | DCIS2 | Human | Breast | DCIS | 2.87e-35 | 8.78e-02 | 0.0085 |
| 27257 | LSM1 | LZE2T | Human | Esophagus | ESCC | 1.28e-03 | 8.37e-01 | 0.082 |
| Page: 1 2 3 4 5 6 7 |
| Tissue | Expression Dynamics | Abbreviation |
| Breast | 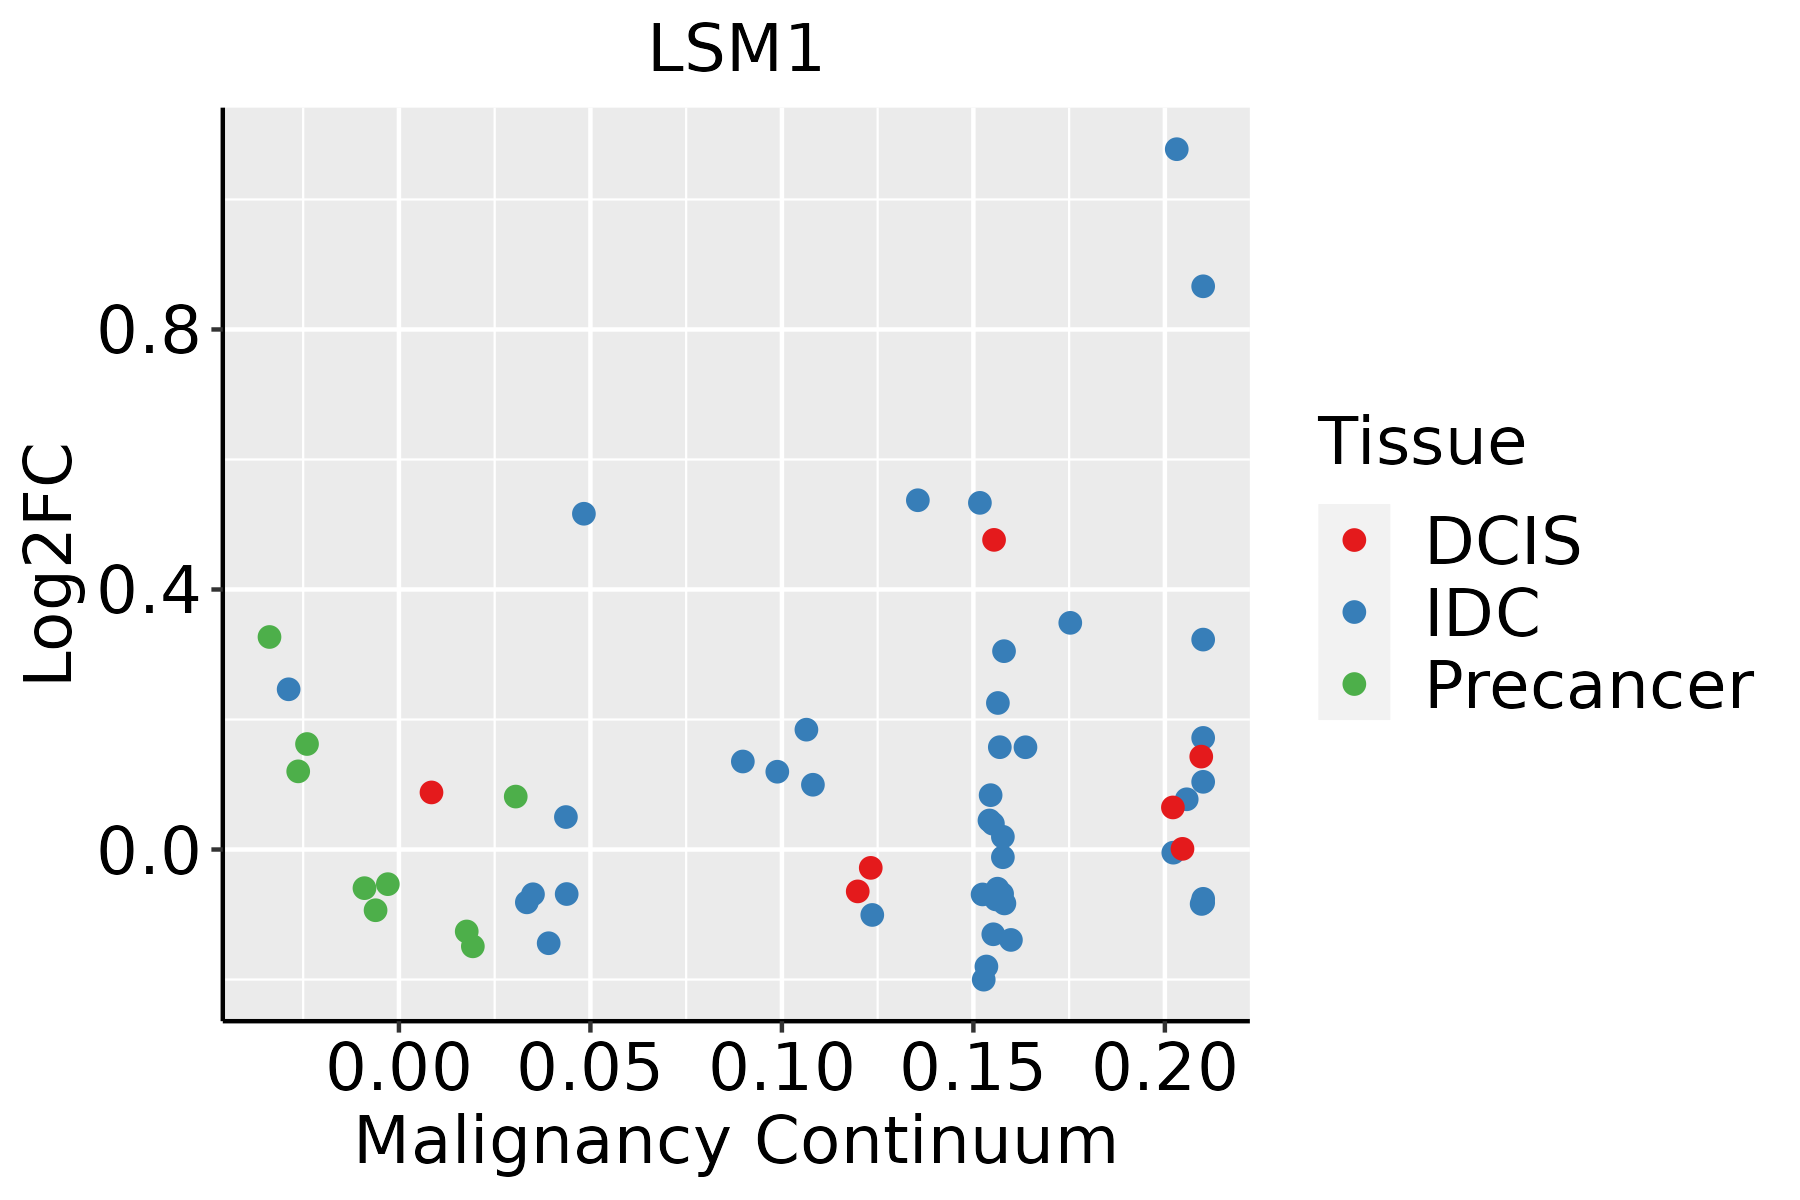 | IDC: Invasive ductal carcinoma |
| DCIS: Ductal carcinoma in situ | ||
| Precancer(BRCA1-mut): Precancerous lesion from BRCA1 mutation carriers | ||
| Esophagus |  | ESCC: Esophageal squamous cell carcinoma |
| HGIN: High-grade intraepithelial neoplasias | ||
| LGIN: Low-grade intraepithelial neoplasias | ||
| Liver |  | HCC: Hepatocellular carcinoma |
| NAFLD: Non-alcoholic fatty liver disease | ||
| Oral Cavity | 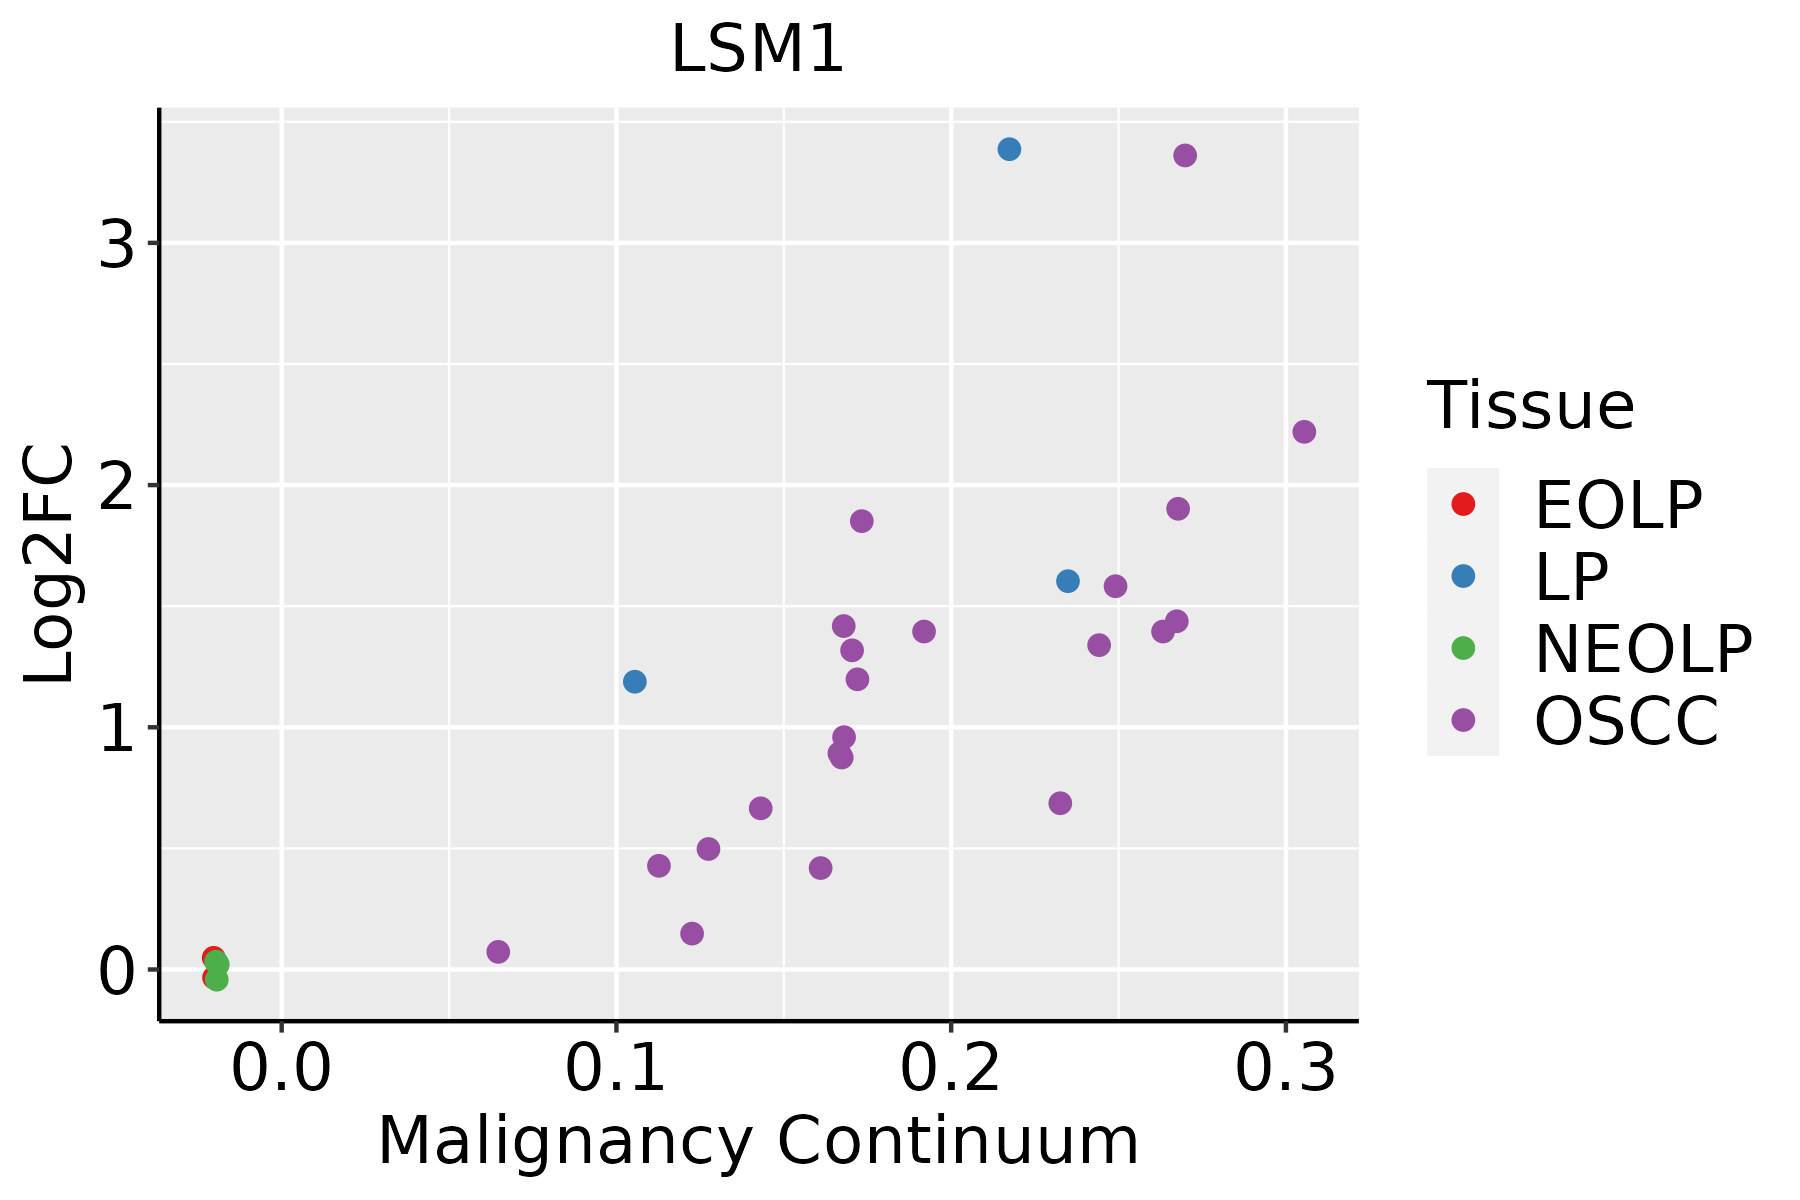 | EOLP: Erosive Oral lichen planus |
| LP: leukoplakia | ||
| NEOLP: Non-erosive oral lichen planus | ||
| OSCC: Oral squamous cell carcinoma | ||
| Prostate | 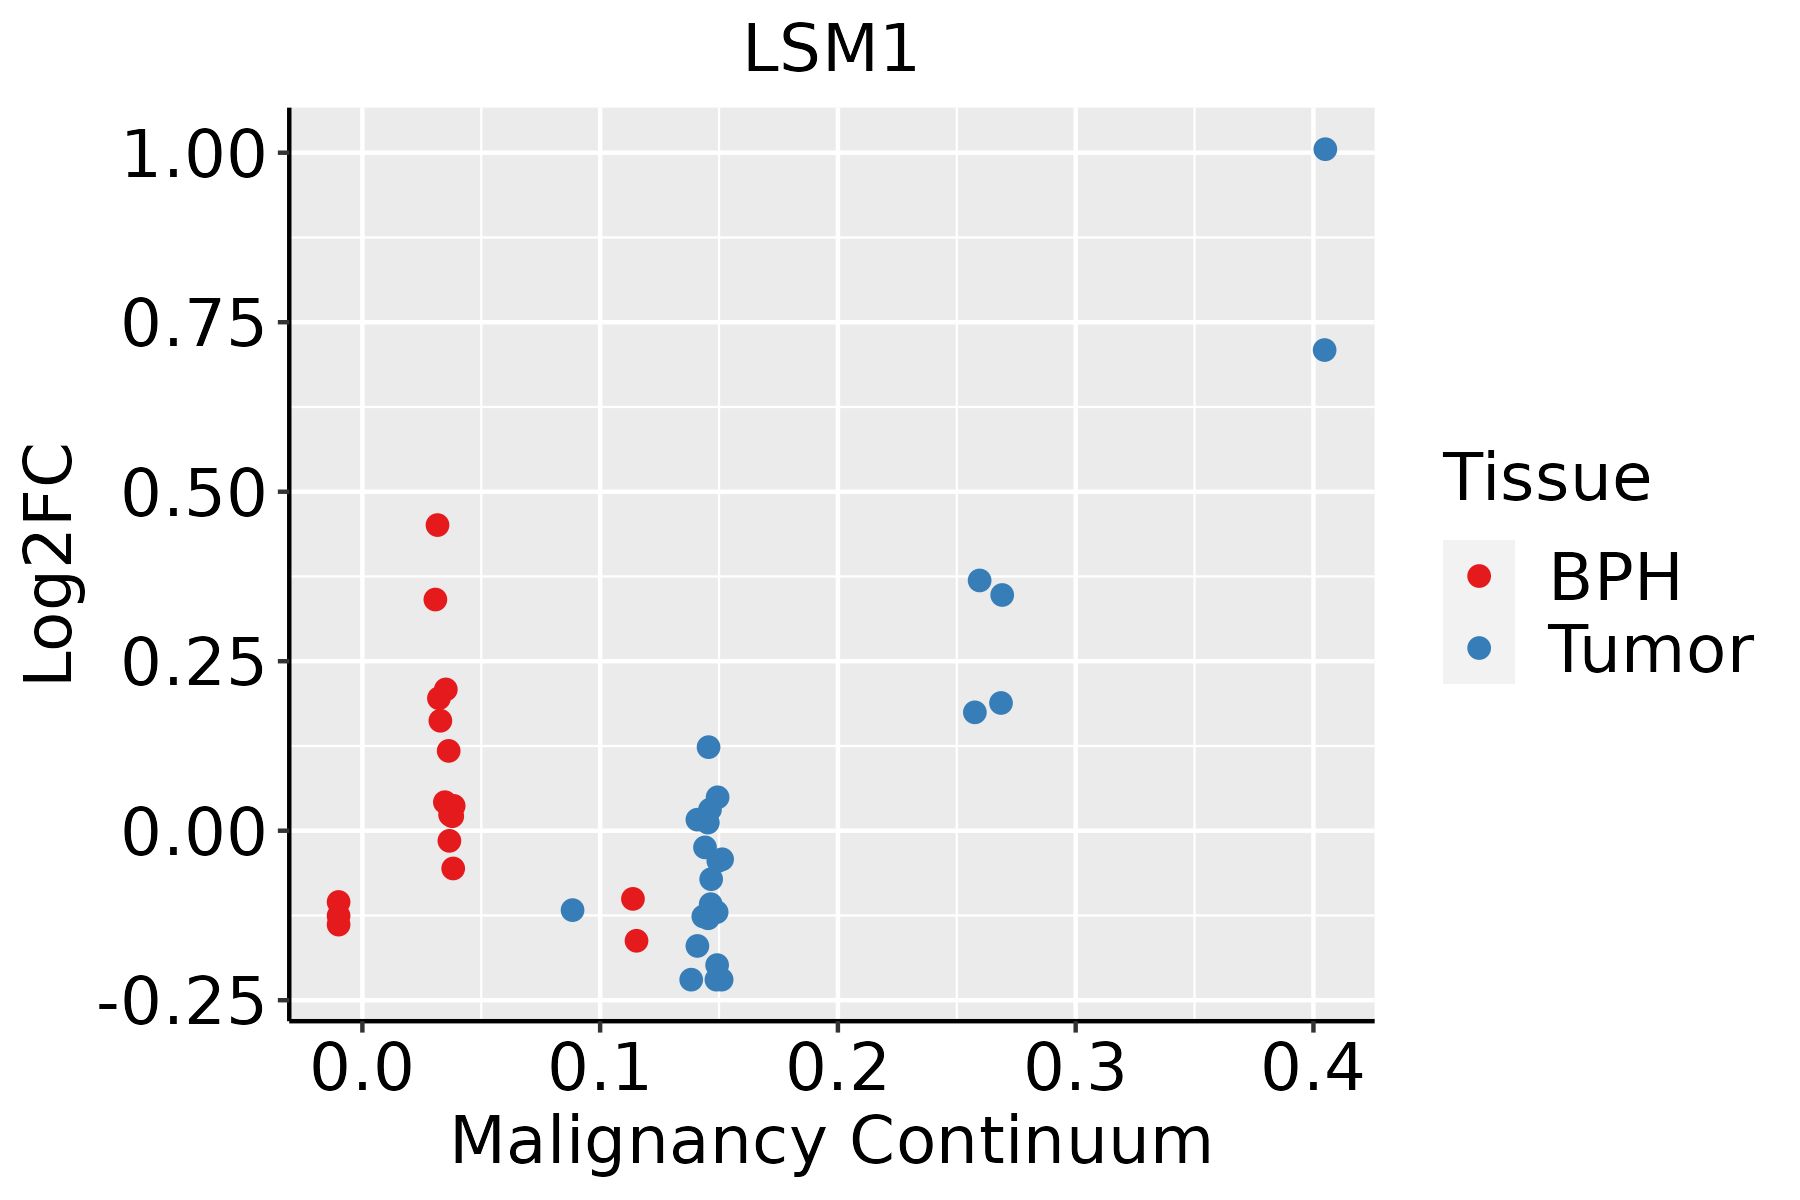 | BPH: Benign Prostatic Hyperplasia |
| Skin | 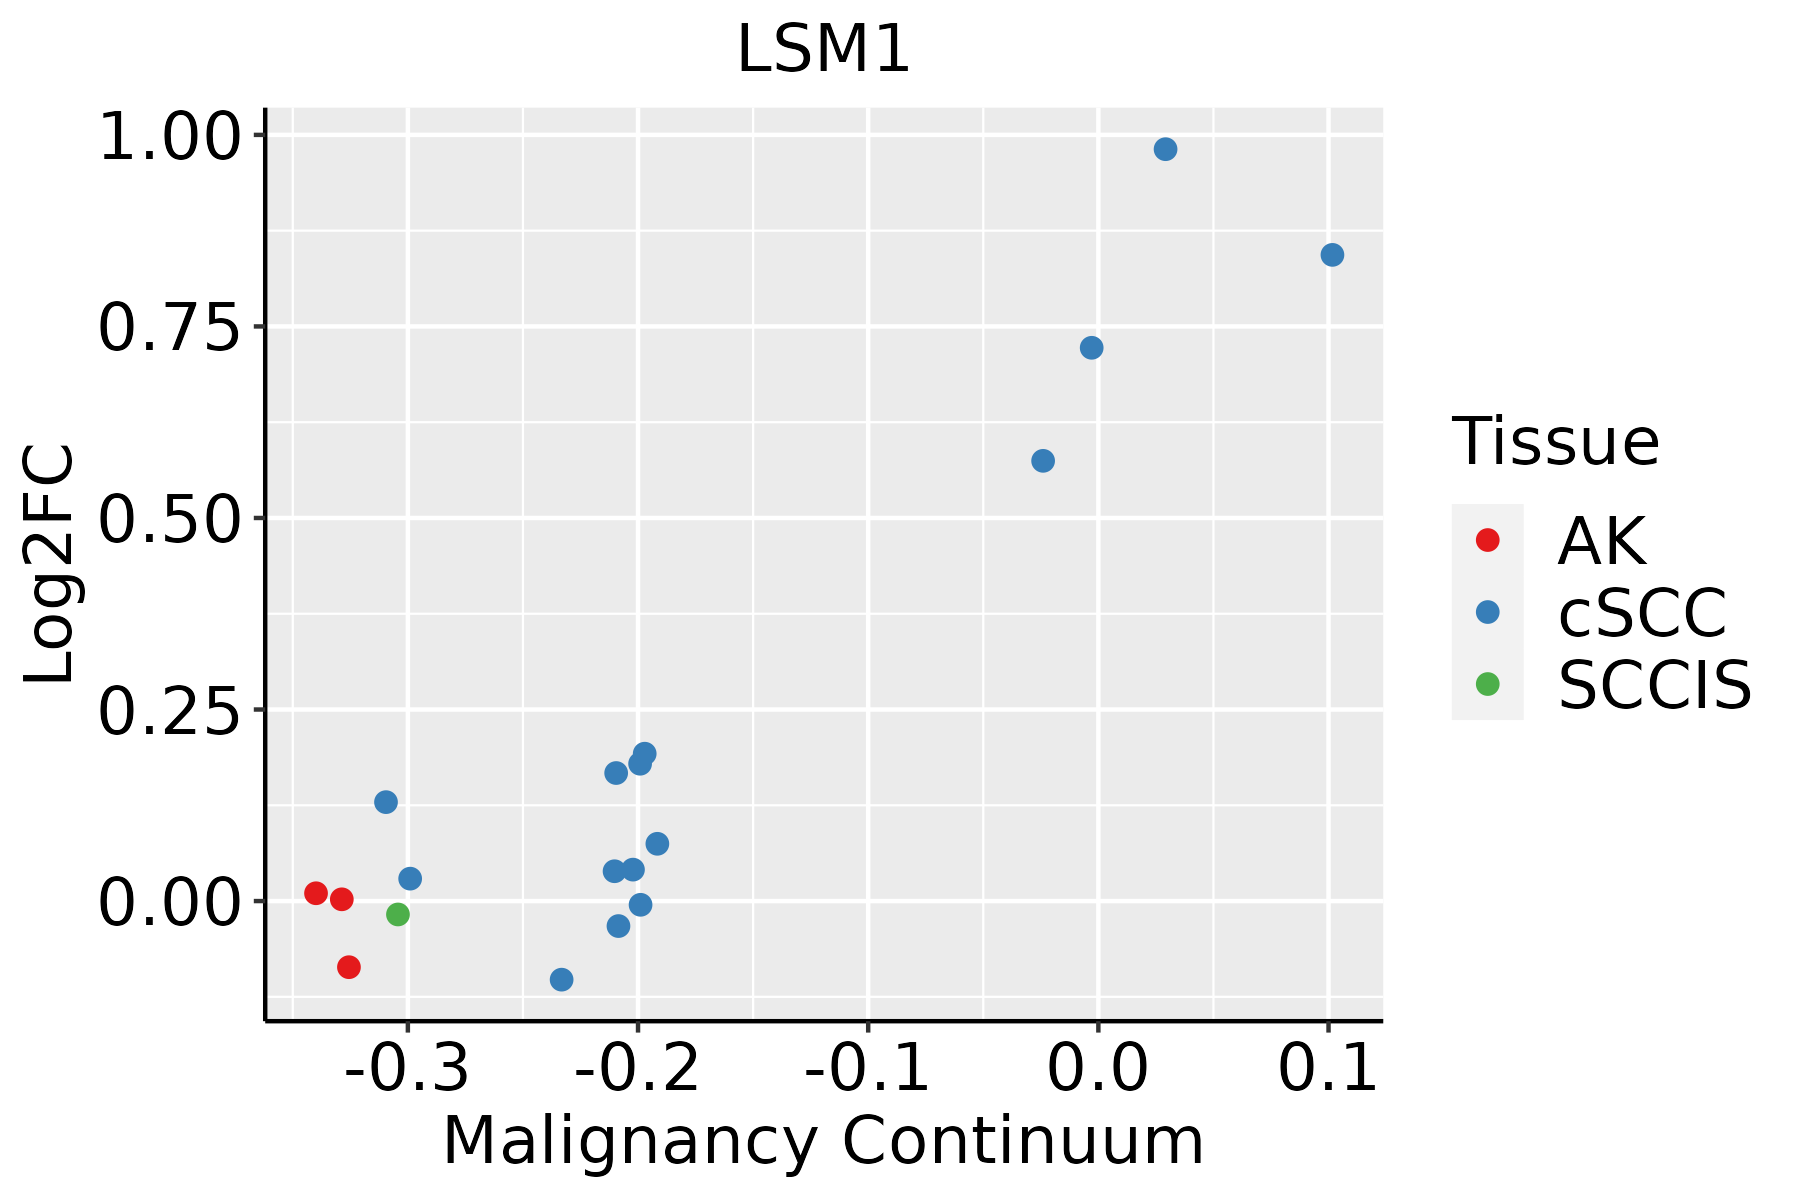 | AK: Actinic keratosis |
| cSCC: Cutaneous squamous cell carcinoma | ||
| SCCIS:squamous cell carcinoma in situ | ||
| Thyroid |  | ATC: Anaplastic thyroid cancer |
| HT: Hashimoto's thyroiditis | ||
| PTC: Papillary thyroid cancer |
| ∗log2FC in expression of this searched gene in stem-like cells from each diseased tissue sample relative to stem-like cells in normal samples in each tissue plotted against the malignancy continuum. Samples are colored based on if they are from different disease stage. |
Top |
Malignant transformation related pathway analysis |
| Find out the enriched GO biological processes and KEGG pathways involved in transition from healthy to precancer to cancer |
| Tissue | Disease Stage | Enriched GO biological Processes |
| Colorectum | AD |  |
| Colorectum | SER |  |
| Colorectum | MSS |  |
| Colorectum | MSI-H |  |
| Colorectum | FAP |  |
| ∗Top 15 enriched GO BP terms are showed in the bar plot of each disease state in each tissue. Each row represents a significant GO biological process which is colored according to the -log10(p.adjust). |
| Page: 1 2 3 4 5 6 7 8 9 |
| GO ID | Tissue | Disease Stage | Description | Gene Ratio | Bg Ratio | pvalue | p.adjust | Count |
| GO:005077911 | Liver | Cirrhotic | RNA destabilization | 39/4634 | 88/18723 | 4.69e-05 | 5.47e-04 | 39 |
| GO:006101411 | Liver | Cirrhotic | positive regulation of mRNA catabolic process | 38/4634 | 87/18723 | 8.55e-05 | 9.25e-04 | 38 |
| GO:00459313 | Liver | Cirrhotic | positive regulation of mitotic cell cycle | 49/4634 | 121/18723 | 9.47e-05 | 1.01e-03 | 49 |
| GO:001714811 | Liver | Cirrhotic | negative regulation of translation | 87/4634 | 245/18723 | 1.01e-04 | 1.05e-03 | 87 |
| GO:00447721 | Liver | Cirrhotic | mitotic cell cycle phase transition | 139/4634 | 424/18723 | 1.02e-04 | 1.06e-03 | 139 |
| GO:01400142 | Liver | Cirrhotic | mitotic nuclear division | 97/4634 | 287/18723 | 3.32e-04 | 2.87e-03 | 97 |
| GO:000028811 | Liver | Cirrhotic | nuclear-transcribed mRNA catabolic process, deadenylation-dependent decay | 26/4634 | 56/18723 | 3.40e-04 | 2.91e-03 | 26 |
| GO:1901990 | Liver | Cirrhotic | regulation of mitotic cell cycle phase transition | 100/4634 | 299/18723 | 4.13e-04 | 3.41e-03 | 100 |
| GO:00713572 | Liver | Cirrhotic | cellular response to type I interferon | 24/4634 | 52/18723 | 6.32e-04 | 4.83e-03 | 24 |
| GO:00070522 | Liver | Cirrhotic | mitotic spindle organization | 46/4634 | 120/18723 | 6.56e-04 | 4.98e-03 | 46 |
| GO:00603372 | Liver | Cirrhotic | type I interferon signaling pathway | 23/4634 | 50/18723 | 8.62e-04 | 6.22e-03 | 23 |
| GO:00339624 | Liver | Cirrhotic | P-body assembly | 12/4634 | 21/18723 | 1.53e-03 | 9.98e-03 | 12 |
| GO:001982711 | Liver | Cirrhotic | stem cell population maintenance | 48/4634 | 131/18723 | 1.58e-03 | 1.03e-02 | 48 |
| GO:2000045 | Liver | Cirrhotic | regulation of G1/S transition of mitotic cell cycle | 51/4634 | 142/18723 | 1.91e-03 | 1.20e-02 | 51 |
| GO:00000821 | Liver | Cirrhotic | G1/S transition of mitotic cell cycle | 72/4634 | 214/18723 | 2.07e-03 | 1.28e-02 | 72 |
| GO:00903073 | Liver | Cirrhotic | mitotic spindle assembly | 27/4634 | 65/18723 | 2.14e-03 | 1.32e-02 | 27 |
| GO:19028502 | Liver | Cirrhotic | microtubule cytoskeleton organization involved in mitosis | 52/4634 | 147/18723 | 2.52e-03 | 1.51e-02 | 52 |
| GO:009872711 | Liver | Cirrhotic | maintenance of cell number | 48/4634 | 134/18723 | 2.70e-03 | 1.58e-02 | 48 |
| GO:00321032 | Liver | Cirrhotic | positive regulation of response to external stimulus | 131/4634 | 427/18723 | 2.90e-03 | 1.66e-02 | 131 |
| GO:0031123 | Liver | Cirrhotic | RNA 3'-end processing | 42/4634 | 116/18723 | 3.85e-03 | 2.10e-02 | 42 |
| Page: 1 2 3 4 5 6 7 8 9 10 11 12 13 14 15 16 17 18 19 20 21 22 23 24 25 26 27 28 29 30 31 32 33 34 35 36 37 38 39 40 41 |
| Pathway ID | Tissue | Disease Stage | Description | Gene Ratio | Bg Ratio | pvalue | p.adjust | qvalue | Count |
| hsa030186 | Breast | Precancer | RNA degradation | 14/684 | 79/8465 | 3.97e-03 | 2.37e-02 | 1.81e-02 | 14 |
| hsa0301811 | Breast | Precancer | RNA degradation | 14/684 | 79/8465 | 3.97e-03 | 2.37e-02 | 1.81e-02 | 14 |
| hsa0301821 | Breast | IDC | RNA degradation | 16/867 | 79/8465 | 5.65e-03 | 3.13e-02 | 2.34e-02 | 16 |
| hsa0301831 | Breast | IDC | RNA degradation | 16/867 | 79/8465 | 5.65e-03 | 3.13e-02 | 2.34e-02 | 16 |
| hsa030184 | Breast | DCIS | RNA degradation | 16/846 | 79/8465 | 4.45e-03 | 2.46e-02 | 1.82e-02 | 16 |
| hsa030185 | Breast | DCIS | RNA degradation | 16/846 | 79/8465 | 4.45e-03 | 2.46e-02 | 1.82e-02 | 16 |
| hsa0301810 | Esophagus | HGIN | RNA degradation | 27/1383 | 79/8465 | 7.73e-05 | 9.00e-04 | 7.15e-04 | 27 |
| hsa0301815 | Esophagus | HGIN | RNA degradation | 27/1383 | 79/8465 | 7.73e-05 | 9.00e-04 | 7.15e-04 | 27 |
| hsa0301824 | Esophagus | ESCC | RNA degradation | 62/4205 | 79/8465 | 1.18e-07 | 9.39e-07 | 4.81e-07 | 62 |
| hsa0301834 | Esophagus | ESCC | RNA degradation | 62/4205 | 79/8465 | 1.18e-07 | 9.39e-07 | 4.81e-07 | 62 |
| hsa03018 | Liver | Cirrhotic | RNA degradation | 44/2530 | 79/8465 | 1.43e-06 | 1.65e-05 | 1.02e-05 | 44 |
| hsa030181 | Liver | Cirrhotic | RNA degradation | 44/2530 | 79/8465 | 1.43e-06 | 1.65e-05 | 1.02e-05 | 44 |
| hsa030182 | Liver | HCC | RNA degradation | 58/4020 | 79/8465 | 2.29e-06 | 2.19e-05 | 1.22e-05 | 58 |
| hsa030183 | Liver | HCC | RNA degradation | 58/4020 | 79/8465 | 2.29e-06 | 2.19e-05 | 1.22e-05 | 58 |
| hsa030189 | Oral cavity | OSCC | RNA degradation | 59/3704 | 79/8465 | 2.05e-08 | 1.91e-07 | 9.70e-08 | 59 |
| hsa0301814 | Oral cavity | OSCC | RNA degradation | 59/3704 | 79/8465 | 2.05e-08 | 1.91e-07 | 9.70e-08 | 59 |
| hsa0301823 | Oral cavity | LP | RNA degradation | 39/2418 | 79/8465 | 6.98e-05 | 4.38e-04 | 2.83e-04 | 39 |
| hsa0301833 | Oral cavity | LP | RNA degradation | 39/2418 | 79/8465 | 6.98e-05 | 4.38e-04 | 2.83e-04 | 39 |
| hsa030188 | Prostate | BPH | RNA degradation | 29/1718 | 79/8465 | 5.17e-04 | 2.67e-03 | 1.65e-03 | 29 |
| hsa0301813 | Prostate | BPH | RNA degradation | 29/1718 | 79/8465 | 5.17e-04 | 2.67e-03 | 1.65e-03 | 29 |
| Page: 1 2 |
Top |
Cell-cell communication analysis |
| Identification of potential cell-cell interactions between two cell types and their ligand-receptor pairs for different disease states |
| Ligand | Receptor | LRpair | Pathway | Tissue | Disease Stage |
| Page: 1 |
Top |
Single-cell gene regulatory network inference analysis |
| Find out the significant the regulons (TFs) and the target genes of each regulon across cell types for different disease states |
| TF | Cell Type | Tissue | Disease Stage | Target Gene | RSS | Regulon Activity |
| ∗The dot plots of a searched regulon are shown for all cell subpopulations in each disease state of each tissue based on the regulon specific score inferred using pySCENIC and by calculating the average expression. |
| Page: 1 |
Top |
Somatic mutation of malignant transformation related genes |
| Annotation of somatic variants for genes involved in malignant transformation |
| Hugo Symbol | Variant Class | Variant Classification | dbSNP RS | HGVSc | HGVSp | HGVSp Short | SWISSPROT | BIOTYPE | SIFT | PolyPhen | Tumor Sample Barcode | Tissue | Histology | Sex | Age | Stage | Therapy Types | Drugs | Outcome |
| LSM1 | SNV | Missense_Mutation | novel | c.98N>A | p.Arg33Lys | p.R33K | O15116 | protein_coding | deleterious(0.04) | possibly_damaging(0.71) | TCGA-BH-A0B6-01 | Breast | breast invasive carcinoma | Female | <65 | I/II | Unknown | Unknown | SD |
| LSM1 | SNV | Missense_Mutation | c.146N>A | p.Arg49His | p.R49H | O15116 | protein_coding | deleterious(0) | probably_damaging(0.996) | TCGA-AA-3681-01 | Colorectum | colon adenocarcinoma | Female | >=65 | III/IV | Unknown | Unknown | SD | |
| LSM1 | SNV | Missense_Mutation | c.364N>A | p.Leu122Ile | p.L122I | O15116 | protein_coding | tolerated(0.05) | benign(0.209) | TCGA-AA-3977-01 | Colorectum | colon adenocarcinoma | Male | >=65 | I/II | Unknown | Unknown | SD | |
| LSM1 | SNV | Missense_Mutation | c.176T>G | p.Ile59Ser | p.I59S | O15116 | protein_coding | deleterious(0) | possibly_damaging(0.791) | TCGA-AA-A00N-01 | Colorectum | colon adenocarcinoma | Male | >=65 | I/II | Unknown | Unknown | PD | |
| LSM1 | deletion | Frame_Shift_Del | c.165delA | p.Lys55AsnfsTer20 | p.K55Nfs*20 | O15116 | protein_coding | TCGA-A6-2672-01 | Colorectum | colon adenocarcinoma | Female | >=65 | III/IV | Unknown | Unknown | SD | |||
| LSM1 | SNV | Missense_Mutation | novel | c.238G>A | p.Glu80Lys | p.E80K | O15116 | protein_coding | tolerated(0.15) | benign(0.003) | TCGA-A5-A0G2-01 | Endometrium | uterine corpus endometrioid carcinoma | Female | <65 | III/IV | Unknown | Unknown | SD |
| LSM1 | SNV | Missense_Mutation | novel | c.312N>T | p.Gln104His | p.Q104H | O15116 | protein_coding | deleterious(0.02) | benign(0.428) | TCGA-AJ-A3EK-01 | Endometrium | uterine corpus endometrioid carcinoma | Female | <65 | I/II | Chemotherapy | carboplatin | CR |
| LSM1 | SNV | Missense_Mutation | novel | c.382N>A | p.Asp128Asn | p.D128N | O15116 | protein_coding | deleterious(0.02) | benign(0.006) | TCGA-AP-A1E0-01 | Endometrium | uterine corpus endometrioid carcinoma | Female | <65 | III/IV | Chemotherapy | paclitaxel | SD |
| LSM1 | SNV | Missense_Mutation | novel | c.145C>T | p.Arg49Cys | p.R49C | O15116 | protein_coding | deleterious(0) | probably_damaging(0.998) | TCGA-AX-A1C5-01 | Endometrium | uterine corpus endometrioid carcinoma | Female | <65 | III/IV | Unspecific | Carboplatin | SD |
| LSM1 | SNV | Missense_Mutation | c.263N>G | p.Gln88Arg | p.Q88R | O15116 | protein_coding | tolerated(0.3) | benign(0.001) | TCGA-D1-A17Q-01 | Endometrium | uterine corpus endometrioid carcinoma | Female | <65 | I/II | Unknown | Unknown | SD |
| Page: 1 2 |
Top |
Related drugs of malignant transformation related genes |
| Identification of chemicals and drugs interact with genes involved in malignant transfromation |
| (DGIdb 4.0) |
| Entrez ID | Symbol | Category | Interaction Types | Drug Claim Name | Drug Name | PMIDs |
| Page: 1 |

Copyright 2023-Present -The University of Texas Health Science Center at Houston |