
|
|||||
|
 | |
| |
| |
| |
| |
| |
|
Gene: INPP5K |
Gene summary for INPP5K |
| Gene information | Species | Human | Gene symbol | INPP5K | Gene ID | 51763 |
| Gene name | inositol polyphosphate-5-phosphatase K | |
| Gene Alias | MDCCAID | |
| Cytomap | 17p13.3 | |
| Gene Type | protein-coding | GO ID | GO:0000165 | UniProtAcc | Q9BT40 |
Top |
Malignant transformation analysis |
| Identification of the aberrant gene expression in precancerous and cancerous lesions by comparing the gene expression of stem-like cells in diseased tissues with normal stem cells |
| Entrez ID | Symbol | Replicates | Species | Organ | Tissue | Adj P-value | Log2FC | Malignancy |
| 51763 | INPP5K | LZE4T | Human | Esophagus | ESCC | 4.90e-08 | 3.18e-01 | 0.0811 |
| 51763 | INPP5K | LZE7T | Human | Esophagus | ESCC | 2.33e-04 | 1.95e-01 | 0.0667 |
| 51763 | INPP5K | LZE8T | Human | Esophagus | ESCC | 1.09e-07 | 1.18e-01 | 0.067 |
| 51763 | INPP5K | LZE21D1 | Human | Esophagus | HGIN | 2.29e-02 | 2.25e-01 | 0.0632 |
| 51763 | INPP5K | LZE22T | Human | Esophagus | ESCC | 1.29e-03 | 2.91e-01 | 0.068 |
| 51763 | INPP5K | LZE24T | Human | Esophagus | ESCC | 2.28e-22 | 6.12e-01 | 0.0596 |
| 51763 | INPP5K | LZE21T | Human | Esophagus | ESCC | 2.00e-06 | 2.50e-01 | 0.0655 |
| 51763 | INPP5K | P1T-E | Human | Esophagus | ESCC | 9.00e-13 | 6.12e-01 | 0.0875 |
| 51763 | INPP5K | P2T-E | Human | Esophagus | ESCC | 1.12e-22 | 3.52e-01 | 0.1177 |
| 51763 | INPP5K | P4T-E | Human | Esophagus | ESCC | 4.96e-13 | 3.60e-01 | 0.1323 |
| 51763 | INPP5K | P5T-E | Human | Esophagus | ESCC | 1.04e-05 | 9.09e-02 | 0.1327 |
| 51763 | INPP5K | P8T-E | Human | Esophagus | ESCC | 7.15e-18 | 3.48e-01 | 0.0889 |
| 51763 | INPP5K | P9T-E | Human | Esophagus | ESCC | 1.54e-13 | 3.86e-01 | 0.1131 |
| 51763 | INPP5K | P10T-E | Human | Esophagus | ESCC | 2.09e-32 | 4.56e-01 | 0.116 |
| 51763 | INPP5K | P11T-E | Human | Esophagus | ESCC | 8.79e-14 | 5.25e-01 | 0.1426 |
| 51763 | INPP5K | P12T-E | Human | Esophagus | ESCC | 1.57e-29 | 4.78e-01 | 0.1122 |
| 51763 | INPP5K | P15T-E | Human | Esophagus | ESCC | 1.20e-09 | 1.81e-01 | 0.1149 |
| 51763 | INPP5K | P16T-E | Human | Esophagus | ESCC | 4.00e-25 | 4.72e-01 | 0.1153 |
| 51763 | INPP5K | P17T-E | Human | Esophagus | ESCC | 9.80e-12 | 4.11e-01 | 0.1278 |
| 51763 | INPP5K | P19T-E | Human | Esophagus | ESCC | 1.69e-13 | 6.96e-01 | 0.1662 |
| Page: 1 2 3 4 |
| Tissue | Expression Dynamics | Abbreviation |
| Esophagus |  | ESCC: Esophageal squamous cell carcinoma |
| HGIN: High-grade intraepithelial neoplasias | ||
| LGIN: Low-grade intraepithelial neoplasias | ||
| Oral Cavity | 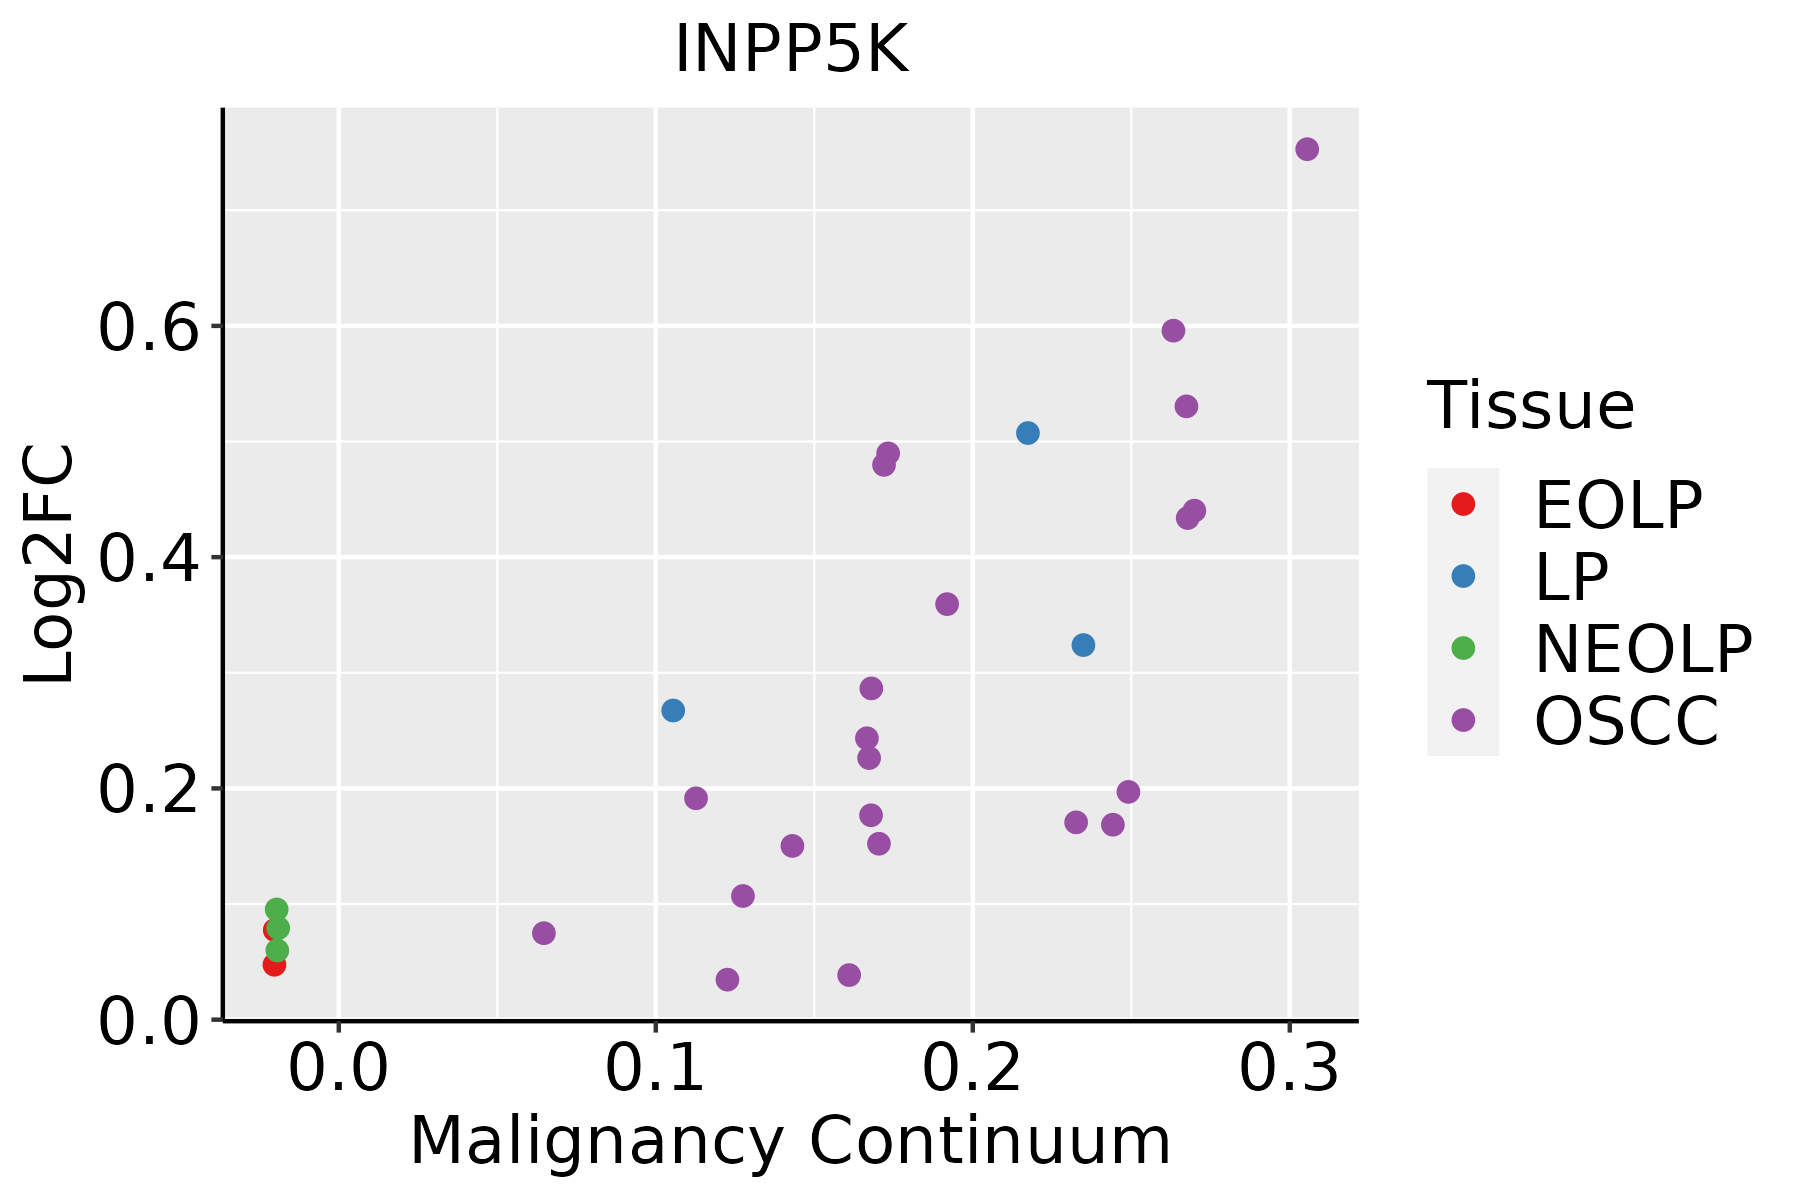 | EOLP: Erosive Oral lichen planus |
| LP: leukoplakia | ||
| NEOLP: Non-erosive oral lichen planus | ||
| OSCC: Oral squamous cell carcinoma |
| ∗log2FC in expression of this searched gene in stem-like cells from each diseased tissue sample relative to stem-like cells in normal samples in each tissue plotted against the malignancy continuum. Samples are colored based on if they are from different disease stage. |
Top |
Malignant transformation related pathway analysis |
| Find out the enriched GO biological processes and KEGG pathways involved in transition from healthy to precancer to cancer |
| Tissue | Disease Stage | Enriched GO biological Processes |
| Colorectum | AD |  |
| Colorectum | SER |  |
| Colorectum | MSS |  |
| Colorectum | MSI-H |  |
| Colorectum | FAP |  |
| ∗Top 15 enriched GO BP terms are showed in the bar plot of each disease state in each tissue. Each row represents a significant GO biological process which is colored according to the -log10(p.adjust). |
| Page: 1 2 3 4 5 6 7 8 9 |
| GO ID | Tissue | Disease Stage | Description | Gene Ratio | Bg Ratio | pvalue | p.adjust | Count |
| GO:007265919 | Oral cavity | LP | protein localization to plasma membrane | 119/4623 | 284/18723 | 1.11e-10 | 6.44e-09 | 119 |
| GO:1903900110 | Oral cavity | LP | regulation of viral life cycle | 72/4623 | 148/18723 | 2.23e-10 | 1.19e-08 | 72 |
| GO:199077817 | Oral cavity | LP | protein localization to cell periphery | 133/4623 | 333/18723 | 4.42e-10 | 2.21e-08 | 133 |
| GO:000170117 | Oral cavity | LP | in utero embryonic development | 142/4623 | 367/18723 | 1.48e-09 | 6.75e-08 | 142 |
| GO:004506918 | Oral cavity | LP | regulation of viral genome replication | 45/4623 | 85/18723 | 2.02e-08 | 7.41e-07 | 45 |
| GO:0051348110 | Oral cavity | LP | negative regulation of transferase activity | 106/4623 | 268/18723 | 4.60e-08 | 1.61e-06 | 106 |
| GO:000661211 | Oral cavity | LP | protein targeting to membrane | 60/4623 | 131/18723 | 1.10e-07 | 3.59e-06 | 60 |
| GO:190547517 | Oral cavity | LP | regulation of protein localization to membrane | 74/4623 | 175/18723 | 2.26e-07 | 6.81e-06 | 74 |
| GO:001063919 | Oral cavity | LP | negative regulation of organelle organization | 127/4623 | 348/18723 | 5.07e-07 | 1.40e-05 | 127 |
| GO:0010563110 | Oral cavity | LP | negative regulation of phosphorus metabolic process | 153/4623 | 442/18723 | 1.47e-06 | 3.53e-05 | 153 |
| GO:0045936110 | Oral cavity | LP | negative regulation of phosphate metabolic process | 152/4623 | 441/18723 | 2.10e-06 | 4.77e-05 | 152 |
| GO:004852515 | Oral cavity | LP | negative regulation of viral process | 43/4623 | 92/18723 | 3.47e-06 | 7.35e-05 | 43 |
| GO:1902903110 | Oral cavity | LP | regulation of supramolecular fiber organization | 131/4623 | 383/18723 | 1.58e-05 | 2.78e-04 | 131 |
| GO:007084917 | Oral cavity | LP | response to epidermal growth factor | 26/4623 | 49/18723 | 1.84e-05 | 3.14e-04 | 26 |
| GO:0042326110 | Oral cavity | LP | negative regulation of phosphorylation | 131/4623 | 385/18723 | 2.10e-05 | 3.46e-04 | 131 |
| GO:190353314 | Oral cavity | LP | regulation of protein targeting | 37/4623 | 81/18723 | 3.07e-05 | 4.74e-04 | 37 |
| GO:190382813 | Oral cavity | LP | negative regulation of cellular protein localization | 49/4623 | 117/18723 | 3.18e-05 | 4.89e-04 | 49 |
| GO:007136417 | Oral cavity | LP | cellular response to epidermal growth factor stimulus | 24/4623 | 45/18723 | 3.44e-05 | 5.18e-04 | 24 |
| GO:004507113 | Oral cavity | LP | negative regulation of viral genome replication | 28/4623 | 56/18723 | 3.75e-05 | 5.55e-04 | 28 |
| GO:0043434110 | Oral cavity | LP | response to peptide hormone | 138/4623 | 414/18723 | 4.00e-05 | 5.87e-04 | 138 |
| Page: 1 2 3 4 5 6 7 8 9 10 11 12 13 14 15 16 |
| Pathway ID | Tissue | Disease Stage | Description | Gene Ratio | Bg Ratio | pvalue | p.adjust | qvalue | Count |
| Page: 1 |
Top |
Cell-cell communication analysis |
| Identification of potential cell-cell interactions between two cell types and their ligand-receptor pairs for different disease states |
| Ligand | Receptor | LRpair | Pathway | Tissue | Disease Stage |
| Page: 1 |
Top |
Single-cell gene regulatory network inference analysis |
| Find out the significant the regulons (TFs) and the target genes of each regulon across cell types for different disease states |
| TF | Cell Type | Tissue | Disease Stage | Target Gene | RSS | Regulon Activity |
| ∗The dot plots of a searched regulon are shown for all cell subpopulations in each disease state of each tissue based on the regulon specific score inferred using pySCENIC and by calculating the average expression. |
| Page: 1 |
Top |
Somatic mutation of malignant transformation related genes |
| Annotation of somatic variants for genes involved in malignant transformation |
| Hugo Symbol | Variant Class | Variant Classification | dbSNP RS | HGVSc | HGVSp | HGVSp Short | SWISSPROT | BIOTYPE | SIFT | PolyPhen | Tumor Sample Barcode | Tissue | Histology | Sex | Age | Stage | Therapy Types | Drugs | Outcome |
| INPP5K | deletion | Frame_Shift_Del | novel | c.415delN | p.Tyr139MetfsTer55 | p.Y139Mfs*55 | Q9BT40 | protein_coding | TCGA-D8-A27V-01 | Breast | breast invasive carcinoma | Female | <65 | I/II | Hormone Therapy | tamoxiphen | SD | ||
| INPP5K | SNV | Missense_Mutation | novel | c.258C>G | p.Ile86Met | p.I86M | Q9BT40 | protein_coding | deleterious(0.01) | possibly_damaging(0.756) | TCGA-JW-A5VL-01 | Cervix | cervical & endocervical cancer | Female | <65 | I/II | Unknown | Unknown | SD |
| INPP5K | SNV | Missense_Mutation | rs138972043 | c.1259N>A | p.Arg420His | p.R420H | Q9BT40 | protein_coding | tolerated(0.65) | benign(0.001) | TCGA-AA-3672-01 | Colorectum | colon adenocarcinoma | Female | >=65 | III/IV | Unknown | Unknown | SD |
| INPP5K | SNV | Missense_Mutation | c.809N>A | p.Arg270His | p.R270H | Q9BT40 | protein_coding | deleterious(0) | probably_damaging(0.999) | TCGA-AA-A02R-01 | Colorectum | colon adenocarcinoma | Female | >=65 | I/II | Unknown | Unknown | PD | |
| INPP5K | SNV | Missense_Mutation | rs779661934 | c.212N>T | p.Ser71Leu | p.S71L | Q9BT40 | protein_coding | deleterious(0.02) | benign(0.028) | TCGA-AZ-4315-01 | Colorectum | colon adenocarcinoma | Male | <65 | I/II | Unknown | Unknown | SD |
| INPP5K | SNV | Missense_Mutation | c.809G>A | p.Arg270His | p.R270H | Q9BT40 | protein_coding | deleterious(0) | probably_damaging(0.999) | TCGA-F4-6856-01 | Colorectum | colon adenocarcinoma | Male | <65 | I/II | Ancillary | leucovorin | CR | |
| INPP5K | SNV | Missense_Mutation | c.112C>A | p.Leu38Met | p.L38M | Q9BT40 | protein_coding | deleterious(0.01) | probably_damaging(0.984) | TCGA-AF-6672-01 | Colorectum | rectum adenocarcinoma | Male | <65 | III/IV | Ancillary | leucovorin | PD | |
| INPP5K | SNV | Missense_Mutation | novel | c.239N>C | p.Leu80Pro | p.L80P | Q9BT40 | protein_coding | deleterious(0) | probably_damaging(0.999) | TCGA-A5-A0G2-01 | Endometrium | uterine corpus endometrioid carcinoma | Female | <65 | III/IV | Unknown | Unknown | SD |
| INPP5K | SNV | Missense_Mutation | rs756203232 | c.1258N>T | p.Arg420Cys | p.R420C | Q9BT40 | protein_coding | deleterious(0.01) | possibly_damaging(0.513) | TCGA-AP-A059-01 | Endometrium | uterine corpus endometrioid carcinoma | Female | >=65 | I/II | Unknown | Unknown | SD |
| INPP5K | SNV | Missense_Mutation | novel | c.989N>C | p.Leu330Pro | p.L330P | Q9BT40 | protein_coding | tolerated(0.07) | benign(0.027) | TCGA-AP-A1DK-01 | Endometrium | uterine corpus endometrioid carcinoma | Female | <65 | I/II | Unknown | Unknown | SD |
| Page: 1 2 3 |
Top |
Related drugs of malignant transformation related genes |
| Identification of chemicals and drugs interact with genes involved in malignant transfromation |
| (DGIdb 4.0) |
| Entrez ID | Symbol | Category | Interaction Types | Drug Claim Name | Drug Name | PMIDs |
| Page: 1 |

Copyright 2023-Present -The University of Texas Health Science Center at Houston |