
|
|||||
|
 | |
| |
| |
| |
| |
| |
|
Gene: HTT |
Gene summary for HTT |
| Gene information | Species | Human | Gene symbol | HTT | Gene ID | 3064 |
| Gene name | huntingtin | |
| Gene Alias | HD | |
| Cytomap | 4p16.3 | |
| Gene Type | protein-coding | GO ID | GO:0000132 | UniProtAcc | P42858 |
Top |
Malignant transformation analysis |
| Identification of the aberrant gene expression in precancerous and cancerous lesions by comparing the gene expression of stem-like cells in diseased tissues with normal stem cells |
| Entrez ID | Symbol | Replicates | Species | Organ | Tissue | Adj P-value | Log2FC | Malignancy |
| 3064 | HTT | LZE7T | Human | Esophagus | ESCC | 3.73e-09 | 3.57e-01 | 0.0667 |
| 3064 | HTT | LZE8T | Human | Esophagus | ESCC | 3.31e-02 | 4.78e-02 | 0.067 |
| 3064 | HTT | LZE20T | Human | Esophagus | ESCC | 2.39e-07 | 1.87e-01 | 0.0662 |
| 3064 | HTT | LZE22T | Human | Esophagus | ESCC | 1.72e-02 | 1.49e-01 | 0.068 |
| 3064 | HTT | LZE24T | Human | Esophagus | ESCC | 1.72e-04 | 1.04e-01 | 0.0596 |
| 3064 | HTT | LZE21T | Human | Esophagus | ESCC | 3.01e-03 | 1.80e-01 | 0.0655 |
| 3064 | HTT | P1T-E | Human | Esophagus | ESCC | 1.49e-02 | 1.30e-01 | 0.0875 |
| 3064 | HTT | P2T-E | Human | Esophagus | ESCC | 3.66e-22 | 3.86e-01 | 0.1177 |
| 3064 | HTT | P4T-E | Human | Esophagus | ESCC | 5.81e-10 | 1.49e-01 | 0.1323 |
| 3064 | HTT | P5T-E | Human | Esophagus | ESCC | 7.74e-06 | 3.34e-02 | 0.1327 |
| 3064 | HTT | P8T-E | Human | Esophagus | ESCC | 9.31e-18 | 2.46e-01 | 0.0889 |
| 3064 | HTT | P9T-E | Human | Esophagus | ESCC | 3.09e-09 | 1.41e-01 | 0.1131 |
| 3064 | HTT | P10T-E | Human | Esophagus | ESCC | 2.76e-06 | 1.09e-01 | 0.116 |
| 3064 | HTT | P11T-E | Human | Esophagus | ESCC | 2.27e-04 | 1.92e-01 | 0.1426 |
| 3064 | HTT | P12T-E | Human | Esophagus | ESCC | 1.60e-14 | 1.35e-01 | 0.1122 |
| 3064 | HTT | P15T-E | Human | Esophagus | ESCC | 3.77e-07 | 6.69e-02 | 0.1149 |
| 3064 | HTT | P16T-E | Human | Esophagus | ESCC | 2.43e-08 | 1.38e-01 | 0.1153 |
| 3064 | HTT | P17T-E | Human | Esophagus | ESCC | 3.01e-08 | 2.41e-01 | 0.1278 |
| 3064 | HTT | P19T-E | Human | Esophagus | ESCC | 8.63e-06 | 3.02e-01 | 0.1662 |
| 3064 | HTT | P20T-E | Human | Esophagus | ESCC | 1.23e-04 | 6.66e-02 | 0.1124 |
| Page: 1 2 3 4 5 6 |
| Tissue | Expression Dynamics | Abbreviation |
| Esophagus | 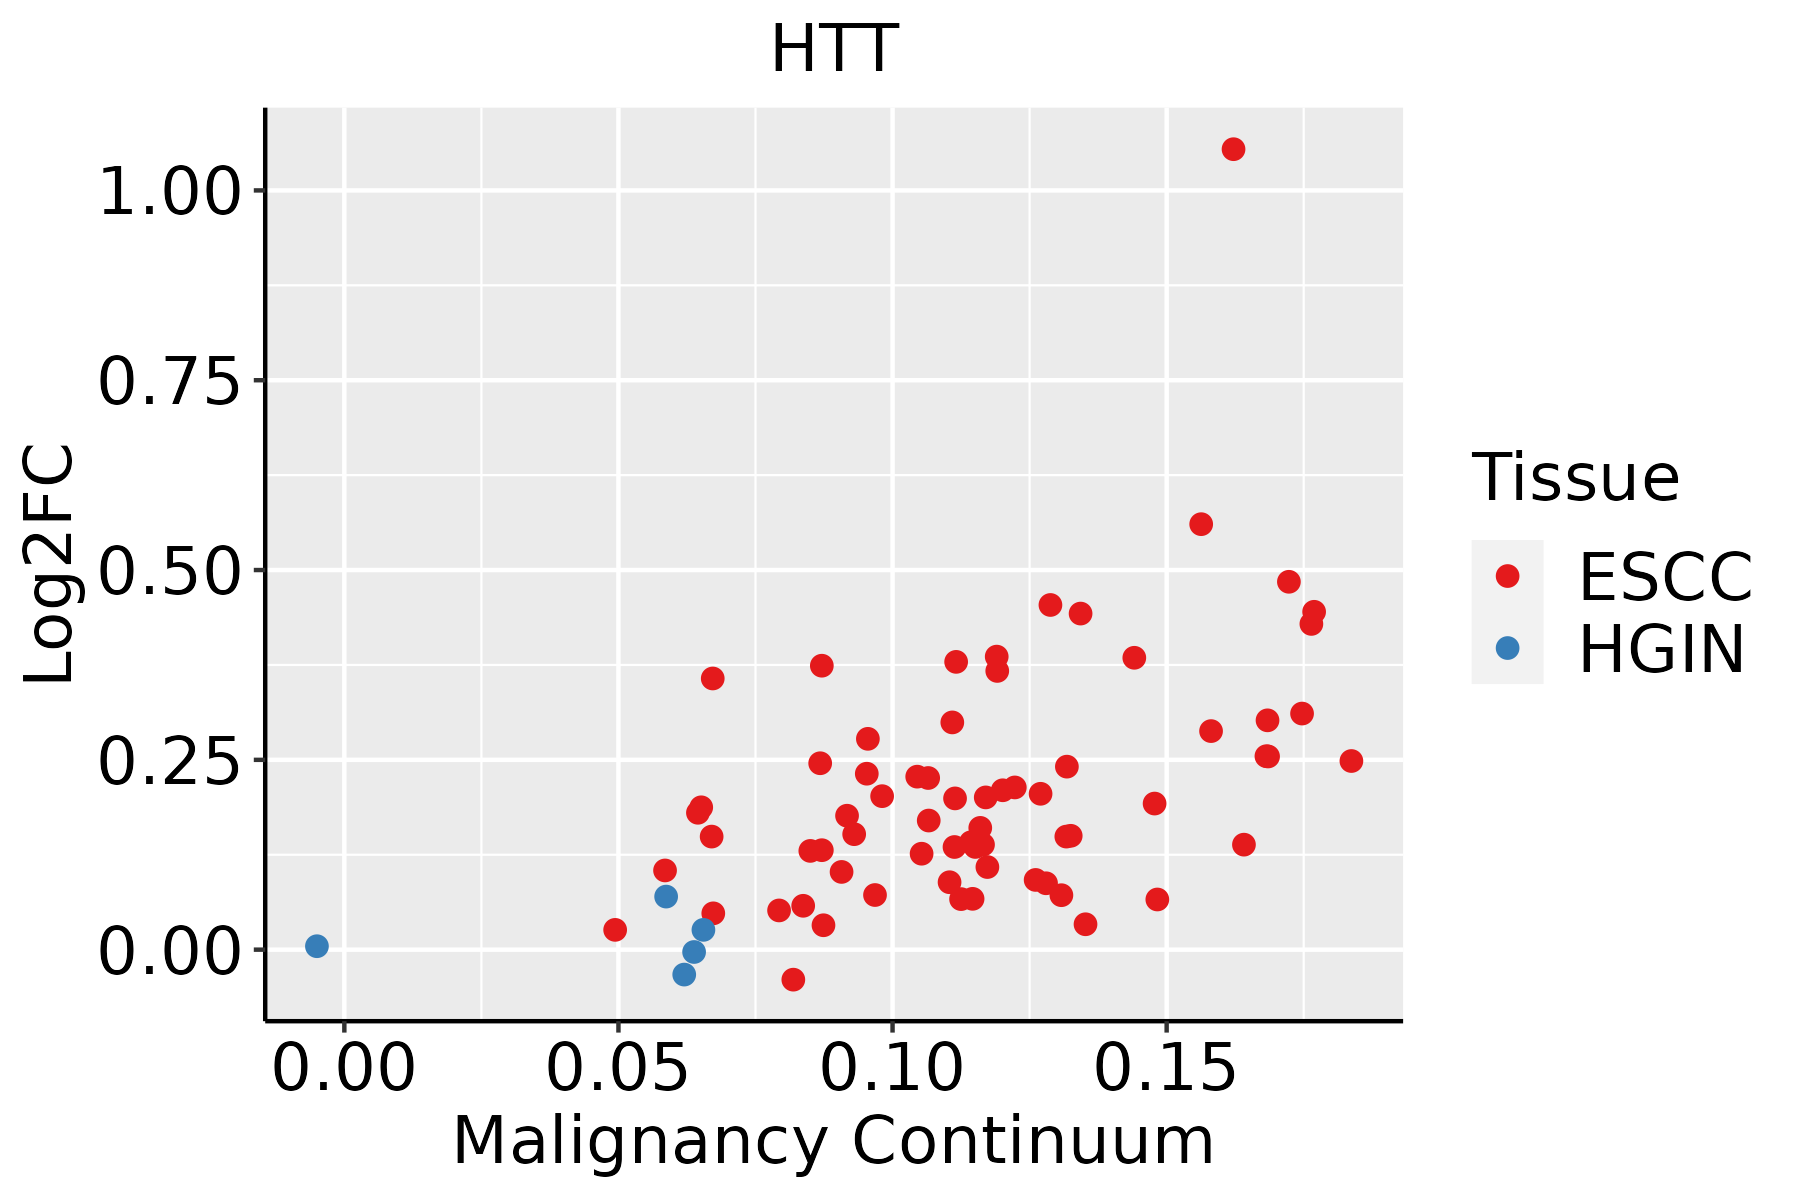 | ESCC: Esophageal squamous cell carcinoma |
| HGIN: High-grade intraepithelial neoplasias | ||
| LGIN: Low-grade intraepithelial neoplasias | ||
| Liver | 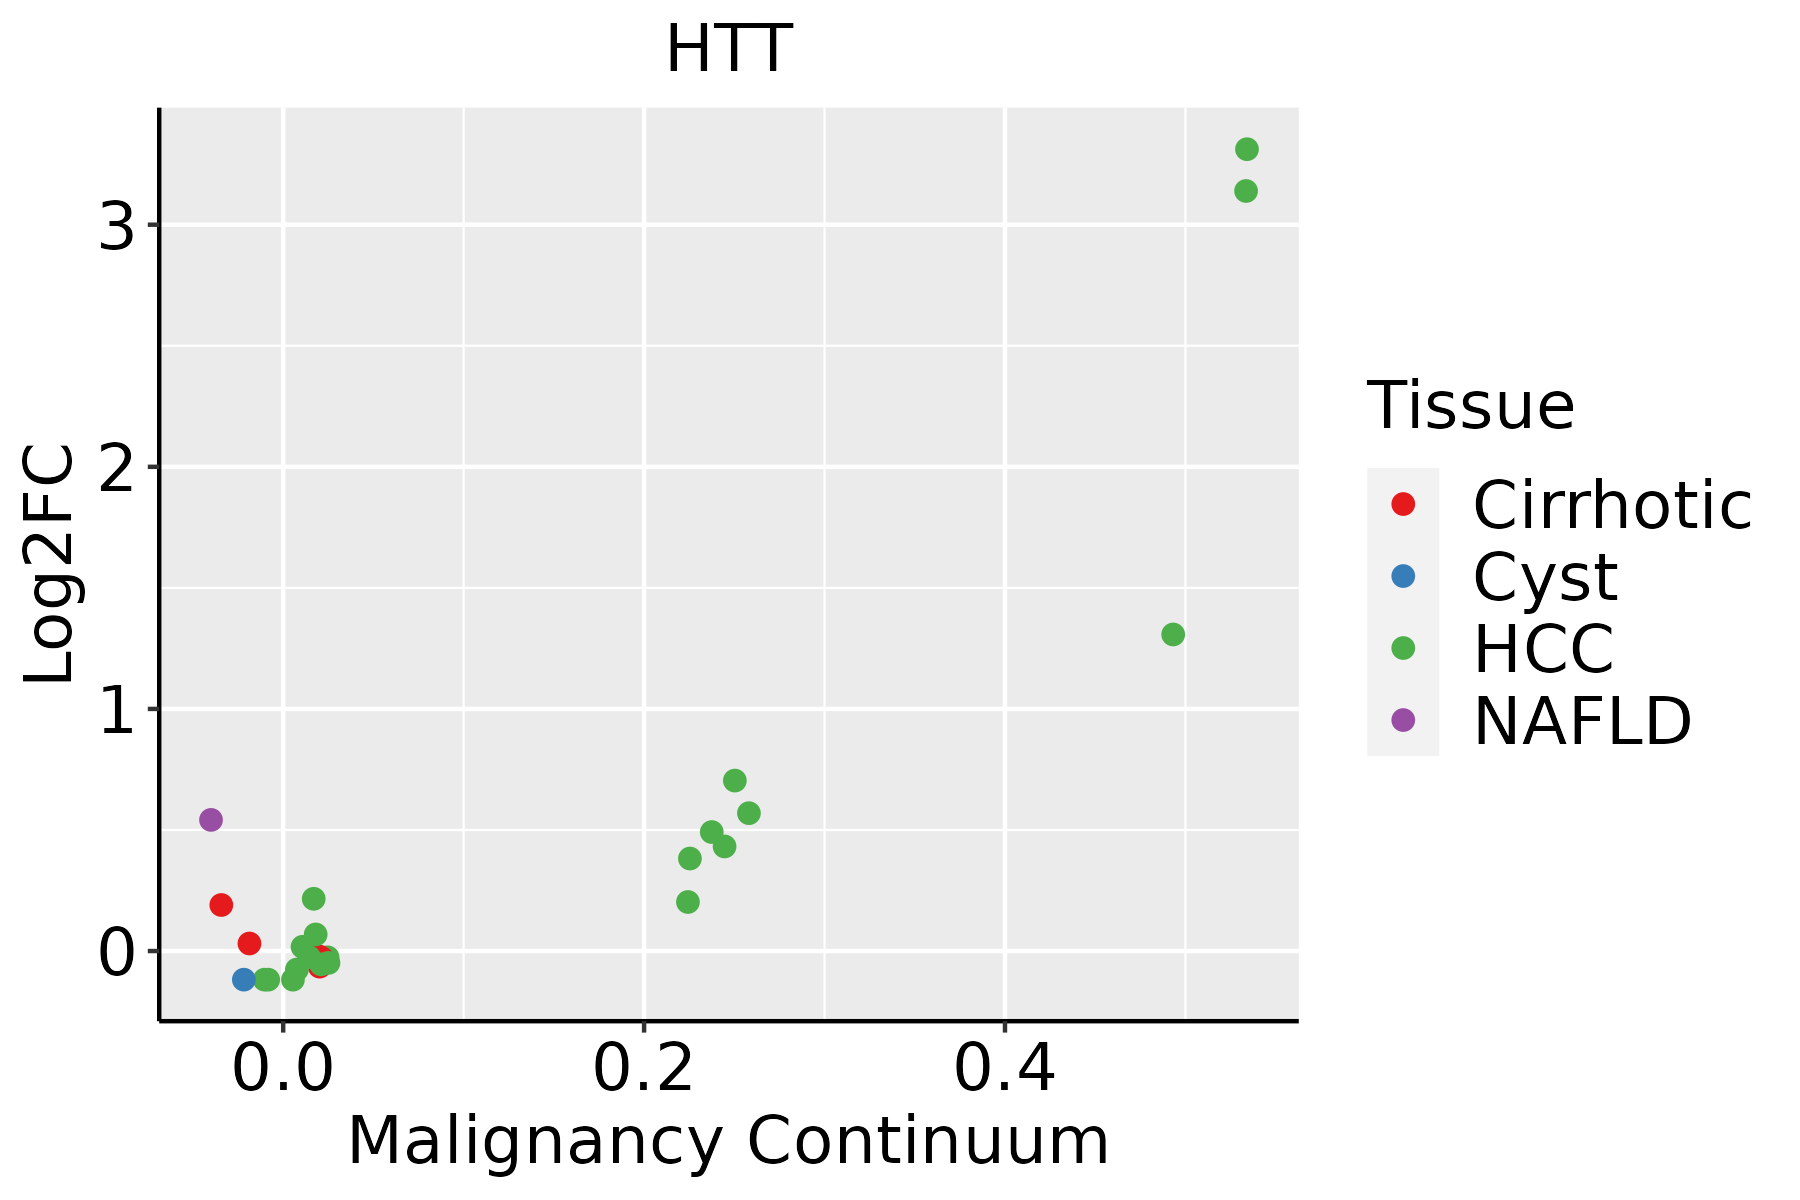 | HCC: Hepatocellular carcinoma |
| NAFLD: Non-alcoholic fatty liver disease | ||
| Oral Cavity | 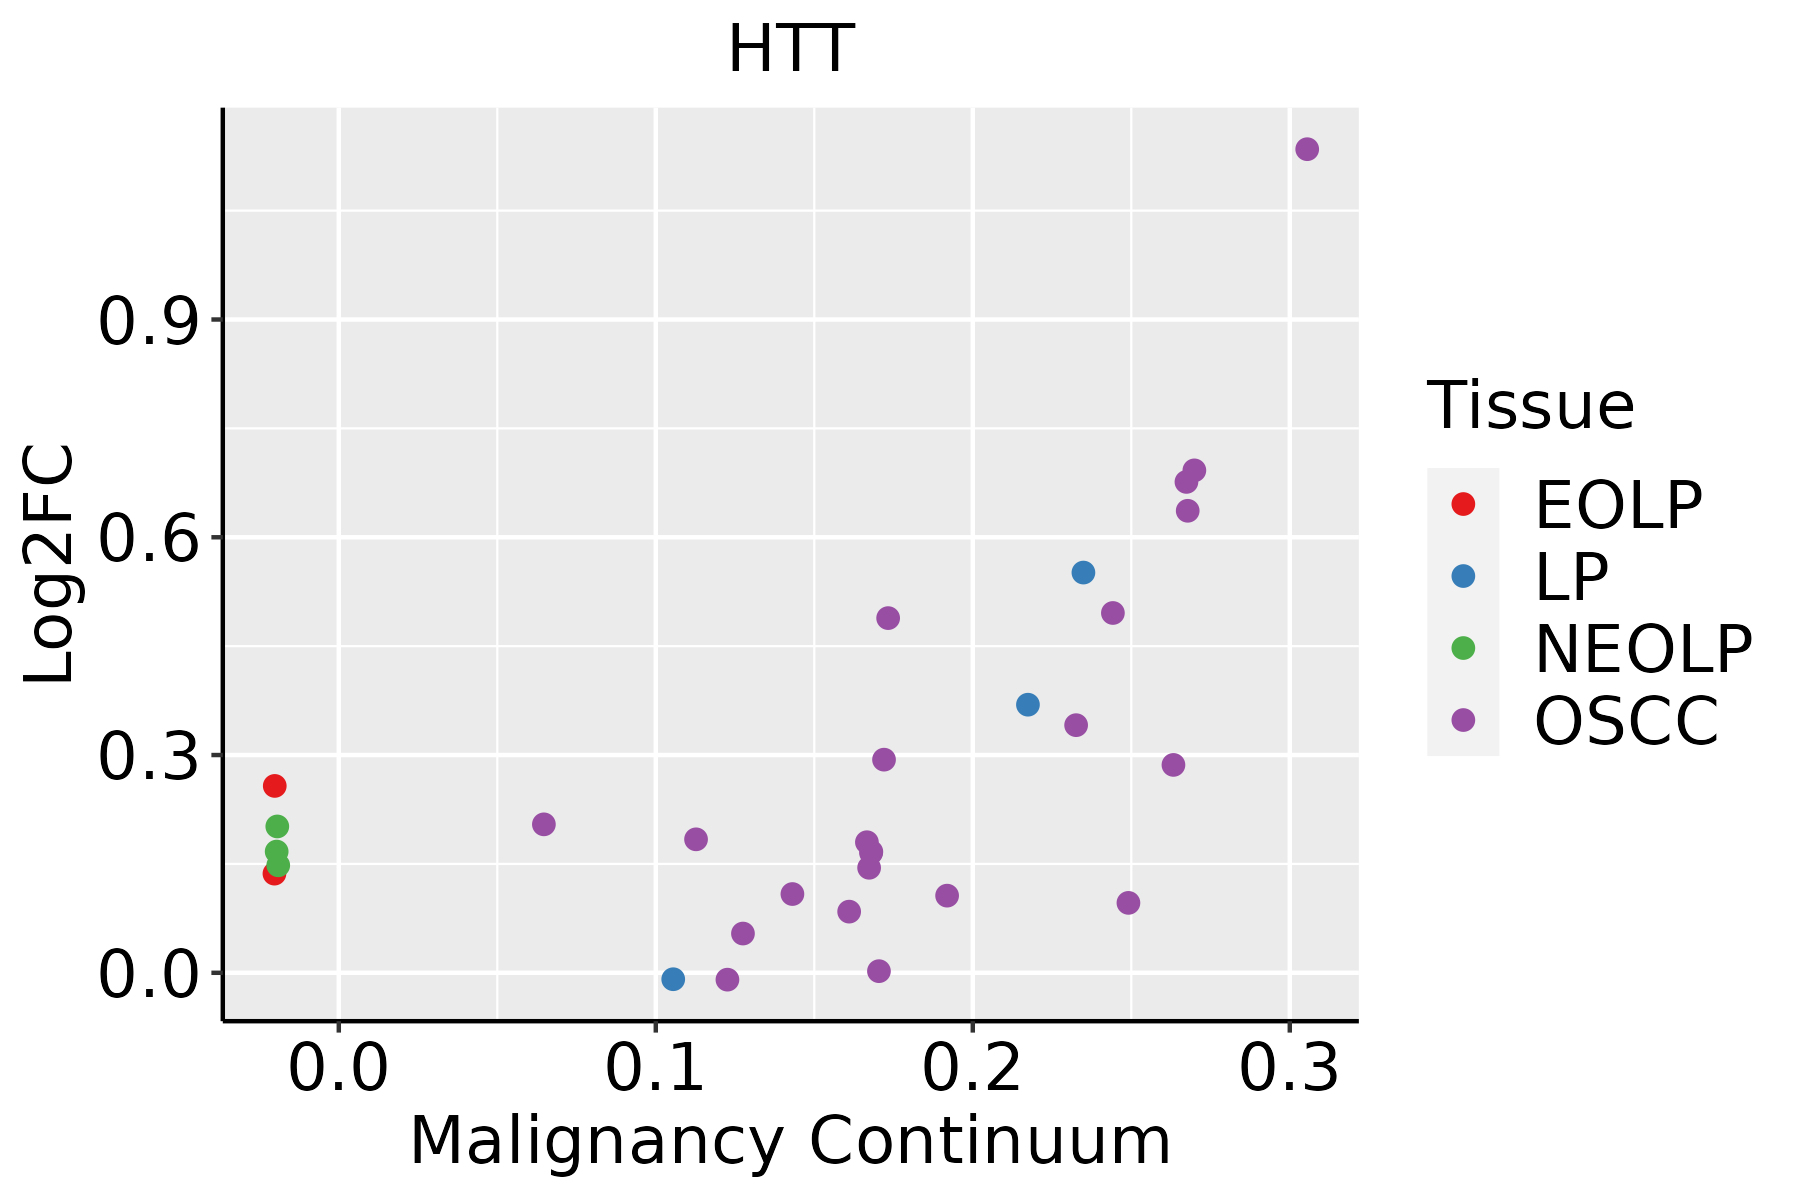 | EOLP: Erosive Oral lichen planus |
| LP: leukoplakia | ||
| NEOLP: Non-erosive oral lichen planus | ||
| OSCC: Oral squamous cell carcinoma | ||
| Thyroid |  | ATC: Anaplastic thyroid cancer |
| HT: Hashimoto's thyroiditis | ||
| PTC: Papillary thyroid cancer |
| ∗log2FC in expression of this searched gene in stem-like cells from each diseased tissue sample relative to stem-like cells in normal samples in each tissue plotted against the malignancy continuum. Samples are colored based on if they are from different disease stage. |
Top |
Malignant transformation related pathway analysis |
| Find out the enriched GO biological processes and KEGG pathways involved in transition from healthy to precancer to cancer |
| Tissue | Disease Stage | Enriched GO biological Processes |
| Colorectum | AD |  |
| Colorectum | SER |  |
| Colorectum | MSS |  |
| Colorectum | MSI-H |  |
| Colorectum | FAP |  |
| ∗Top 15 enriched GO BP terms are showed in the bar plot of each disease state in each tissue. Each row represents a significant GO biological process which is colored according to the -log10(p.adjust). |
| Page: 1 2 3 4 5 6 7 8 9 |
| GO ID | Tissue | Disease Stage | Description | Gene Ratio | Bg Ratio | pvalue | p.adjust | Count |
| GO:0007163111 | Thyroid | PTC | establishment or maintenance of cell polarity | 115/5968 | 218/18723 | 1.15e-10 | 3.90e-09 | 115 |
| GO:0030705111 | Thyroid | PTC | cytoskeleton-dependent intracellular transport | 104/5968 | 195/18723 | 3.87e-10 | 1.24e-08 | 104 |
| GO:005165019 | Thyroid | PTC | establishment of vesicle localization | 89/5968 | 161/18723 | 6.38e-10 | 1.97e-08 | 89 |
| GO:005164817 | Thyroid | PTC | vesicle localization | 94/5968 | 177/18723 | 3.54e-09 | 9.45e-08 | 94 |
| GO:000689019 | Thyroid | PTC | retrograde vesicle-mediated transport, Golgi to endoplasmic reticulum | 37/5968 | 52/18723 | 6.98e-09 | 1.75e-07 | 37 |
| GO:2001236113 | Thyroid | PTC | regulation of extrinsic apoptotic signaling pathway | 82/5968 | 151/18723 | 9.01e-09 | 2.18e-07 | 82 |
| GO:001050810 | Thyroid | PTC | positive regulation of autophagy | 70/5968 | 124/18723 | 1.30e-08 | 3.08e-07 | 70 |
| GO:001082124 | Thyroid | PTC | regulation of mitochondrion organization | 78/5968 | 144/18723 | 2.38e-08 | 5.43e-07 | 78 |
| GO:0071900110 | Thyroid | PTC | regulation of protein serine/threonine kinase activity | 164/5968 | 359/18723 | 2.41e-08 | 5.43e-07 | 164 |
| GO:0051235112 | Thyroid | PTC | maintenance of location | 148/5968 | 327/18723 | 2.30e-07 | 4.07e-06 | 148 |
| GO:00109709 | Thyroid | PTC | transport along microtubule | 80/5968 | 155/18723 | 2.48e-07 | 4.32e-06 | 80 |
| GO:190314616 | Thyroid | PTC | regulation of autophagy of mitochondrion | 25/5968 | 33/18723 | 2.82e-07 | 4.86e-06 | 25 |
| GO:0120032111 | Thyroid | PTC | regulation of plasma membrane bounded cell projection assembly | 92/5968 | 186/18723 | 4.12e-07 | 6.83e-06 | 92 |
| GO:19028509 | Thyroid | PTC | microtubule cytoskeleton organization involved in mitosis | 76/5968 | 147/18723 | 4.49e-07 | 7.38e-06 | 76 |
| GO:003001020 | Thyroid | PTC | establishment of cell polarity | 74/5968 | 143/18723 | 6.05e-07 | 9.63e-06 | 74 |
| GO:006049120 | Thyroid | PTC | regulation of cell projection assembly | 92/5968 | 188/18723 | 7.55e-07 | 1.18e-05 | 92 |
| GO:003530427 | Thyroid | PTC | regulation of protein dephosphorylation | 51/5968 | 90/18723 | 1.01e-06 | 1.50e-05 | 51 |
| GO:000703010 | Thyroid | PTC | Golgi organization | 79/5968 | 157/18723 | 1.11e-06 | 1.64e-05 | 79 |
| GO:003530324 | Thyroid | PTC | regulation of dephosphorylation | 67/5968 | 128/18723 | 1.19e-06 | 1.72e-05 | 67 |
| GO:01200349 | Thyroid | PTC | positive regulation of plasma membrane bounded cell projection assembly | 57/5968 | 105/18723 | 1.60e-06 | 2.25e-05 | 57 |
| Page: 1 2 3 4 5 6 7 8 9 10 11 12 13 14 15 16 17 18 |
| Pathway ID | Tissue | Disease Stage | Description | Gene Ratio | Bg Ratio | pvalue | p.adjust | qvalue | Count |
| hsa05016210 | Esophagus | ESCC | Huntington disease | 226/4205 | 306/8465 | 1.38e-18 | 8.72e-17 | 4.46e-17 | 226 |
| hsa05022210 | Esophagus | ESCC | Pathways of neurodegeneration - multiple diseases | 318/4205 | 476/8465 | 6.10e-15 | 2.04e-13 | 1.05e-13 | 318 |
| hsa0501638 | Esophagus | ESCC | Huntington disease | 226/4205 | 306/8465 | 1.38e-18 | 8.72e-17 | 4.46e-17 | 226 |
| hsa0502238 | Esophagus | ESCC | Pathways of neurodegeneration - multiple diseases | 318/4205 | 476/8465 | 6.10e-15 | 2.04e-13 | 1.05e-13 | 318 |
| hsa0501622 | Liver | HCC | Huntington disease | 219/4020 | 306/8465 | 3.06e-18 | 3.42e-16 | 1.90e-16 | 219 |
| hsa0502222 | Liver | HCC | Pathways of neurodegeneration - multiple diseases | 298/4020 | 476/8465 | 6.59e-12 | 1.30e-10 | 7.22e-11 | 298 |
| hsa0501632 | Liver | HCC | Huntington disease | 219/4020 | 306/8465 | 3.06e-18 | 3.42e-16 | 1.90e-16 | 219 |
| hsa0502232 | Liver | HCC | Pathways of neurodegeneration - multiple diseases | 298/4020 | 476/8465 | 6.59e-12 | 1.30e-10 | 7.22e-11 | 298 |
| hsa0501628 | Oral cavity | OSCC | Huntington disease | 204/3704 | 306/8465 | 1.70e-16 | 7.13e-15 | 3.63e-15 | 204 |
| hsa0502228 | Oral cavity | OSCC | Pathways of neurodegeneration - multiple diseases | 292/3704 | 476/8465 | 1.60e-15 | 4.47e-14 | 2.28e-14 | 292 |
| hsa05016112 | Oral cavity | OSCC | Huntington disease | 204/3704 | 306/8465 | 1.70e-16 | 7.13e-15 | 3.63e-15 | 204 |
| hsa05022112 | Oral cavity | OSCC | Pathways of neurodegeneration - multiple diseases | 292/3704 | 476/8465 | 1.60e-15 | 4.47e-14 | 2.28e-14 | 292 |
| hsa0502245 | Oral cavity | EOLP | Pathways of neurodegeneration - multiple diseases | 110/1218 | 476/8465 | 1.09e-07 | 1.26e-06 | 7.40e-07 | 110 |
| hsa0501645 | Oral cavity | EOLP | Huntington disease | 69/1218 | 306/8465 | 6.32e-05 | 2.96e-04 | 1.75e-04 | 69 |
| hsa0502255 | Oral cavity | EOLP | Pathways of neurodegeneration - multiple diseases | 110/1218 | 476/8465 | 1.09e-07 | 1.26e-06 | 7.40e-07 | 110 |
| hsa0501655 | Oral cavity | EOLP | Huntington disease | 69/1218 | 306/8465 | 6.32e-05 | 2.96e-04 | 1.75e-04 | 69 |
| Page: 1 |
Top |
Cell-cell communication analysis |
| Identification of potential cell-cell interactions between two cell types and their ligand-receptor pairs for different disease states |
| Ligand | Receptor | LRpair | Pathway | Tissue | Disease Stage |
| Page: 1 |
Top |
Single-cell gene regulatory network inference analysis |
| Find out the significant the regulons (TFs) and the target genes of each regulon across cell types for different disease states |
| TF | Cell Type | Tissue | Disease Stage | Target Gene | RSS | Regulon Activity |
| ∗The dot plots of a searched regulon are shown for all cell subpopulations in each disease state of each tissue based on the regulon specific score inferred using pySCENIC and by calculating the average expression. |
| Page: 1 |
Top |
Somatic mutation of malignant transformation related genes |
| Annotation of somatic variants for genes involved in malignant transformation |
| Hugo Symbol | Variant Class | Variant Classification | dbSNP RS | HGVSc | HGVSp | HGVSp Short | SWISSPROT | BIOTYPE | SIFT | PolyPhen | Tumor Sample Barcode | Tissue | Histology | Sex | Age | Stage | Therapy Types | Drugs | Outcome |
| HTT | SNV | Missense_Mutation | novel | c.6190N>G | p.Leu2064Val | p.L2064V | P42858 | protein_coding | tolerated(0.12) | benign(0.058) | TCGA-5L-AAT1-01 | Breast | breast invasive carcinoma | Female | <65 | III/IV | Hormone Therapy | letrozol | SD |
| HTT | SNV | Missense_Mutation | c.7393N>A | p.Glu2465Lys | p.E2465K | P42858 | protein_coding | deleterious(0) | probably_damaging(0.987) | TCGA-A2-A04W-01 | Breast | breast invasive carcinoma | Female | <65 | I/II | Chemotherapy | cytoxan | SD | |
| HTT | SNV | Missense_Mutation | rs776464028 | c.4827N>C | p.Gln1609His | p.Q1609H | P42858 | protein_coding | deleterious(0) | possibly_damaging(0.781) | TCGA-A2-A0EY-01 | Breast | breast invasive carcinoma | Female | <65 | I/II | Chemotherapy | adriamycin | SD |
| HTT | SNV | Missense_Mutation | novel | c.5353C>A | p.His1785Asn | p.H1785N | P42858 | protein_coding | deleterious(0) | probably_damaging(0.977) | TCGA-A7-A6VY-01 | Breast | breast invasive carcinoma | Female | <65 | I/II | Chemotherapy | cyclophosphamide | CR |
| HTT | SNV | Missense_Mutation | c.2023N>A | p.Asp675Asn | p.D675N | P42858 | protein_coding | deleterious(0) | probably_damaging(0.995) | TCGA-AC-A23H-01 | Breast | breast invasive carcinoma | Female | >=65 | I/II | Unknown | Unknown | PD | |
| HTT | SNV | Missense_Mutation | c.6970N>A | p.Glu2324Lys | p.E2324K | P42858 | protein_coding | deleterious(0.03) | benign(0.003) | TCGA-AC-A2B8-01 | Breast | breast invasive carcinoma | Female | >=65 | I/II | Chemotherapy | chemo | PD | |
| HTT | SNV | Missense_Mutation | novel | c.5213N>C | p.Glu1738Ala | p.E1738A | P42858 | protein_coding | deleterious(0.01) | benign(0.226) | TCGA-AC-A62V-01 | Breast | breast invasive carcinoma | Male | <65 | III/IV | Targeted Molecular therapy | denosumab | PD |
| HTT | SNV | Missense_Mutation | novel | c.5776N>C | p.Asp1926His | p.D1926H | P42858 | protein_coding | deleterious(0) | probably_damaging(0.947) | TCGA-AO-A0JC-01 | Breast | breast invasive carcinoma | Female | <65 | I/II | Chemotherapy | fluorouracil | SD |
| HTT | SNV | Missense_Mutation | rs758872041 | c.5263N>G | p.Ile1755Val | p.I1755V | P42858 | protein_coding | tolerated(0.09) | probably_damaging(0.919) | TCGA-C8-A132-01 | Breast | breast invasive carcinoma | Female | <65 | I/II | Unknown | Unknown | SD |
| HTT | SNV | Missense_Mutation | rs41264725 | c.3205N>G | p.Met1069Val | p.M1069V | P42858 | protein_coding | tolerated(0.33) | benign(0) | TCGA-C8-A8HP-01 | Breast | breast invasive carcinoma | Female | <65 | III/IV | Chemotherapy | 5-fluorouracil | CR |
| Page: 1 2 3 4 5 6 7 8 9 10 11 12 13 14 15 16 17 18 19 20 21 22 23 24 25 26 27 28 29 |
Top |
Related drugs of malignant transformation related genes |
| Identification of chemicals and drugs interact with genes involved in malignant transfromation |
| (DGIdb 4.0) |
| Entrez ID | Symbol | Category | Interaction Types | Drug Claim Name | Drug Name | PMIDs |
| 3064 | HTT | DRUGGABLE GENOME | CUDC-907 | FIMEPINOSTAT | ||
| 3064 | HTT | DRUGGABLE GENOME | GNF-PF-4659 | CHEMBL584442 | ||
| 3064 | HTT | DRUGGABLE GENOME | PMID27376512-Compound-PG-11047 | |||
| 3064 | HTT | DRUGGABLE GENOME | GNF-PF-1852 | CHEMBL533293 | ||
| 3064 | HTT | DRUGGABLE GENOME | GNF-PF-67 | CHEMBL578512 | ||
| 3064 | HTT | DRUGGABLE GENOME | GNF-PF-2947 | CHEMBL581677 | ||
| 3064 | HTT | DRUGGABLE GENOME | GNF-PF-2356 | CHEMBL601547 | ||
| 3064 | HTT | DRUGGABLE GENOME | CID 94381 | CHEMBL374632 | ||
| 3064 | HTT | DRUGGABLE GENOME | FLUORESCEIN DIACETATE | FLUORESCEIN DIACETATE | ||
| 3064 | HTT | DRUGGABLE GENOME | TCMDC-124573 | CHEMBL525826 |
| Page: 1 2 3 4 5 6 7 8 9 10 11 12 13 14 15 16 17 18 19 20 21 22 23 |

Copyright 2023-Present -The University of Texas Health Science Center at Houston |