
|
|||||
|
 | |
| |
| |
| |
| |
| |
|
Gene: HLA-DRB5 |
Gene summary for HLA-DRB5 |
| Gene information | Species | Human | Gene symbol | HLA-DRB5 | Gene ID | 3127 |
| Gene name | major histocompatibility complex, class II, DR beta 5 | |
| Gene Alias | HLA-DRB5* | |
| Cytomap | 6p21.32 | |
| Gene Type | protein-coding | GO ID | GO:0001775 | UniProtAcc | Q30154 |
Top |
Malignant transformation analysis |
| Identification of the aberrant gene expression in precancerous and cancerous lesions by comparing the gene expression of stem-like cells in diseased tissues with normal stem cells |
| Entrez ID | Symbol | Replicates | Species | Organ | Tissue | Adj P-value | Log2FC | Malignancy |
| 3127 | HLA-DRB5 | GSM4909282 | Human | Breast | IDC | 5.86e-03 | 1.25e-01 | -0.0288 |
| 3127 | HLA-DRB5 | GSM4909293 | Human | Breast | IDC | 5.53e-28 | 5.35e-01 | 0.1581 |
| 3127 | HLA-DRB5 | GSM4909300 | Human | Breast | IDC | 5.59e-15 | 6.64e-01 | 0.0334 |
| 3127 | HLA-DRB5 | GSM4909317 | Human | Breast | IDC | 1.19e-02 | 1.83e-01 | 0.1355 |
| 3127 | HLA-DRB5 | GSM4909319 | Human | Breast | IDC | 3.07e-03 | 2.24e-01 | 0.1563 |
| 3127 | HLA-DRB5 | M1 | Human | Breast | IDC | 5.19e-06 | 2.67e-01 | 0.1577 |
| 3127 | HLA-DRB5 | M2 | Human | Breast | IDC | 8.33e-06 | 6.44e-01 | 0.21 |
| 3127 | HLA-DRB5 | NCCBC11 | Human | Breast | DCIS | 9.38e-04 | 6.10e-01 | 0.1232 |
| 3127 | HLA-DRB5 | NCCBC3 | Human | Breast | DCIS | 4.28e-36 | 9.20e-01 | 0.1198 |
| 3127 | HLA-DRB5 | NCCBC5 | Human | Breast | DCIS | 4.66e-13 | 6.63e-01 | 0.2046 |
| 3127 | HLA-DRB5 | P2 | Human | Breast | IDC | 6.85e-15 | 7.45e-01 | 0.21 |
| 3127 | HLA-DRB5 | CA_HPV_1 | Human | Cervix | CC | 3.68e-23 | -7.82e-01 | 0.0264 |
| 3127 | HLA-DRB5 | CA_HPV_2 | Human | Cervix | CC | 2.54e-21 | -7.98e-01 | 0.0391 |
| 3127 | HLA-DRB5 | CA_HPV_3 | Human | Cervix | CC | 1.43e-22 | -7.93e-01 | 0.0414 |
| 3127 | HLA-DRB5 | HSIL_HPV_2 | Human | Cervix | HSIL_HPV | 1.66e-08 | -3.76e-01 | 0.0208 |
| 3127 | HLA-DRB5 | N_HPV_1 | Human | Cervix | N_HPV | 2.35e-21 | -7.60e-01 | 0.0079 |
| 3127 | HLA-DRB5 | N_HPV_2 | Human | Cervix | N_HPV | 2.56e-18 | -7.12e-01 | -0.0131 |
| 3127 | HLA-DRB5 | CCI_1 | Human | Cervix | CC | 4.28e-09 | -8.58e-01 | 0.528 |
| 3127 | HLA-DRB5 | CCI_2 | Human | Cervix | CC | 2.64e-08 | -8.58e-01 | 0.5249 |
| 3127 | HLA-DRB5 | CCI_3 | Human | Cervix | CC | 1.02e-04 | -7.08e-01 | 0.516 |
| Page: 1 2 3 4 5 6 7 8 |
| Tissue | Expression Dynamics | Abbreviation |
| Breast | 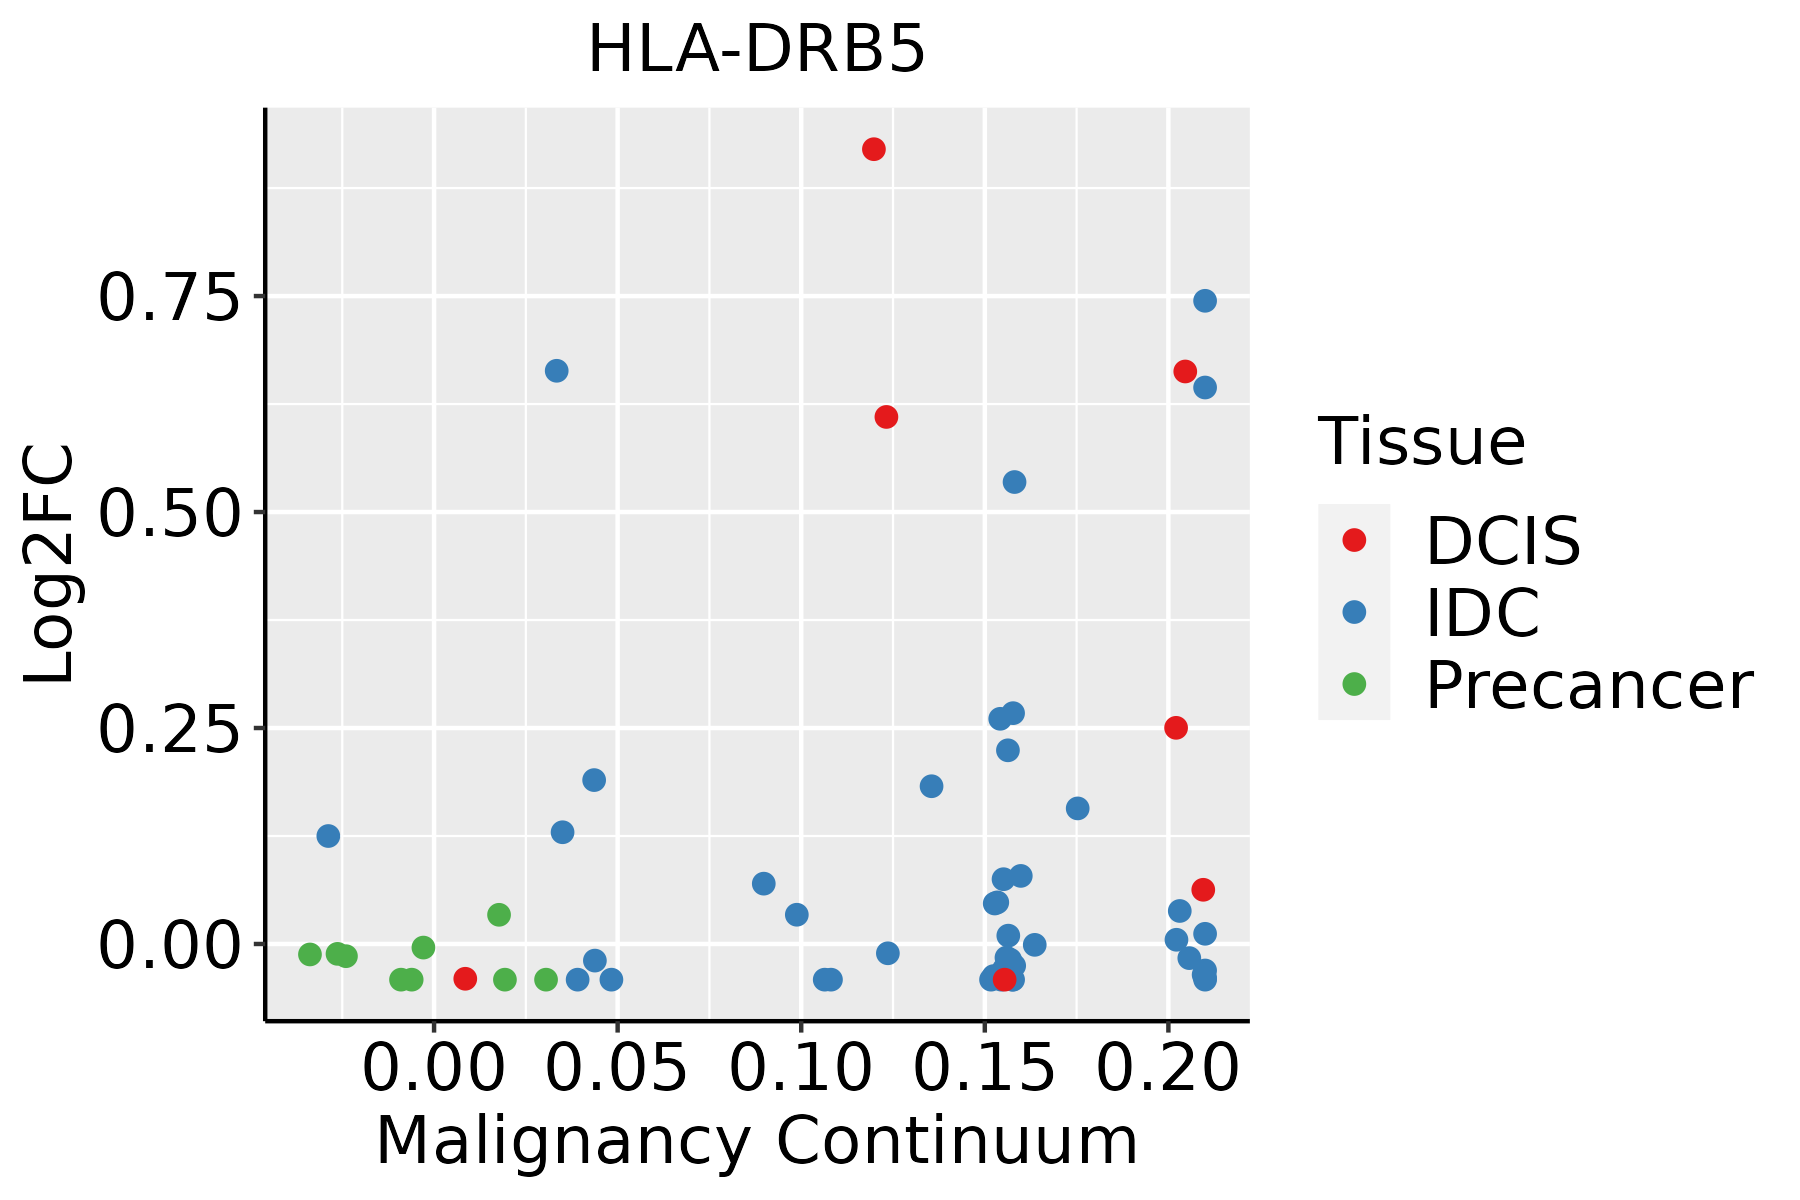 | IDC: Invasive ductal carcinoma |
| DCIS: Ductal carcinoma in situ | ||
| Precancer(BRCA1-mut): Precancerous lesion from BRCA1 mutation carriers | ||
| Cervix | 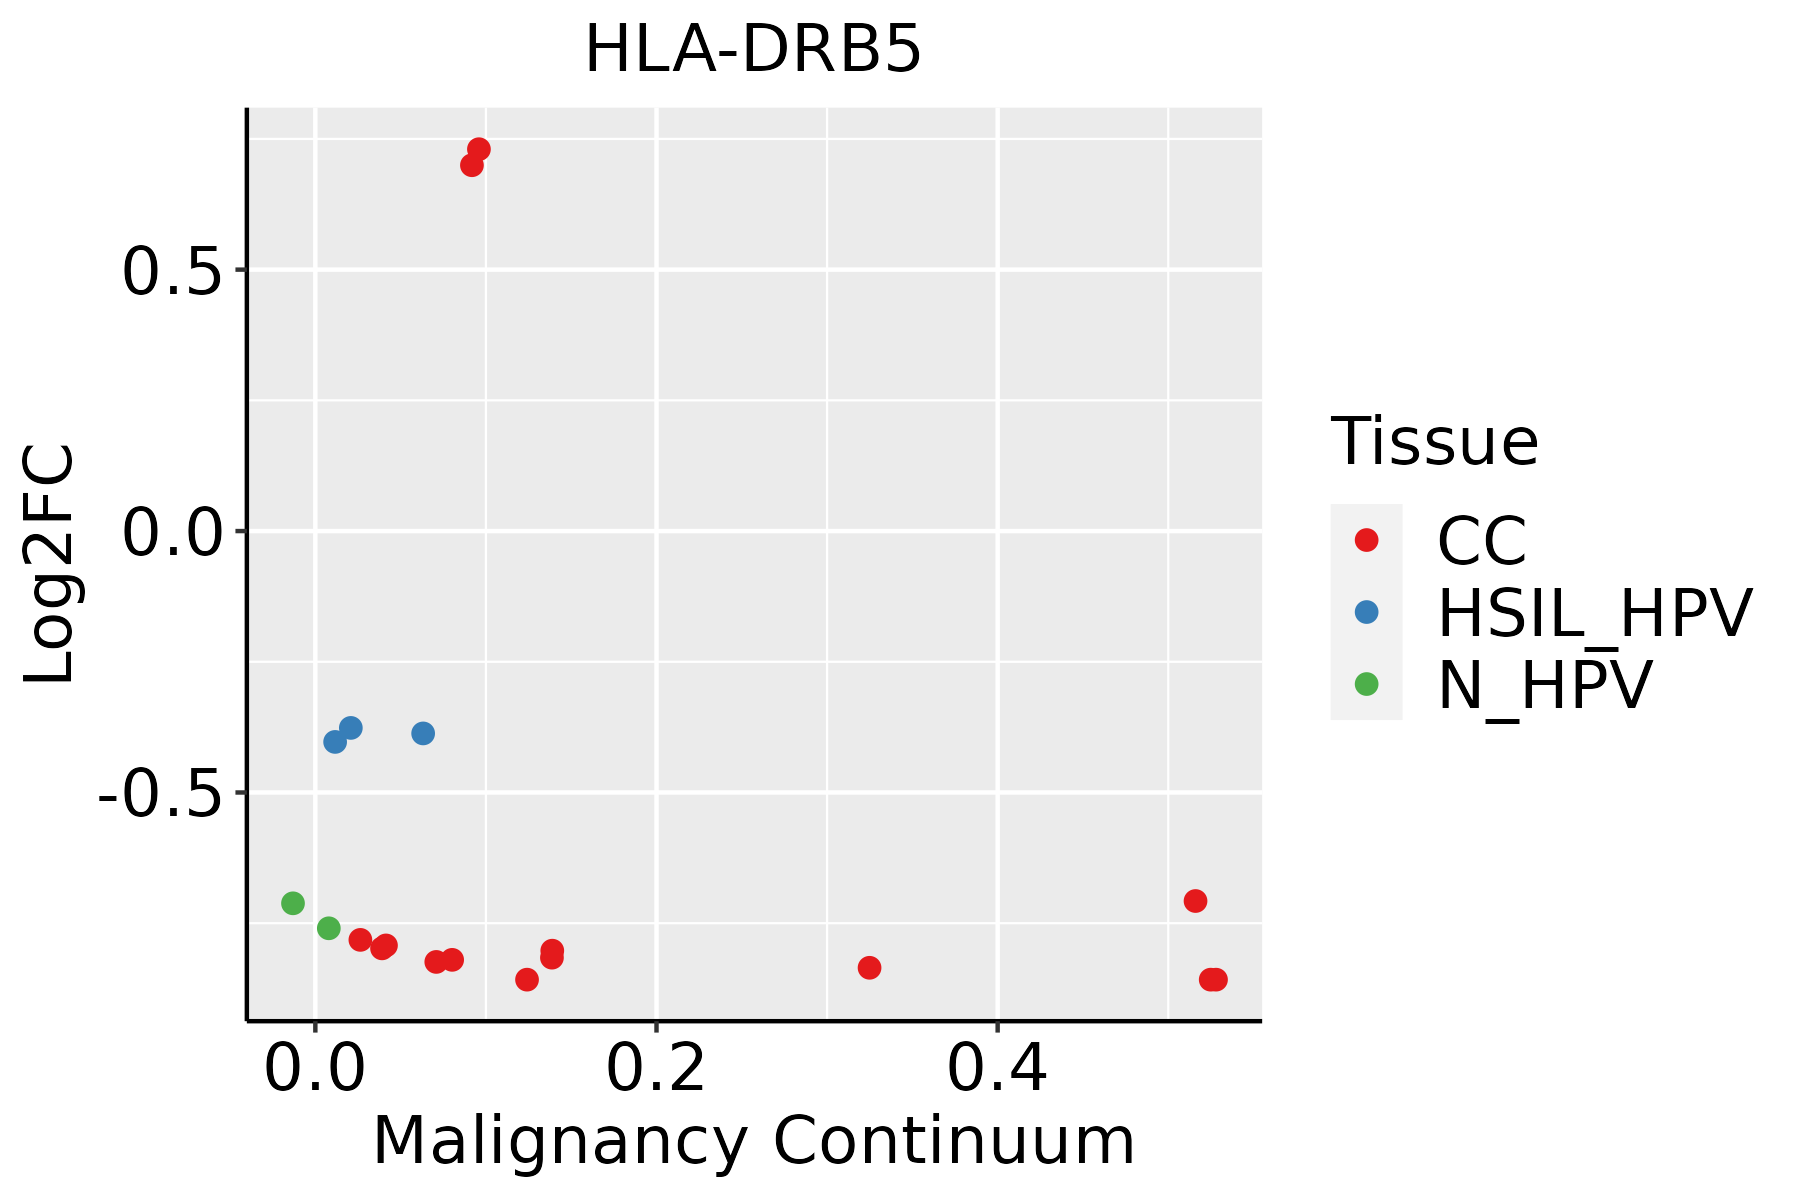 | CC: Cervix cancer |
| HSIL_HPV: HPV-infected high-grade squamous intraepithelial lesions | ||
| N_HPV: HPV-infected normal cervix | ||
| Endometrium | 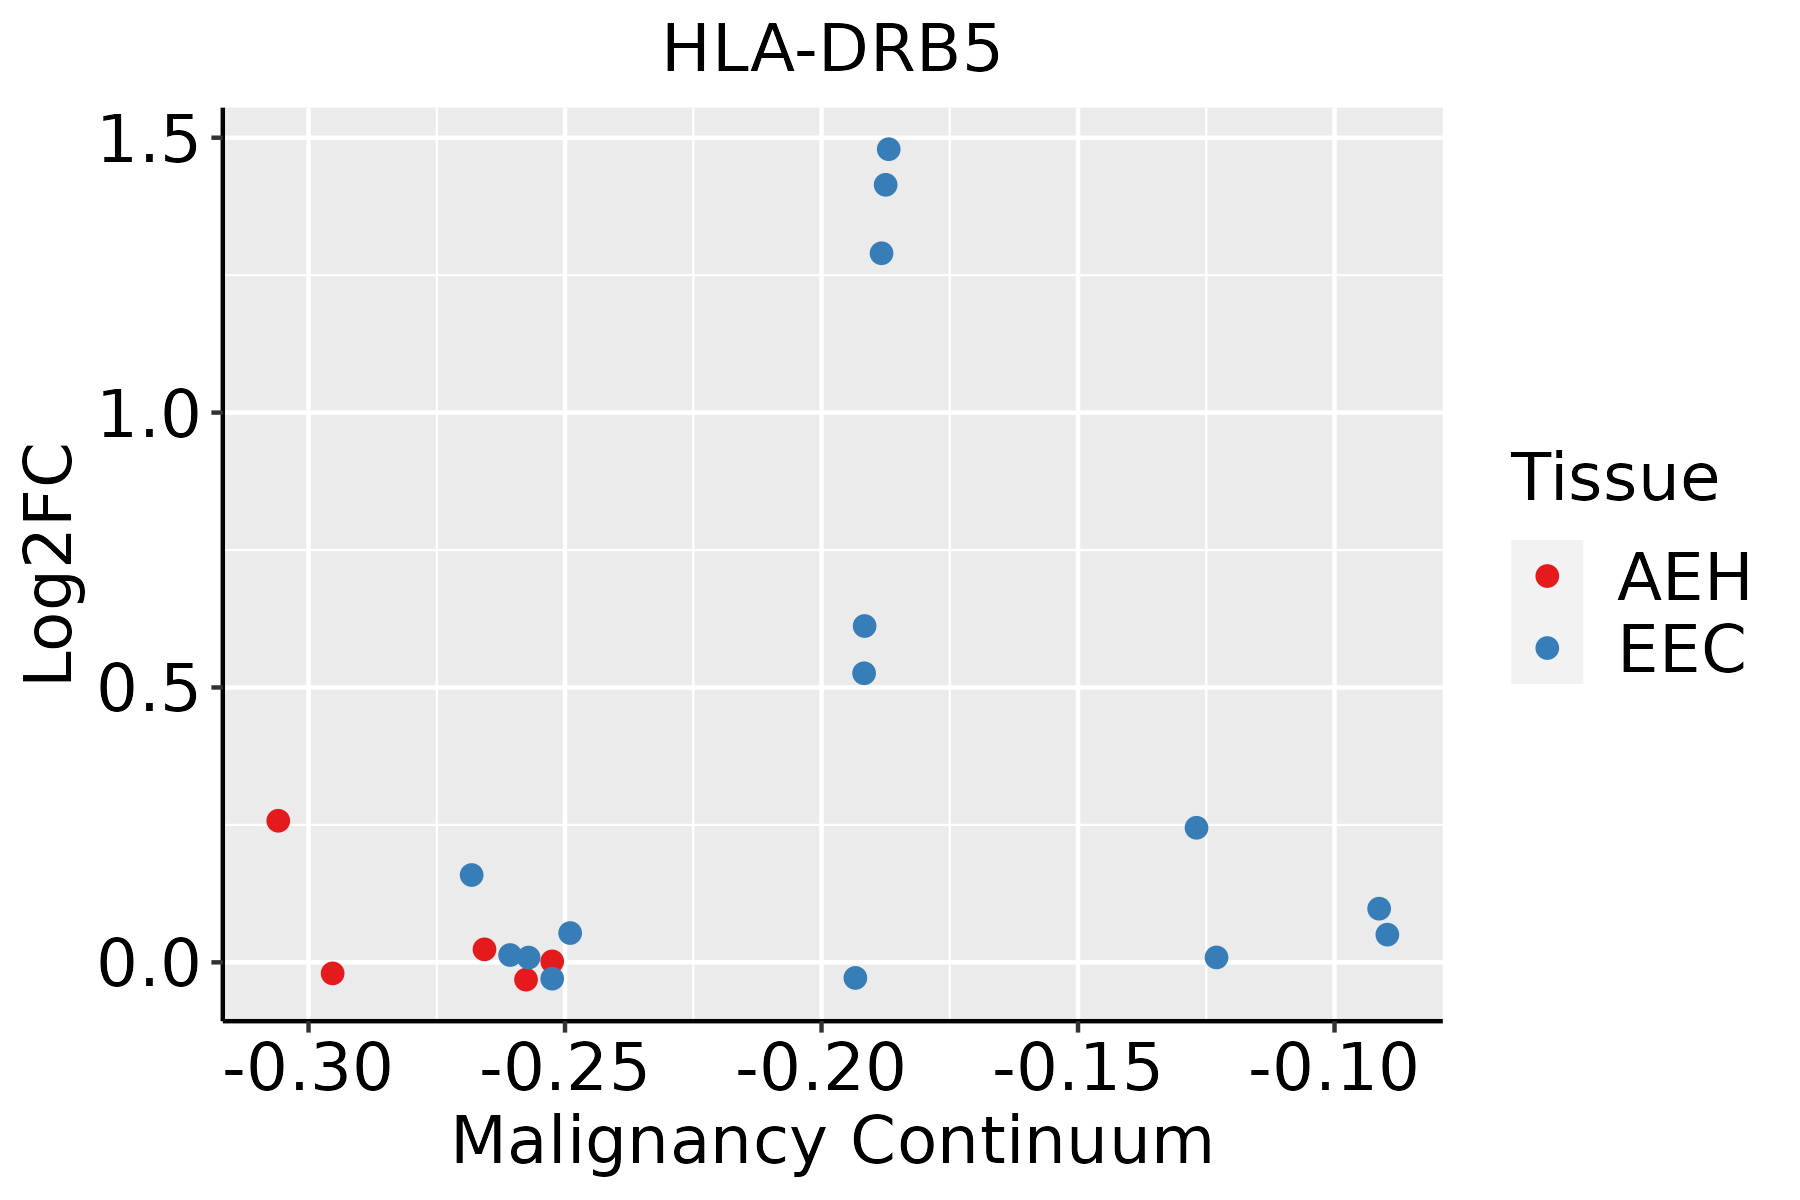 | AEH: Atypical endometrial hyperplasia |
| EEC: Endometrioid Cancer | ||
| Esophagus | 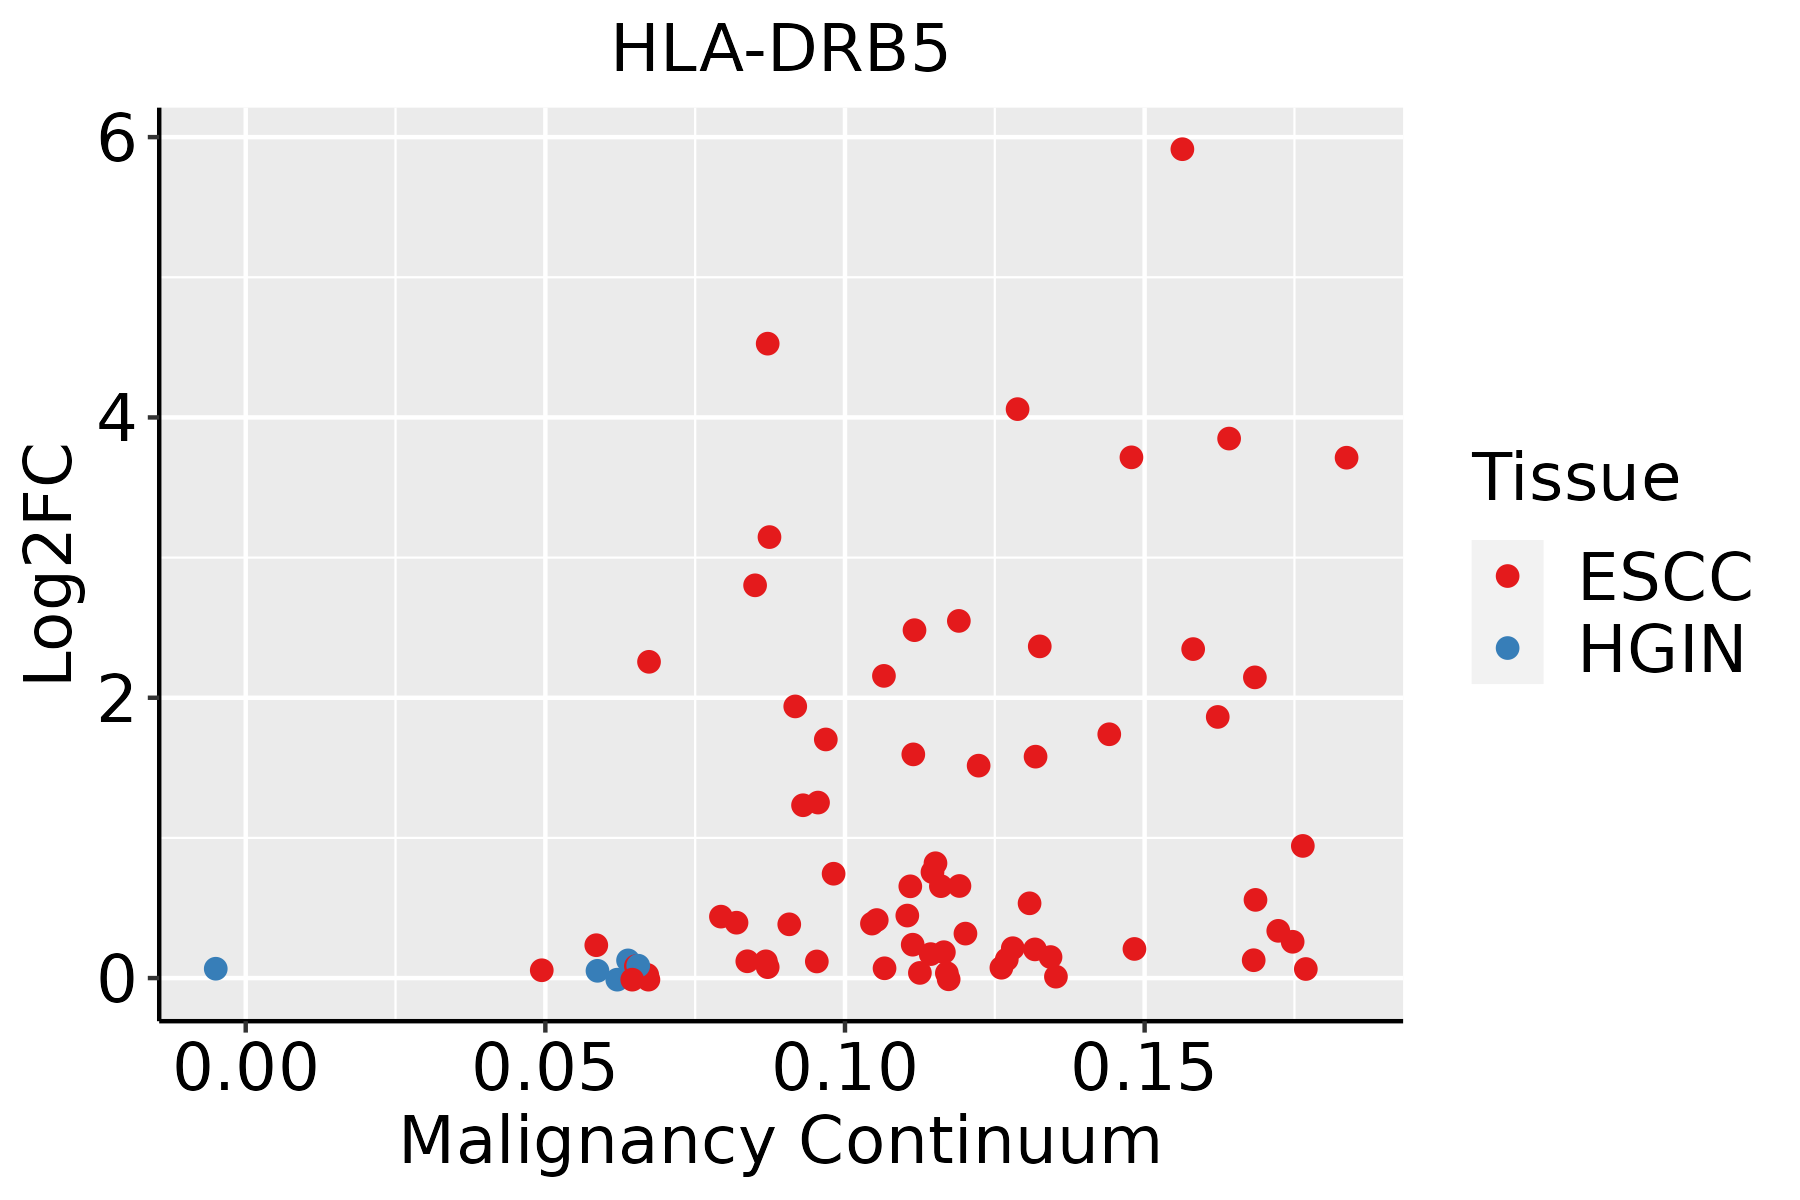 | ESCC: Esophageal squamous cell carcinoma |
| HGIN: High-grade intraepithelial neoplasias | ||
| LGIN: Low-grade intraepithelial neoplasias | ||
| GC |  | CAG: Chronic atrophic gastritis |
| CAG with IM: Chronic atrophic gastritis with intestinal metaplasia | ||
| CSG: Chronic superficial gastritis | ||
| GC: Gastric cancer | ||
| SIM: Severe intestinal metaplasia | ||
| WIM: Wild intestinal metaplasia | ||
| Liver | 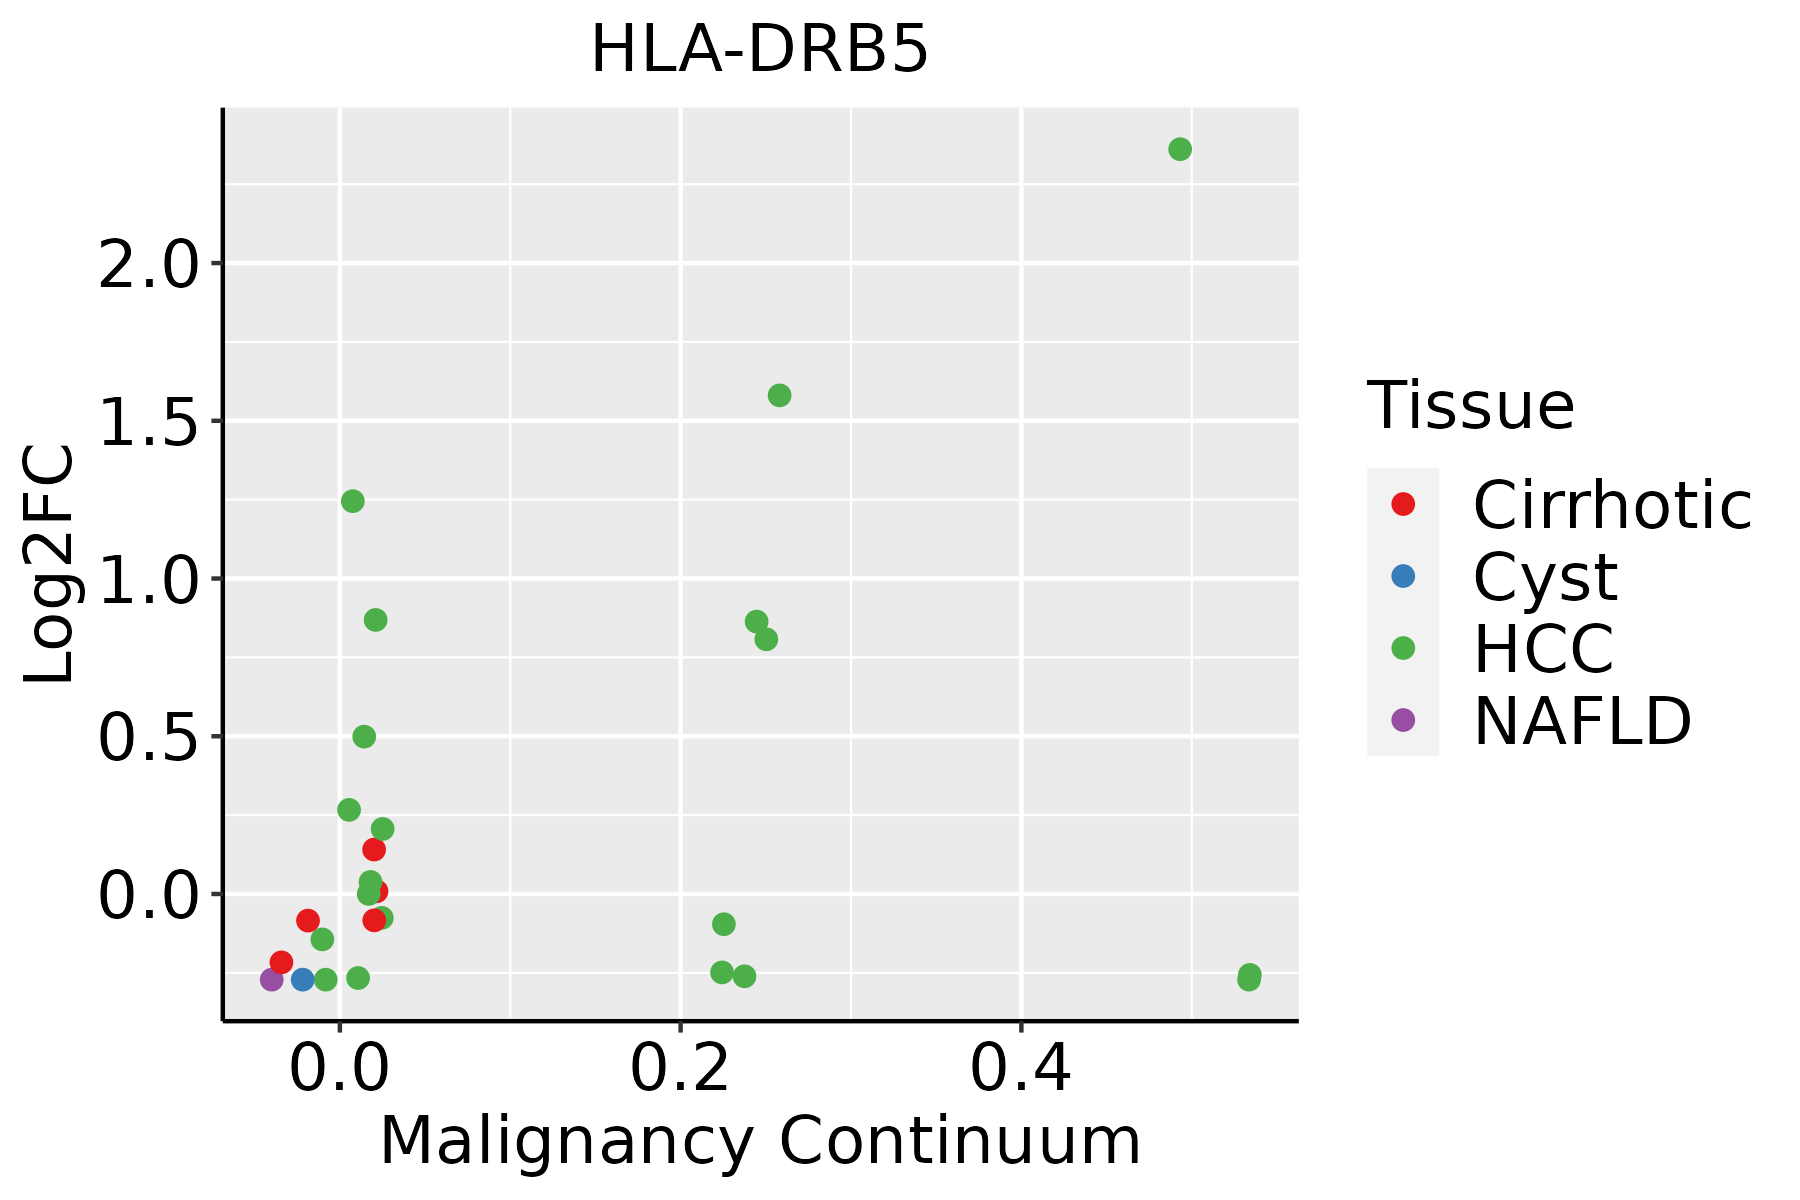 | HCC: Hepatocellular carcinoma |
| NAFLD: Non-alcoholic fatty liver disease | ||
| Lung | 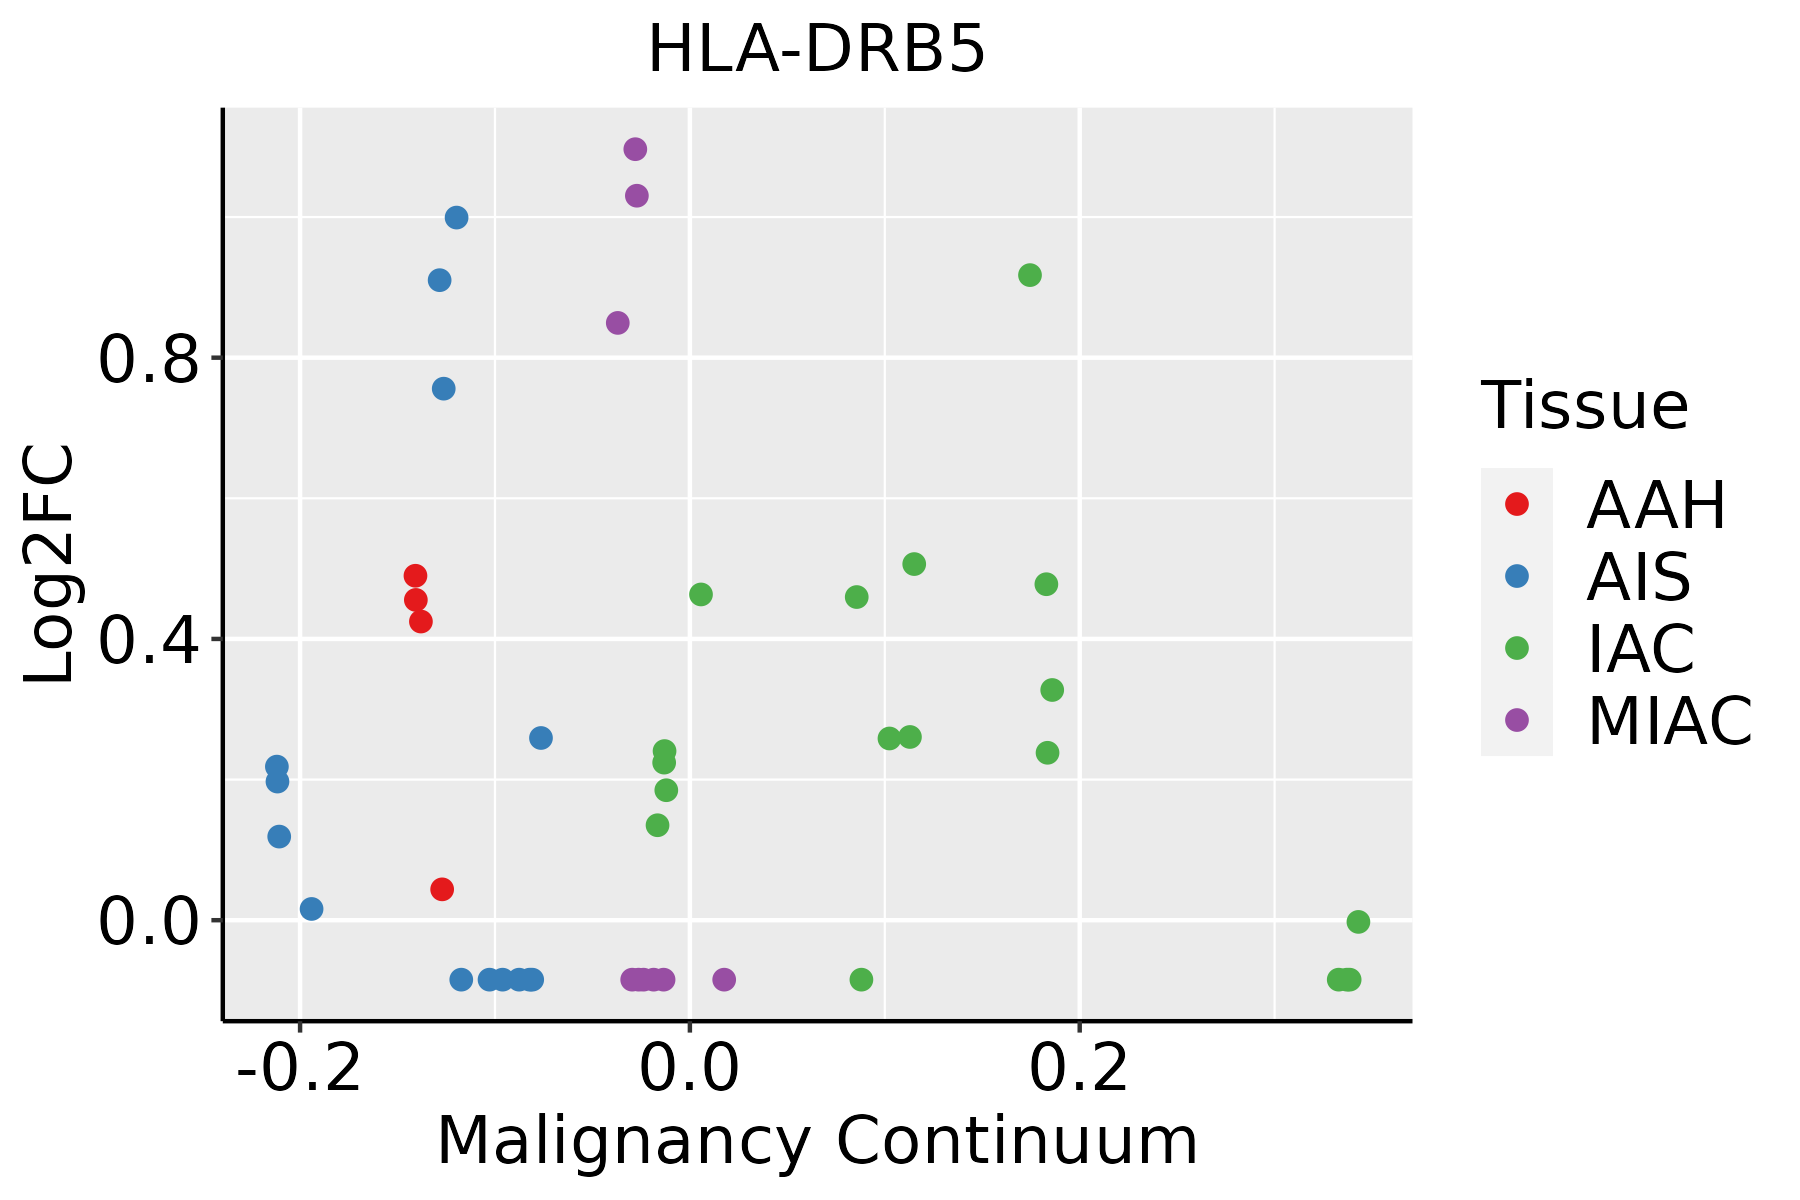 | AAH: Atypical adenomatous hyperplasia |
| AIS: Adenocarcinoma in situ | ||
| IAC: Invasive lung adenocarcinoma | ||
| MIA: Minimally invasive adenocarcinoma | ||
| Oral Cavity | 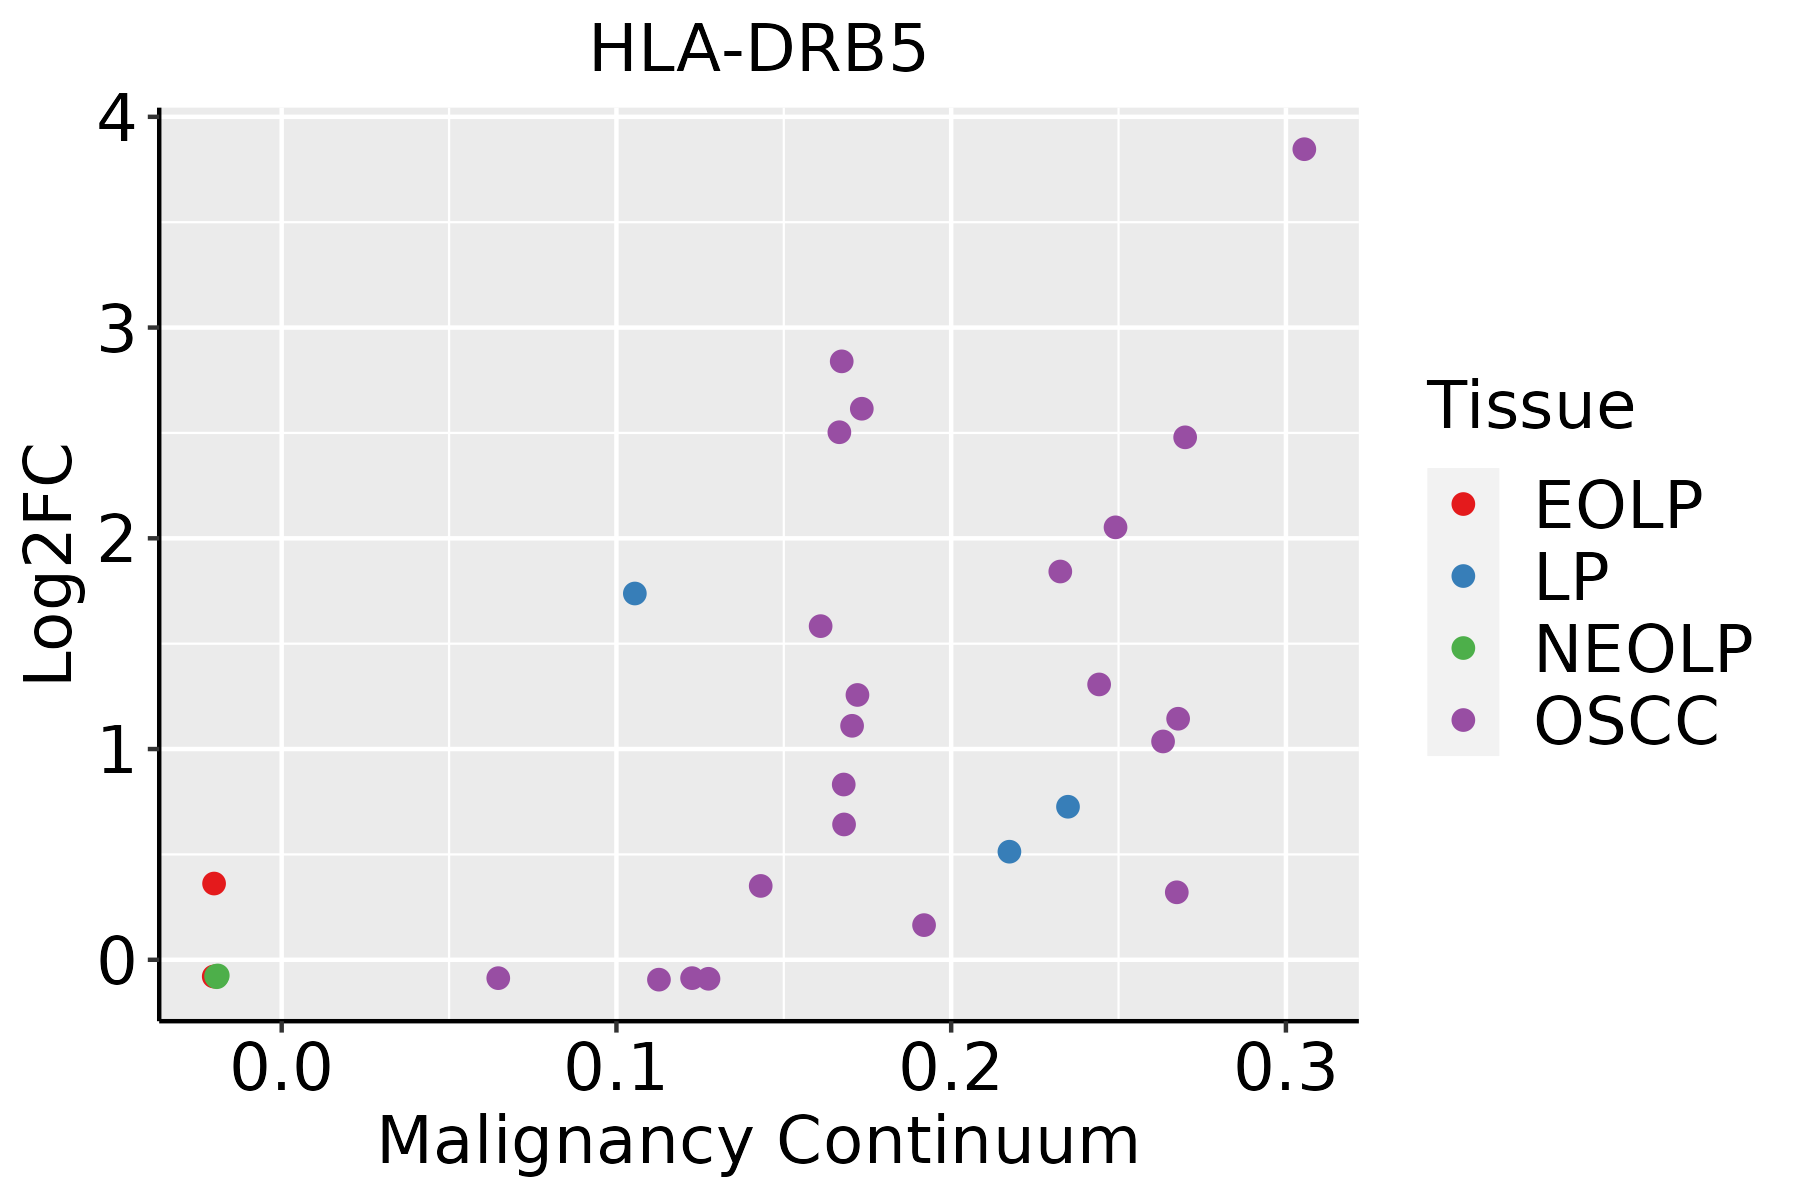 | EOLP: Erosive Oral lichen planus |
| LP: leukoplakia | ||
| NEOLP: Non-erosive oral lichen planus | ||
| OSCC: Oral squamous cell carcinoma | ||
| Skin | 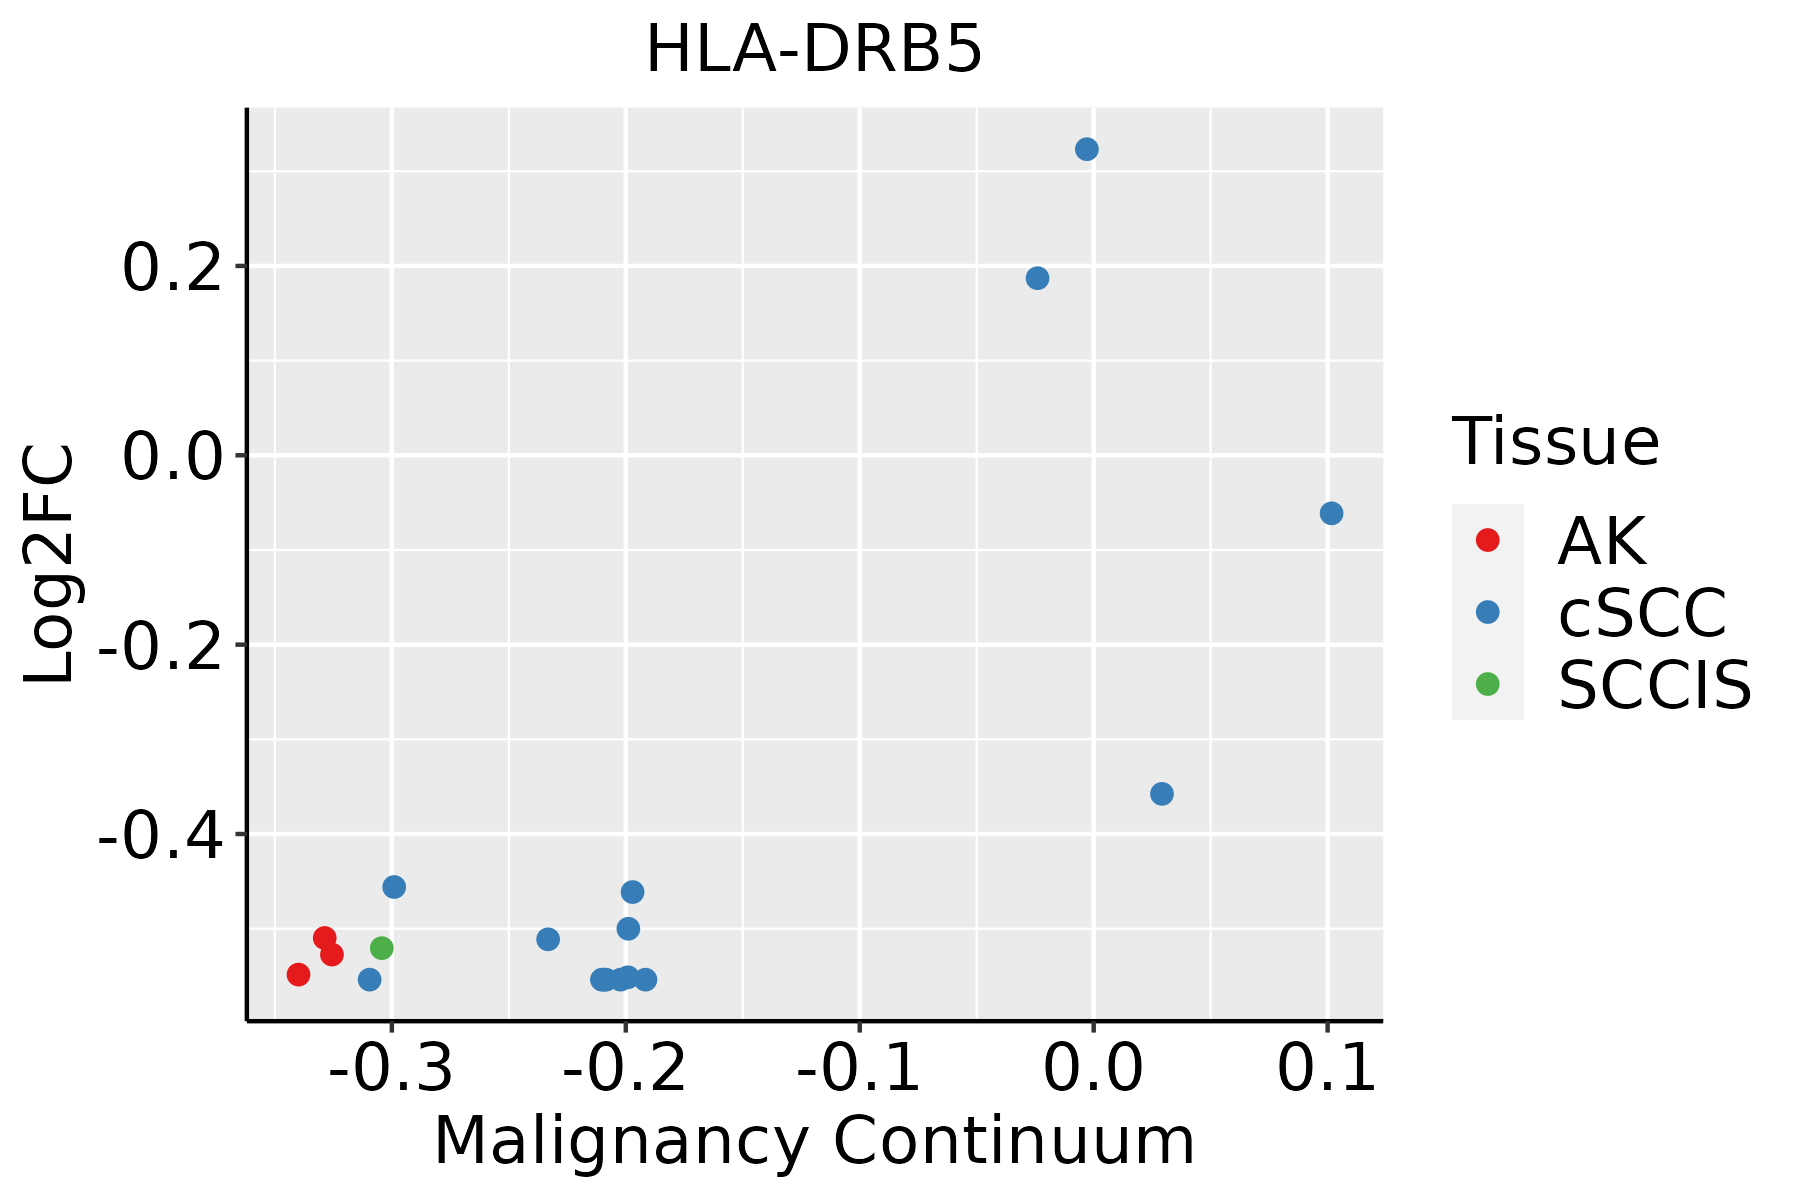 | AK: Actinic keratosis |
| cSCC: Cutaneous squamous cell carcinoma | ||
| SCCIS:squamous cell carcinoma in situ | ||
| Thyroid | 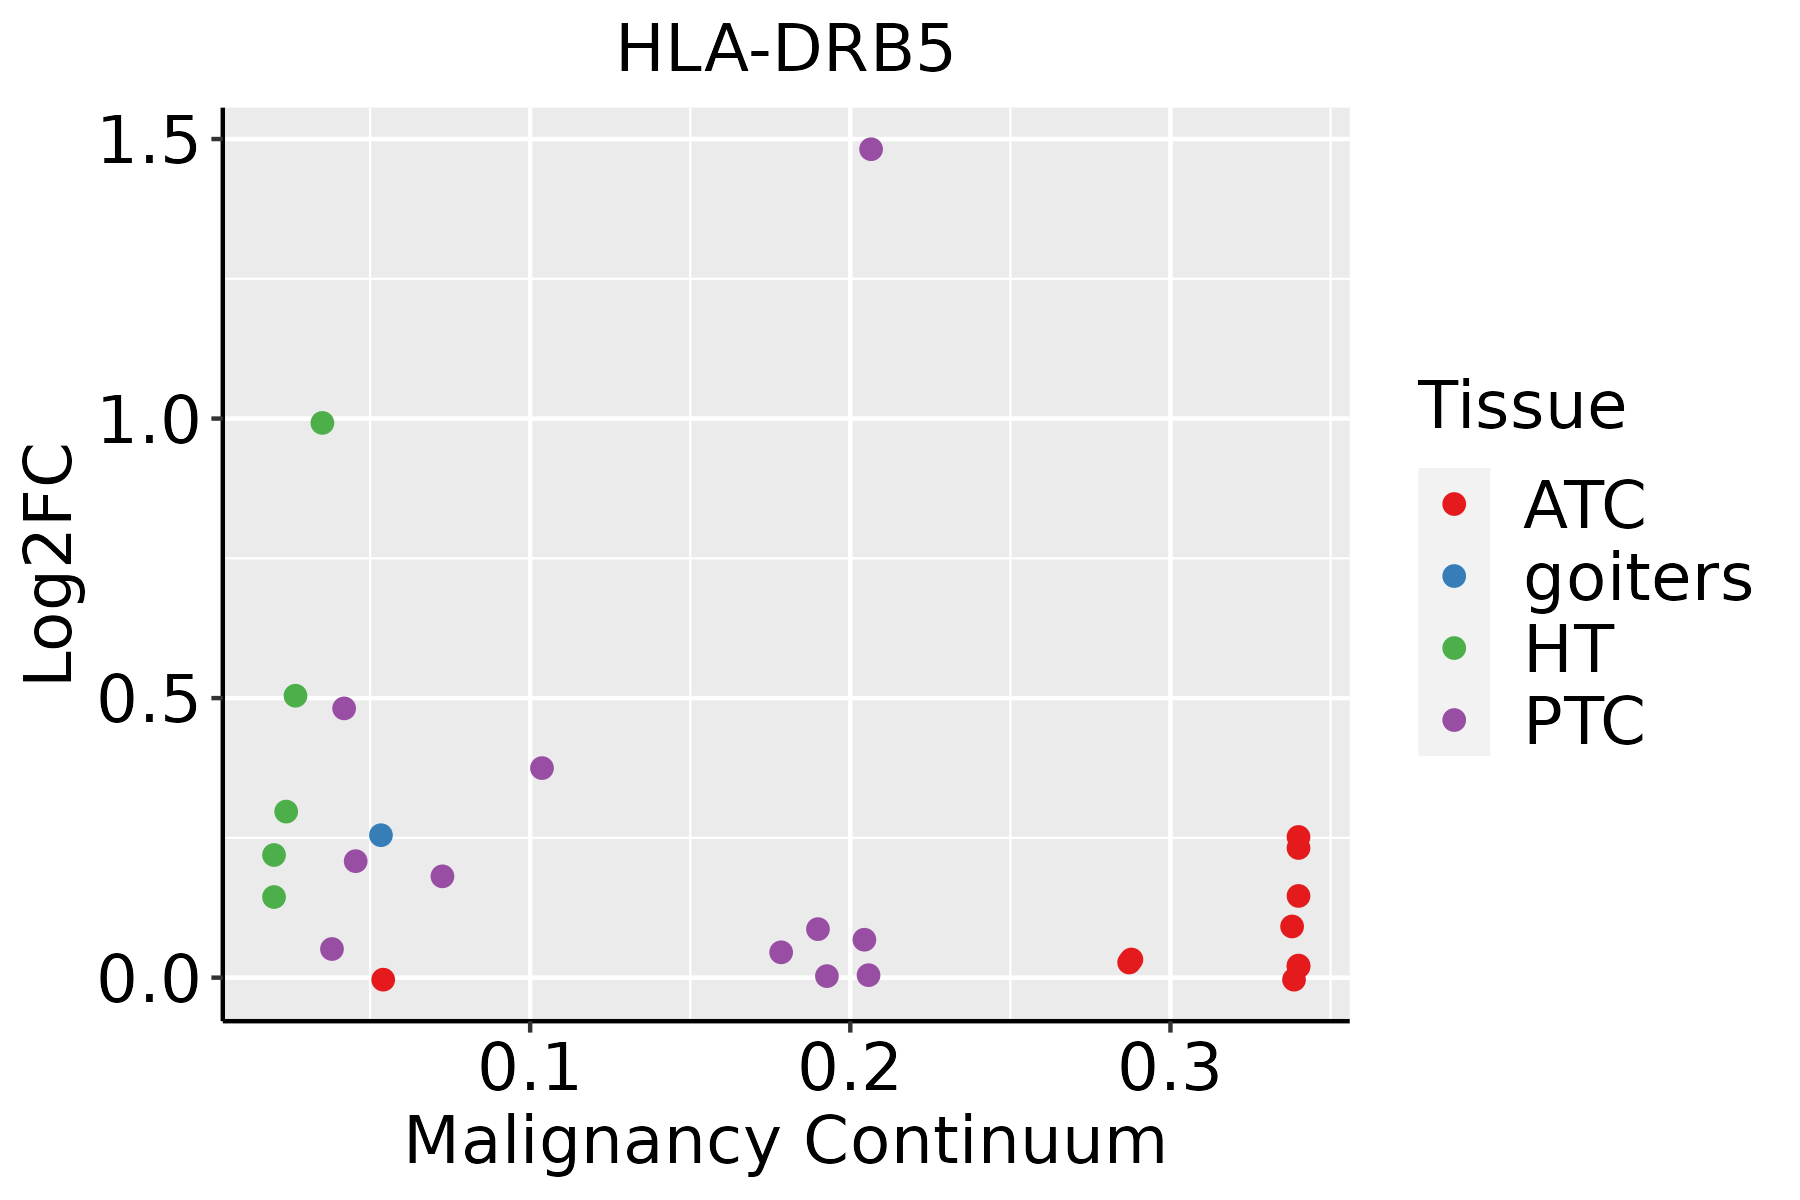 | ATC: Anaplastic thyroid cancer |
| HT: Hashimoto's thyroiditis | ||
| PTC: Papillary thyroid cancer |
| ∗log2FC in expression of this searched gene in stem-like cells from each diseased tissue sample relative to stem-like cells in normal samples in each tissue plotted against the malignancy continuum. Samples are colored based on if they are from different disease stage. |
Top |
Malignant transformation related pathway analysis |
| Find out the enriched GO biological processes and KEGG pathways involved in transition from healthy to precancer to cancer |
| Tissue | Disease Stage | Enriched GO biological Processes |
| Colorectum | AD |  |
| Colorectum | SER |  |
| Colorectum | MSS |  |
| Colorectum | MSI-H |  |
| Colorectum | FAP |  |
| ∗Top 15 enriched GO BP terms are showed in the bar plot of each disease state in each tissue. Each row represents a significant GO biological process which is colored according to the -log10(p.adjust). |
| Page: 1 2 3 4 5 6 7 8 9 |
| GO ID | Tissue | Disease Stage | Description | Gene Ratio | Bg Ratio | pvalue | p.adjust | Count |
| GO:000250416 | Oral cavity | LP | antigen processing and presentation of peptide or polysaccharide antigen via MHC class II | 16/4623 | 36/18723 | 7.52e-03 | 4.15e-02 | 16 |
| GO:004211023 | Oral cavity | EOLP | T cell activation | 111/2218 | 487/18723 | 4.67e-12 | 8.17e-10 | 111 |
| GO:000715917 | Oral cavity | EOLP | leukocyte cell-cell adhesion | 86/2218 | 371/18723 | 5.01e-10 | 4.11e-08 | 86 |
| GO:001988224 | Oral cavity | EOLP | antigen processing and presentation | 36/2218 | 106/18723 | 1.96e-09 | 1.26e-07 | 36 |
| GO:004578526 | Oral cavity | EOLP | positive regulation of cell adhesion | 95/2218 | 437/18723 | 2.30e-09 | 1.47e-07 | 95 |
| GO:005086316 | Oral cavity | EOLP | regulation of T cell activation | 76/2218 | 329/18723 | 5.96e-09 | 3.11e-07 | 76 |
| GO:190303716 | Oral cavity | EOLP | regulation of leukocyte cell-cell adhesion | 77/2218 | 336/18723 | 6.89e-09 | 3.53e-07 | 77 |
| GO:002240719 | Oral cavity | EOLP | regulation of cell-cell adhesion | 93/2218 | 448/18723 | 3.65e-08 | 1.41e-06 | 93 |
| GO:004800224 | Oral cavity | EOLP | antigen processing and presentation of peptide antigen | 24/2218 | 62/18723 | 5.49e-08 | 2.02e-06 | 24 |
| GO:000247824 | Oral cavity | EOLP | antigen processing and presentation of exogenous peptide antigen | 18/2218 | 38/18723 | 6.33e-08 | 2.30e-06 | 18 |
| GO:001988424 | Oral cavity | EOLP | antigen processing and presentation of exogenous antigen | 20/2218 | 47/18723 | 1.10e-07 | 3.71e-06 | 20 |
| GO:00512517 | Oral cavity | EOLP | positive regulation of lymphocyte activation | 72/2218 | 362/18723 | 6.21e-06 | 1.22e-04 | 72 |
| GO:190303915 | Oral cavity | EOLP | positive regulation of leukocyte cell-cell adhesion | 52/2218 | 239/18723 | 9.14e-06 | 1.70e-04 | 52 |
| GO:001988623 | Oral cavity | EOLP | antigen processing and presentation of exogenous peptide antigen via MHC class II | 13/2218 | 30/18723 | 1.48e-05 | 2.46e-04 | 13 |
| GO:00508677 | Oral cavity | EOLP | positive regulation of cell activation | 79/2218 | 420/18723 | 1.91e-05 | 3.02e-04 | 79 |
| GO:00026968 | Oral cavity | EOLP | positive regulation of leukocyte activation | 77/2218 | 409/18723 | 2.34e-05 | 3.52e-04 | 77 |
| GO:005087014 | Oral cavity | EOLP | positive regulation of T cell activation | 47/2218 | 216/18723 | 2.40e-05 | 3.58e-04 | 47 |
| GO:000250422 | Oral cavity | EOLP | antigen processing and presentation of peptide or polysaccharide antigen via MHC class II | 14/2218 | 36/18723 | 3.07e-05 | 4.38e-04 | 14 |
| GO:002240918 | Oral cavity | EOLP | positive regulation of cell-cell adhesion | 57/2218 | 284/18723 | 4.23e-05 | 5.77e-04 | 57 |
| GO:000249516 | Oral cavity | EOLP | antigen processing and presentation of peptide antigen via MHC class II | 13/2218 | 34/18723 | 7.26e-05 | 8.88e-04 | 13 |
| Page: 1 2 3 4 5 6 7 8 9 10 11 12 13 14 15 16 17 18 19 20 21 22 23 24 25 26 |
| Pathway ID | Tissue | Disease Stage | Description | Gene Ratio | Bg Ratio | pvalue | p.adjust | qvalue | Count |
| hsa0516922 | Breast | IDC | Epstein-Barr virus infection | 45/867 | 202/8465 | 3.16e-07 | 6.05e-06 | 4.52e-06 | 45 |
| hsa0461223 | Breast | IDC | Antigen processing and presentation | 24/867 | 78/8465 | 4.61e-07 | 8.33e-06 | 6.23e-06 | 24 |
| hsa0414522 | Breast | IDC | Phagosome | 34/867 | 152/8465 | 8.00e-06 | 9.99e-05 | 7.48e-05 | 34 |
| hsa0541623 | Breast | IDC | Viral myocarditis | 18/867 | 60/8465 | 1.85e-05 | 2.01e-04 | 1.50e-04 | 18 |
| hsa0516624 | Breast | IDC | Human T-cell leukemia virus 1 infection | 40/867 | 222/8465 | 2.52e-04 | 2.21e-03 | 1.66e-03 | 40 |
| hsa0532321 | Breast | IDC | Rheumatoid arthritis | 21/867 | 93/8465 | 3.69e-04 | 3.15e-03 | 2.36e-03 | 21 |
| hsa0494014 | Breast | IDC | Type I diabetes mellitus | 12/867 | 43/8465 | 9.40e-04 | 7.28e-03 | 5.44e-03 | 12 |
| hsa0533012 | Breast | IDC | Allograft rejection | 11/867 | 38/8465 | 1.09e-03 | 8.26e-03 | 6.18e-03 | 11 |
| hsa0533210 | Breast | IDC | Graft-versus-host disease | 11/867 | 42/8465 | 2.66e-03 | 1.80e-02 | 1.35e-02 | 11 |
| hsa0514012 | Breast | IDC | Leishmaniasis | 16/867 | 77/8465 | 4.35e-03 | 2.57e-02 | 1.92e-02 | 16 |
| hsa0532010 | Breast | IDC | Autoimmune thyroid disease | 12/867 | 53/8465 | 6.29e-03 | 3.30e-02 | 2.47e-02 | 12 |
| hsa0516932 | Breast | IDC | Epstein-Barr virus infection | 45/867 | 202/8465 | 3.16e-07 | 6.05e-06 | 4.52e-06 | 45 |
| hsa0461233 | Breast | IDC | Antigen processing and presentation | 24/867 | 78/8465 | 4.61e-07 | 8.33e-06 | 6.23e-06 | 24 |
| hsa0414532 | Breast | IDC | Phagosome | 34/867 | 152/8465 | 8.00e-06 | 9.99e-05 | 7.48e-05 | 34 |
| hsa0541633 | Breast | IDC | Viral myocarditis | 18/867 | 60/8465 | 1.85e-05 | 2.01e-04 | 1.50e-04 | 18 |
| hsa0516634 | Breast | IDC | Human T-cell leukemia virus 1 infection | 40/867 | 222/8465 | 2.52e-04 | 2.21e-03 | 1.66e-03 | 40 |
| hsa0532331 | Breast | IDC | Rheumatoid arthritis | 21/867 | 93/8465 | 3.69e-04 | 3.15e-03 | 2.36e-03 | 21 |
| hsa0494015 | Breast | IDC | Type I diabetes mellitus | 12/867 | 43/8465 | 9.40e-04 | 7.28e-03 | 5.44e-03 | 12 |
| hsa0533013 | Breast | IDC | Allograft rejection | 11/867 | 38/8465 | 1.09e-03 | 8.26e-03 | 6.18e-03 | 11 |
| hsa0533211 | Breast | IDC | Graft-versus-host disease | 11/867 | 42/8465 | 2.66e-03 | 1.80e-02 | 1.35e-02 | 11 |
| Page: 1 2 3 4 5 6 7 8 9 10 11 12 13 14 15 16 17 18 19 20 21 22 23 |
Top |
Cell-cell communication analysis |
| Identification of potential cell-cell interactions between two cell types and their ligand-receptor pairs for different disease states |
| Ligand | Receptor | LRpair | Pathway | Tissue | Disease Stage |
| HLA-DRB5 | CD4 | HLA-DRB5_CD4 | MHC-II | Breast | DCIS |
| HLA-DRB5 | CD4 | HLA-DRB5_CD4 | MHC-II | Breast | Healthy |
| HLA-DRB5 | CD4 | HLA-DRB5_CD4 | MHC-II | Breast | IDC |
| HLA-DRB5 | CD4 | HLA-DRB5_CD4 | MHC-II | Cervix | ADJ |
| HLA-DRB5 | CD4 | HLA-DRB5_CD4 | MHC-II | Cervix | CC |
| HLA-DRB5 | CD4 | HLA-DRB5_CD4 | MHC-II | Cervix | Healthy |
| HLA-DRB5 | CD4 | HLA-DRB5_CD4 | MHC-II | Cervix | Precancer |
| HLA-DRB5 | CD4 | HLA-DRB5_CD4 | MHC-II | CRC | AD |
| HLA-DRB5 | CD4 | HLA-DRB5_CD4 | MHC-II | CRC | ADJ |
| HLA-DRB5 | CD4 | HLA-DRB5_CD4 | MHC-II | CRC | SER |
| HLA-DRB5 | CD4 | HLA-DRB5_CD4 | MHC-II | Endometrium | AEH |
| HLA-DRB5 | CD4 | HLA-DRB5_CD4 | MHC-II | Endometrium | EEC |
| HLA-DRB5 | CD4 | HLA-DRB5_CD4 | MHC-II | Endometrium | Healthy |
| HLA-DRB5 | CD4 | HLA-DRB5_CD4 | MHC-II | HNSCC | ADJ |
| HLA-DRB5 | CD4 | HLA-DRB5_CD4 | MHC-II | HNSCC | Healthy |
| HLA-DRB5 | CD4 | HLA-DRB5_CD4 | MHC-II | HNSCC | OSCC |
| HLA-DRB5 | CD4 | HLA-DRB5_CD4 | MHC-II | HNSCC | Precancer |
| HLA-DRB5 | CD4 | HLA-DRB5_CD4 | MHC-II | Liver | Healthy |
| HLA-DRB5 | CD4 | HLA-DRB5_CD4 | MHC-II | Liver | Precancer |
| HLA-DRB5 | CD4 | HLA-DRB5_CD4 | MHC-II | Lung | AAH |
| Page: 1 2 |
Top |
Single-cell gene regulatory network inference analysis |
| Find out the significant the regulons (TFs) and the target genes of each regulon across cell types for different disease states |
| TF | Cell Type | Tissue | Disease Stage | Target Gene | RSS | Regulon Activity |
| ∗The dot plots of a searched regulon are shown for all cell subpopulations in each disease state of each tissue based on the regulon specific score inferred using pySCENIC and by calculating the average expression. |
| Page: 1 |
Top |
Somatic mutation of malignant transformation related genes |
| Annotation of somatic variants for genes involved in malignant transformation |
| Hugo Symbol | Variant Class | Variant Classification | dbSNP RS | HGVSc | HGVSp | HGVSp Short | SWISSPROT | BIOTYPE | SIFT | PolyPhen | Tumor Sample Barcode | Tissue | Histology | Sex | Age | Stage | Therapy Types | Drugs | Outcome |
| HLA-DRB5 | SNV | Missense_Mutation | novel | c.611T>C | p.Val204Ala | p.V204A | Q30154 | protein_coding | deleterious(0.01) | probably_damaging(0.999) | TCGA-2W-A8YY-01 | Cervix | cervical & endocervical cancer | Female | <65 | I/II | Chemotherapy | cisplatin | CR |
| HLA-DRB5 | SNV | Missense_Mutation | novel | c.536N>G | p.Asn179Ser | p.N179S | Q30154 | protein_coding | deleterious(0.03) | benign(0.012) | TCGA-CM-6678-01 | Colorectum | colon adenocarcinoma | Female | <65 | I/II | Chemotherapy | fluorouracil | SD |
| HLA-DRB5 | SNV | Missense_Mutation | c.430N>A | p.Leu144Met | p.L144M | Q30154 | protein_coding | deleterious(0) | probably_damaging(1) | TCGA-AG-A002-01 | Colorectum | rectum adenocarcinoma | Male | <65 | I/II | Unknown | Unknown | SD | |
| HLA-DRB5 | SNV | Missense_Mutation | novel | c.501N>T | p.Glu167Asp | p.E167D | Q30154 | protein_coding | deleterious(0) | probably_damaging(0.996) | TCGA-A5-A2K5-01 | Endometrium | uterine corpus endometrioid carcinoma | Female | >=65 | I/II | Unknown | Unknown | SD |
| HLA-DRB5 | SNV | Missense_Mutation | novel | c.330C>A | p.His110Gln | p.H110Q | Q30154 | protein_coding | deleterious(0.02) | benign(0.179) | TCGA-AP-A054-01 | Endometrium | uterine corpus endometrioid carcinoma | Female | <65 | III/IV | Chemotherapy | carboplatin | PD |
| HLA-DRB5 | SNV | Missense_Mutation | c.37G>A | p.Ala13Thr | p.A13T | Q30154 | protein_coding | tolerated(0.1) | benign(0.003) | TCGA-EY-A1GI-01 | Endometrium | uterine corpus endometrioid carcinoma | Female | <65 | I/II | Unknown | Unknown | SD | |
| HLA-DRB5 | SNV | Missense_Mutation | novel | c.611T>G | p.Val204Gly | p.V204G | Q30154 | protein_coding | deleterious(0) | probably_damaging(1) | TCGA-FI-A2D5-01 | Endometrium | uterine corpus endometrioid carcinoma | Female | <65 | III/IV | Chemotherapy | carboplatinum | PD |
| HLA-DRB5 | SNV | Missense_Mutation | c.469G>A | p.Glu157Lys | p.E157K | Q30154 | protein_coding | tolerated(0.41) | probably_damaging(0.998) | TCGA-37-3789-01 | Lung | lung squamous cell carcinoma | Male | >=65 | I/II | Unknown | Unknown | SD | |
| HLA-DRB5 | SNV | Missense_Mutation | novel | c.154N>T | p.Arg52Trp | p.R52W | Q30154 | protein_coding | deleterious(0.01) | probably_damaging(1) | TCGA-XK-AAIW-01 | Prostate | prostate adenocarcinoma | Male | >=65 | 9 | Unknown | Unknown | PD |
| Page: 1 |
Top |
Related drugs of malignant transformation related genes |
| Identification of chemicals and drugs interact with genes involved in malignant transfromation |
| (DGIdb 4.0) |
| Entrez ID | Symbol | Category | Interaction Types | Drug Claim Name | Drug Name | PMIDs |
| 3127 | HLA-DRB5 | DRUGGABLE GENOME, CLINICALLY ACTIONABLE | amoxicillin | AMOXICILLIN | 10535882 | |
| 3127 | HLA-DRB5 | DRUGGABLE GENOME, CLINICALLY ACTIONABLE | 1D09C3 | 1D09C3 | ||
| 3127 | HLA-DRB5 | DRUGGABLE GENOME, CLINICALLY ACTIONABLE | clozapine | CLOZAPINE | 11146763 | |
| 3127 | HLA-DRB5 | DRUGGABLE GENOME, CLINICALLY ACTIONABLE | clavulanate | CLAVULANIC ACID | 10535882 |
| Page: 1 |

Copyright 2023-Present -The University of Texas Health Science Center at Houston |