
|
|||||
|
 | |
| |
| |
| |
| |
| |
|
Gene: HGD |
Gene summary for HGD |
| Gene information | Species | Human | Gene symbol | HGD | Gene ID | 3081 |
| Gene name | homogentisate 1,2-dioxygenase | |
| Gene Alias | AKU | |
| Cytomap | 3q13.33 | |
| Gene Type | protein-coding | GO ID | GO:0006082 | UniProtAcc | Q93099 |
Top |
Malignant transformation analysis |
| Identification of the aberrant gene expression in precancerous and cancerous lesions by comparing the gene expression of stem-like cells in diseased tissues with normal stem cells |
| Entrez ID | Symbol | Replicates | Species | Organ | Tissue | Adj P-value | Log2FC | Malignancy |
| 3081 | HGD | NAFLD1 | Human | Liver | NAFLD | 6.30e-10 | 1.22e+00 | -0.04 |
| 3081 | HGD | S41 | Human | Liver | Cirrhotic | 1.91e-03 | 6.05e-01 | -0.0343 |
| 3081 | HGD | S43 | Human | Liver | Cirrhotic | 1.33e-12 | -3.28e-01 | -0.0187 |
| 3081 | HGD | S44 | Human | Liver | HCC | 3.23e-04 | 6.29e-01 | -0.0083 |
| 3081 | HGD | HCC1_Meng | Human | Liver | HCC | 3.36e-113 | -5.89e-02 | 0.0246 |
| 3081 | HGD | HCC2_Meng | Human | Liver | HCC | 7.40e-40 | -3.09e-01 | 0.0107 |
| 3081 | HGD | cirrhotic1 | Human | Liver | Cirrhotic | 1.12e-15 | -7.50e-02 | 0.0202 |
| 3081 | HGD | cirrhotic2 | Human | Liver | Cirrhotic | 1.43e-14 | -2.04e-01 | 0.0201 |
| 3081 | HGD | cirrhotic3 | Human | Liver | Cirrhotic | 7.34e-06 | -2.90e-01 | 0.0215 |
| 3081 | HGD | HCC1 | Human | Liver | HCC | 2.11e-20 | 5.26e+00 | 0.5336 |
| 3081 | HGD | HCC2 | Human | Liver | HCC | 9.73e-08 | 4.42e+00 | 0.5341 |
| 3081 | HGD | Pt13.a | Human | Liver | HCC | 8.10e-05 | -1.95e-01 | 0.021 |
| 3081 | HGD | Pt13.b | Human | Liver | HCC | 1.57e-18 | -1.30e-01 | 0.0251 |
| 3081 | HGD | Pt13.c | Human | Liver | HCC | 3.64e-04 | -4.79e-01 | 0.0076 |
| 3081 | HGD | Pt14.a | Human | Liver | HCC | 7.13e-05 | 4.89e-02 | 0.0169 |
| 3081 | HGD | Pt14.b | Human | Liver | HCC | 1.51e-06 | 1.52e-01 | 0.018 |
| 3081 | HGD | Pt14.c | Human | Liver | HCC | 1.10e-10 | 9.03e-01 | 0.0054 |
| 3081 | HGD | Pt14.d | Human | Liver | HCC | 4.54e-06 | -5.33e-02 | 0.0143 |
| 3081 | HGD | S028 | Human | Liver | HCC | 2.83e-04 | 5.57e-01 | 0.2503 |
| 3081 | HGD | S029 | Human | Liver | HCC | 4.56e-09 | 9.85e-01 | 0.2581 |
| Page: 1 |
| Tissue | Expression Dynamics | Abbreviation |
| Liver | 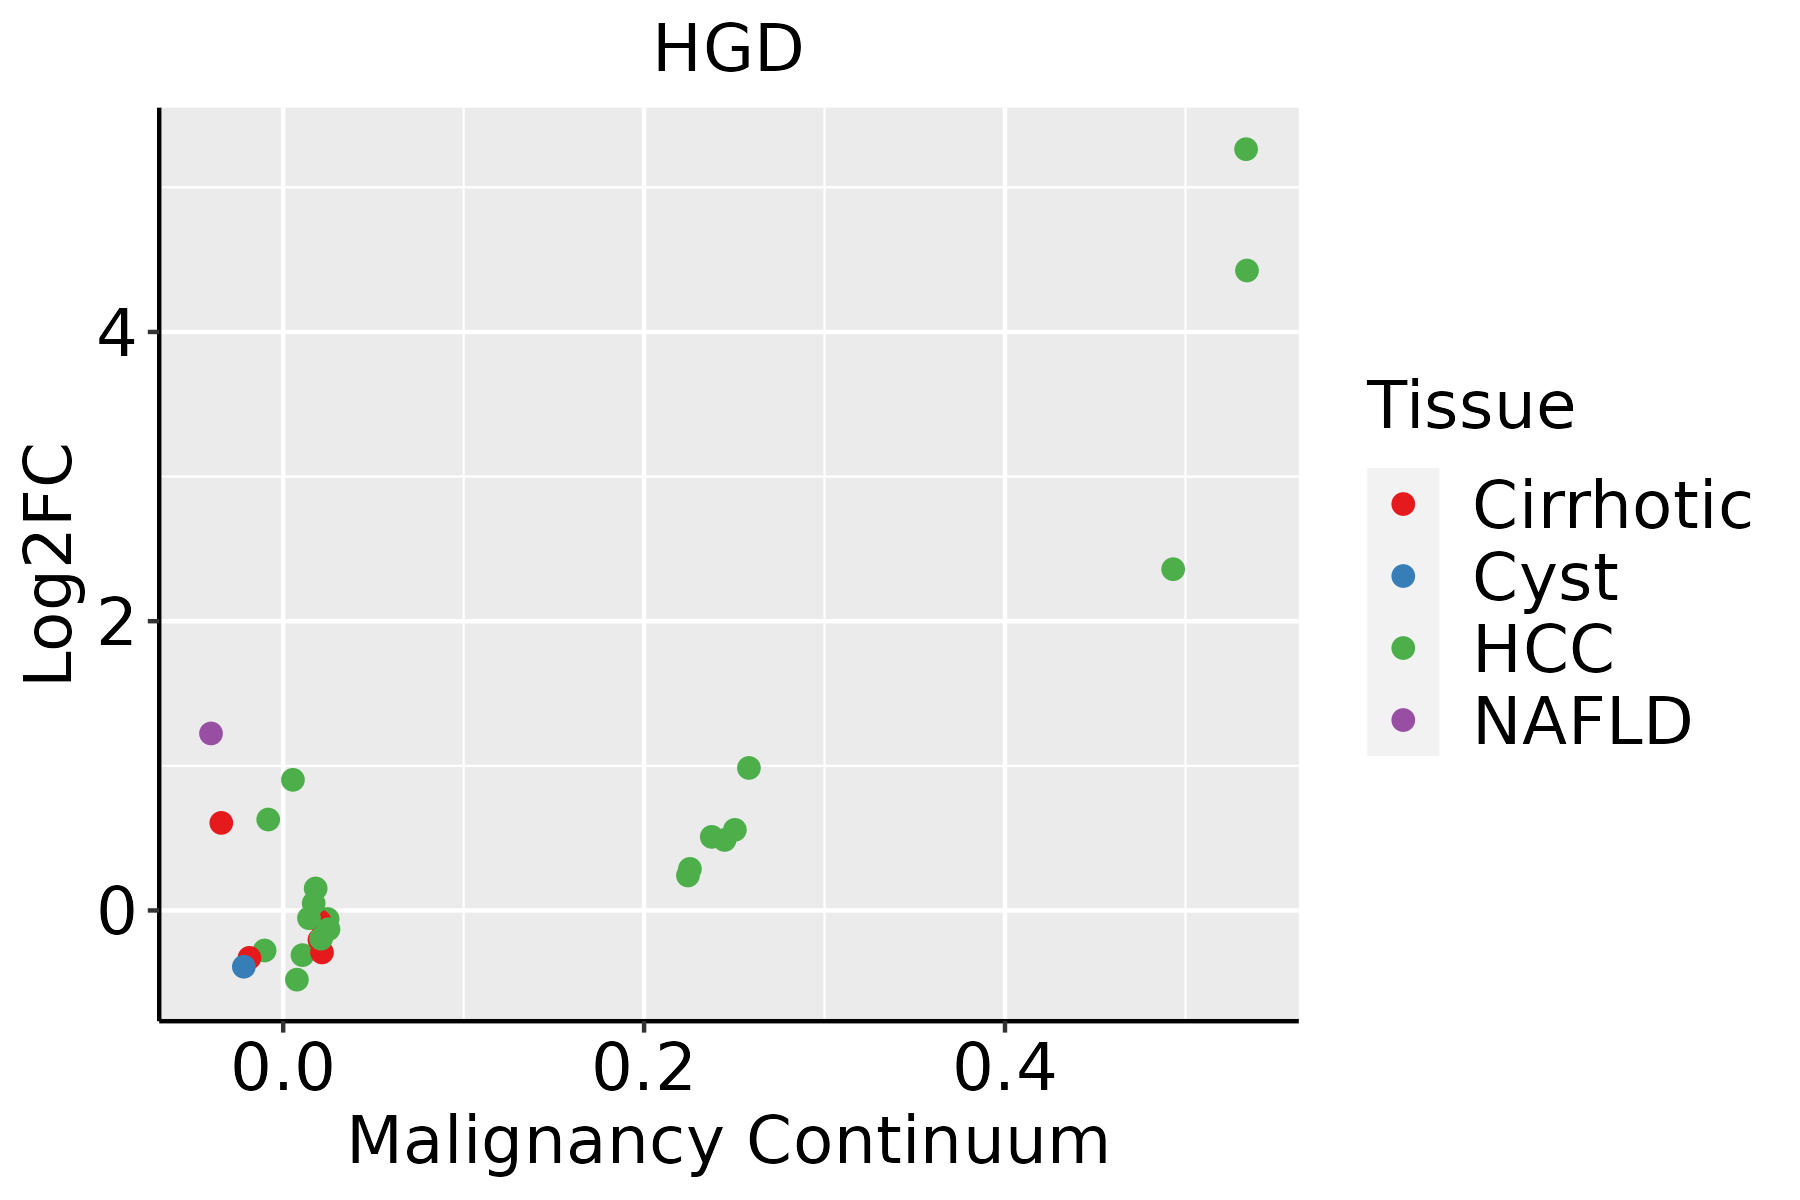 | HCC: Hepatocellular carcinoma |
| NAFLD: Non-alcoholic fatty liver disease |
| ∗log2FC in expression of this searched gene in stem-like cells from each diseased tissue sample relative to stem-like cells in normal samples in each tissue plotted against the malignancy continuum. Samples are colored based on if they are from different disease stage. |
Top |
Malignant transformation related pathway analysis |
| Find out the enriched GO biological processes and KEGG pathways involved in transition from healthy to precancer to cancer |
| Tissue | Disease Stage | Enriched GO biological Processes |
| Colorectum | AD |  |
| Colorectum | SER |  |
| Colorectum | MSS |  |
| Colorectum | MSI-H |  |
| Colorectum | FAP |  |
| ∗Top 15 enriched GO BP terms are showed in the bar plot of each disease state in each tissue. Each row represents a significant GO biological process which is colored according to the -log10(p.adjust). |
| Page: 1 2 3 4 5 6 7 8 9 |
| GO ID | Tissue | Disease Stage | Description | Gene Ratio | Bg Ratio | pvalue | p.adjust | Count |
| GO:00100015 | Oral cavity | OSCC | glial cell differentiation | 110/7305 | 225/18723 | 1.56e-03 | 7.45e-03 | 110 |
| GO:00219158 | Oral cavity | OSCC | neural tube development | 77/7305 | 152/18723 | 2.26e-03 | 1.00e-02 | 77 |
| GO:00086524 | Oral cavity | OSCC | cellular amino acid biosynthetic process | 42/7305 | 76/18723 | 2.93e-03 | 1.27e-02 | 42 |
| GO:00447067 | Oral cavity | OSCC | multi-multicellular organism process | 105/7305 | 220/18723 | 5.05e-03 | 1.97e-02 | 105 |
| GO:19016074 | Oral cavity | OSCC | alpha-amino acid biosynthetic process | 37/7305 | 68/18723 | 7.09e-03 | 2.63e-02 | 37 |
| GO:20002496 | Oral cavity | OSCC | regulation of actin cytoskeleton reorganization | 23/7305 | 39/18723 | 9.09e-03 | 3.26e-02 | 23 |
| GO:00465788 | Oral cavity | OSCC | regulation of Ras protein signal transduction | 90/7305 | 189/18723 | 9.58e-03 | 3.40e-02 | 90 |
| GO:00075667 | Oral cavity | OSCC | embryo implantation | 29/7305 | 53/18723 | 1.46e-02 | 4.76e-02 | 29 |
| GO:002290019 | Oral cavity | LP | electron transport chain | 108/4623 | 175/18723 | 2.21e-25 | 9.90e-23 | 108 |
| GO:000609119 | Oral cavity | LP | generation of precursor metabolites and energy | 214/4623 | 490/18723 | 1.12e-20 | 2.60e-18 | 214 |
| GO:0071496110 | Oral cavity | LP | cellular response to external stimulus | 124/4623 | 320/18723 | 1.44e-08 | 5.36e-07 | 124 |
| GO:007121417 | Oral cavity | LP | cellular response to abiotic stimulus | 121/4623 | 331/18723 | 8.45e-07 | 2.20e-05 | 121 |
| GO:010400417 | Oral cavity | LP | cellular response to environmental stimulus | 121/4623 | 331/18723 | 8.45e-07 | 2.20e-05 | 121 |
| GO:007126014 | Oral cavity | LP | cellular response to mechanical stimulus | 39/4623 | 81/18723 | 3.97e-06 | 8.20e-05 | 39 |
| GO:000961215 | Oral cavity | LP | response to mechanical stimulus | 81/4623 | 216/18723 | 1.80e-05 | 3.09e-04 | 81 |
| GO:0032970110 | Oral cavity | LP | regulation of actin filament-based process | 133/4623 | 397/18723 | 4.21e-05 | 6.09e-04 | 133 |
| GO:004206313 | Oral cavity | LP | gliogenesis | 104/4623 | 301/18723 | 7.21e-05 | 9.49e-04 | 104 |
| GO:0032956110 | Oral cavity | LP | regulation of actin cytoskeleton organization | 120/4623 | 358/18723 | 9.47e-05 | 1.18e-03 | 120 |
| GO:001000111 | Oral cavity | LP | glial cell differentiation | 78/4623 | 225/18723 | 4.82e-04 | 4.52e-03 | 78 |
| GO:000726515 | Oral cavity | LP | Ras protein signal transduction | 109/4623 | 337/18723 | 8.44e-04 | 7.36e-03 | 109 |
| Page: 1 2 3 4 5 6 7 8 9 10 11 12 13 14 15 16 17 18 19 20 21 22 23 24 25 |
| Pathway ID | Tissue | Disease Stage | Description | Gene Ratio | Bg Ratio | pvalue | p.adjust | qvalue | Count |
| Page: 1 |
Top |
Cell-cell communication analysis |
| Identification of potential cell-cell interactions between two cell types and their ligand-receptor pairs for different disease states |
| Ligand | Receptor | LRpair | Pathway | Tissue | Disease Stage |
| Page: 1 |
Top |
Single-cell gene regulatory network inference analysis |
| Find out the significant the regulons (TFs) and the target genes of each regulon across cell types for different disease states |
| TF | Cell Type | Tissue | Disease Stage | Target Gene | RSS | Regulon Activity |
| ∗The dot plots of a searched regulon are shown for all cell subpopulations in each disease state of each tissue based on the regulon specific score inferred using pySCENIC and by calculating the average expression. |
| Page: 1 |
Top |
Somatic mutation of malignant transformation related genes |
| Annotation of somatic variants for genes involved in malignant transformation |
| Hugo Symbol | Variant Class | Variant Classification | dbSNP RS | HGVSc | HGVSp | HGVSp Short | SWISSPROT | BIOTYPE | SIFT | PolyPhen | Tumor Sample Barcode | Tissue | Histology | Sex | Age | Stage | Therapy Types | Drugs | Outcome |
| HGD | SNV | Missense_Mutation | novel | c.1219N>T | p.Ala407Ser | p.A407S | Q93099 | protein_coding | tolerated(0.66) | benign(0.009) | TCGA-AQ-A54N-01 | Breast | breast invasive carcinoma | Female | <65 | I/II | Unknown | Unknown | SD |
| HGD | SNV | Missense_Mutation | c.30N>G | p.Phe10Leu | p.F10L | Q93099 | protein_coding | tolerated(0.05) | possibly_damaging(0.509) | TCGA-D8-A13Y-01 | Breast | breast invasive carcinoma | Female | <65 | I/II | Chemotherapy | doxorubicin | SD | |
| HGD | SNV | Missense_Mutation | c.1226N>T | p.Thr409Ile | p.T409I | Q93099 | protein_coding | deleterious(0) | probably_damaging(0.969) | TCGA-D8-A1XQ-01 | Breast | breast invasive carcinoma | Female | >=65 | I/II | Unknown | Unknown | SD | |
| HGD | SNV | Missense_Mutation | rs756255206 | c.559C>T | p.Arg187Trp | p.R187W | Q93099 | protein_coding | deleterious(0) | probably_damaging(0.996) | TCGA-2W-A8YY-01 | Cervix | cervical & endocervical cancer | Female | <65 | I/II | Chemotherapy | cisplatin | CR |
| HGD | SNV | Missense_Mutation | c.229G>A | p.Asp77Asn | p.D77N | Q93099 | protein_coding | tolerated(0.29) | benign(0) | TCGA-DG-A2KK-01 | Cervix | cervical & endocervical cancer | Female | <65 | III/IV | Chemotherapy | cisplatin | SD | |
| HGD | SNV | Missense_Mutation | novel | c.697N>C | p.Trp233Arg | p.W233R | Q93099 | protein_coding | tolerated(0.26) | benign(0.301) | TCGA-DS-A0VN-01 | Cervix | cervical & endocervical cancer | Female | <65 | I/II | Chemotherapy | cisplatin | SD |
| HGD | SNV | Missense_Mutation | novel | c.287N>C | p.Arg96Thr | p.R96T | Q93099 | protein_coding | deleterious(0) | probably_damaging(0.998) | TCGA-MA-AA41-01 | Cervix | cervical & endocervical cancer | Female | <65 | I/II | Unknown | Unknown | SD |
| HGD | SNV | Missense_Mutation | novel | c.1142C>T | p.Ala381Val | p.A381V | Q93099 | protein_coding | deleterious(0) | possibly_damaging(0.774) | TCGA-AA-3966-01 | Colorectum | colon adenocarcinoma | Female | >=65 | I/II | Unknown | Unknown | SD |
| HGD | SNV | Missense_Mutation | c.173G>T | p.Arg58Ile | p.R58I | Q93099 | protein_coding | deleterious(0) | probably_damaging(0.948) | TCGA-AA-A010-01 | Colorectum | colon adenocarcinoma | Female | <65 | I/II | Chemotherapy | folinic | CR | |
| HGD | SNV | Missense_Mutation | c.173N>T | p.Arg58Ile | p.R58I | Q93099 | protein_coding | deleterious(0) | probably_damaging(0.948) | TCGA-CA-6718-01 | Colorectum | colon adenocarcinoma | Male | <65 | I/II | Unknown | Unknown | PD |
| Page: 1 2 3 4 5 6 |
Top |
Related drugs of malignant transformation related genes |
| Identification of chemicals and drugs interact with genes involved in malignant transfromation |
| (DGIdb 4.0) |
| Entrez ID | Symbol | Category | Interaction Types | Drug Claim Name | Drug Name | PMIDs |
| Page: 1 |

Copyright 2023-Present -The University of Texas Health Science Center at Houston |