| Tissue | Expression Dynamics | Abbreviation |
| Colorectum (GSE201348) | 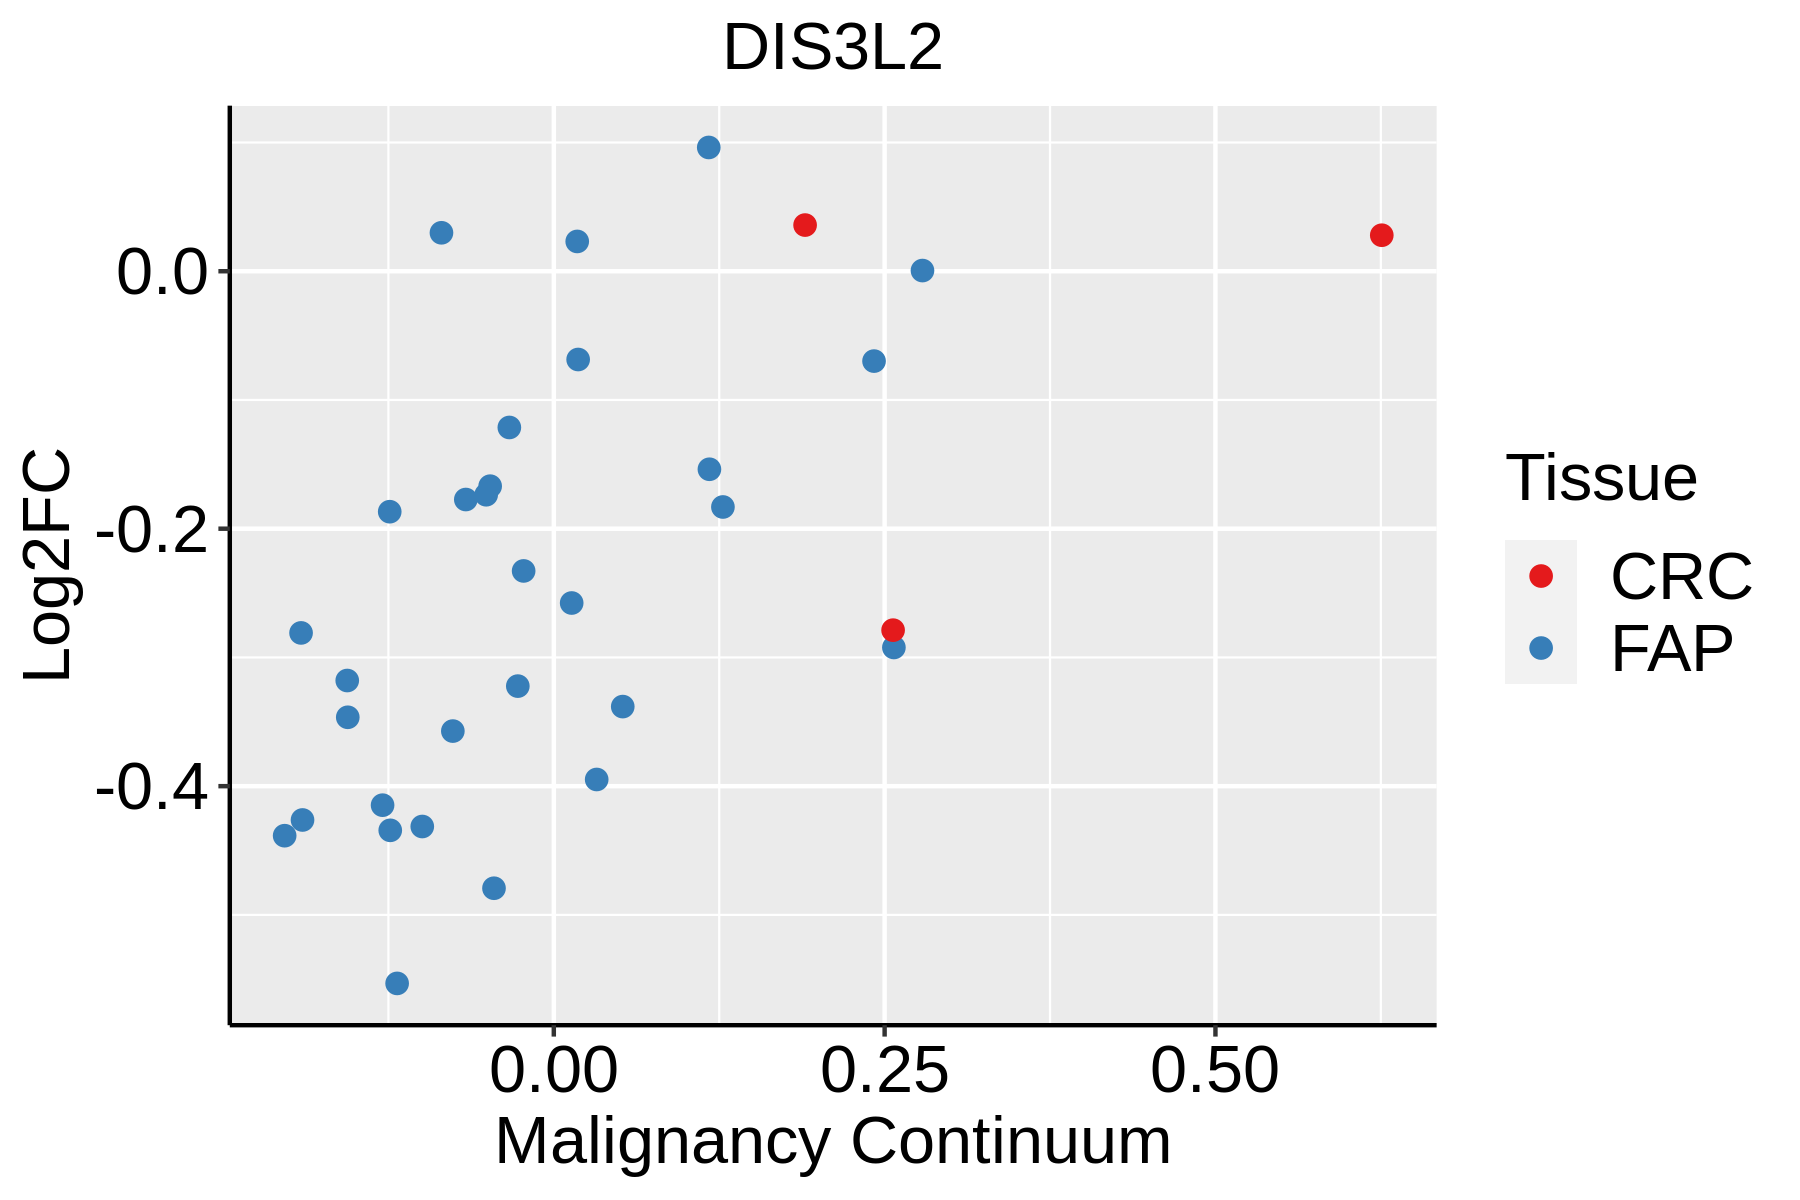 | FAP: Familial adenomatous polyposis |
| CRC: Colorectal cancer |
| Colorectum (HTA11) | 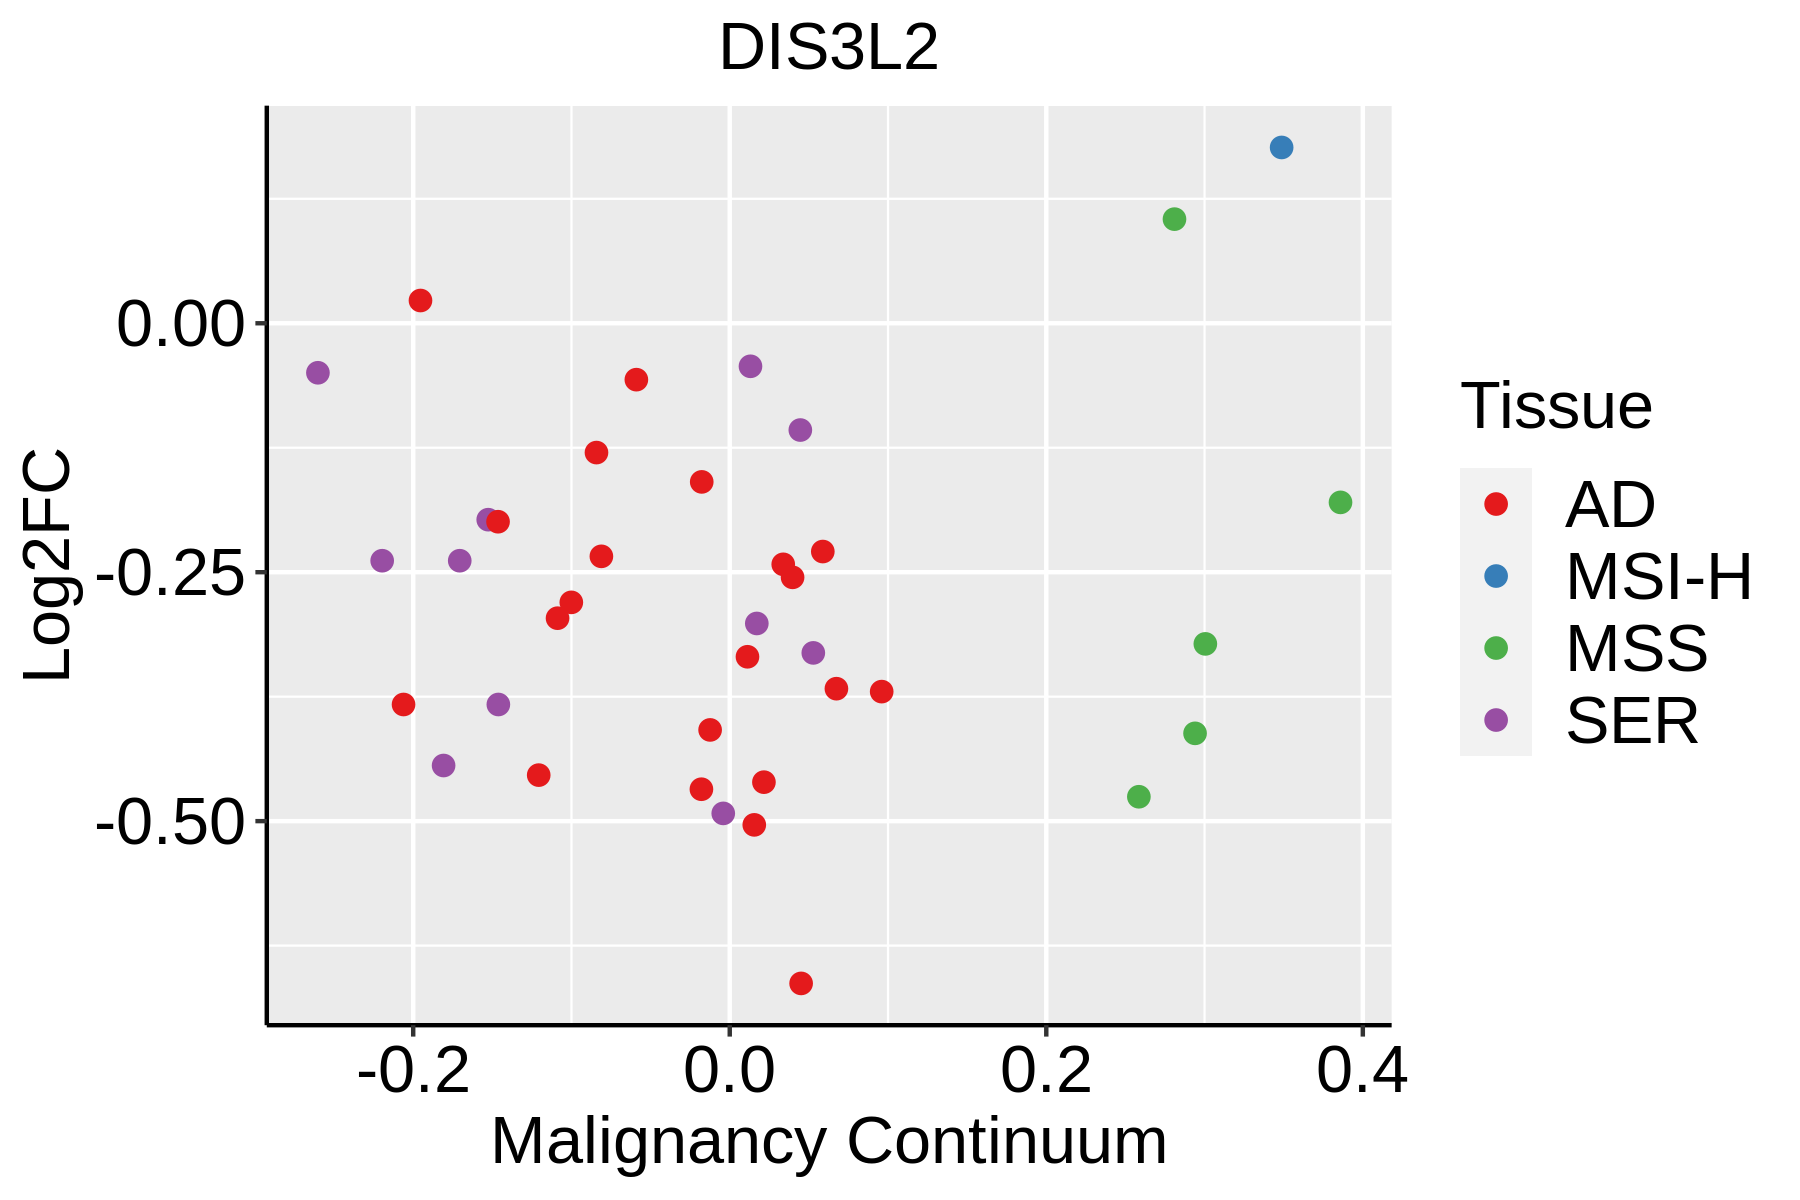 | AD: Adenomas |
| SER: Sessile serrated lesions |
| MSI-H: Microsatellite-high colorectal cancer |
| MSS: Microsatellite stable colorectal cancer |
| Esophagus | 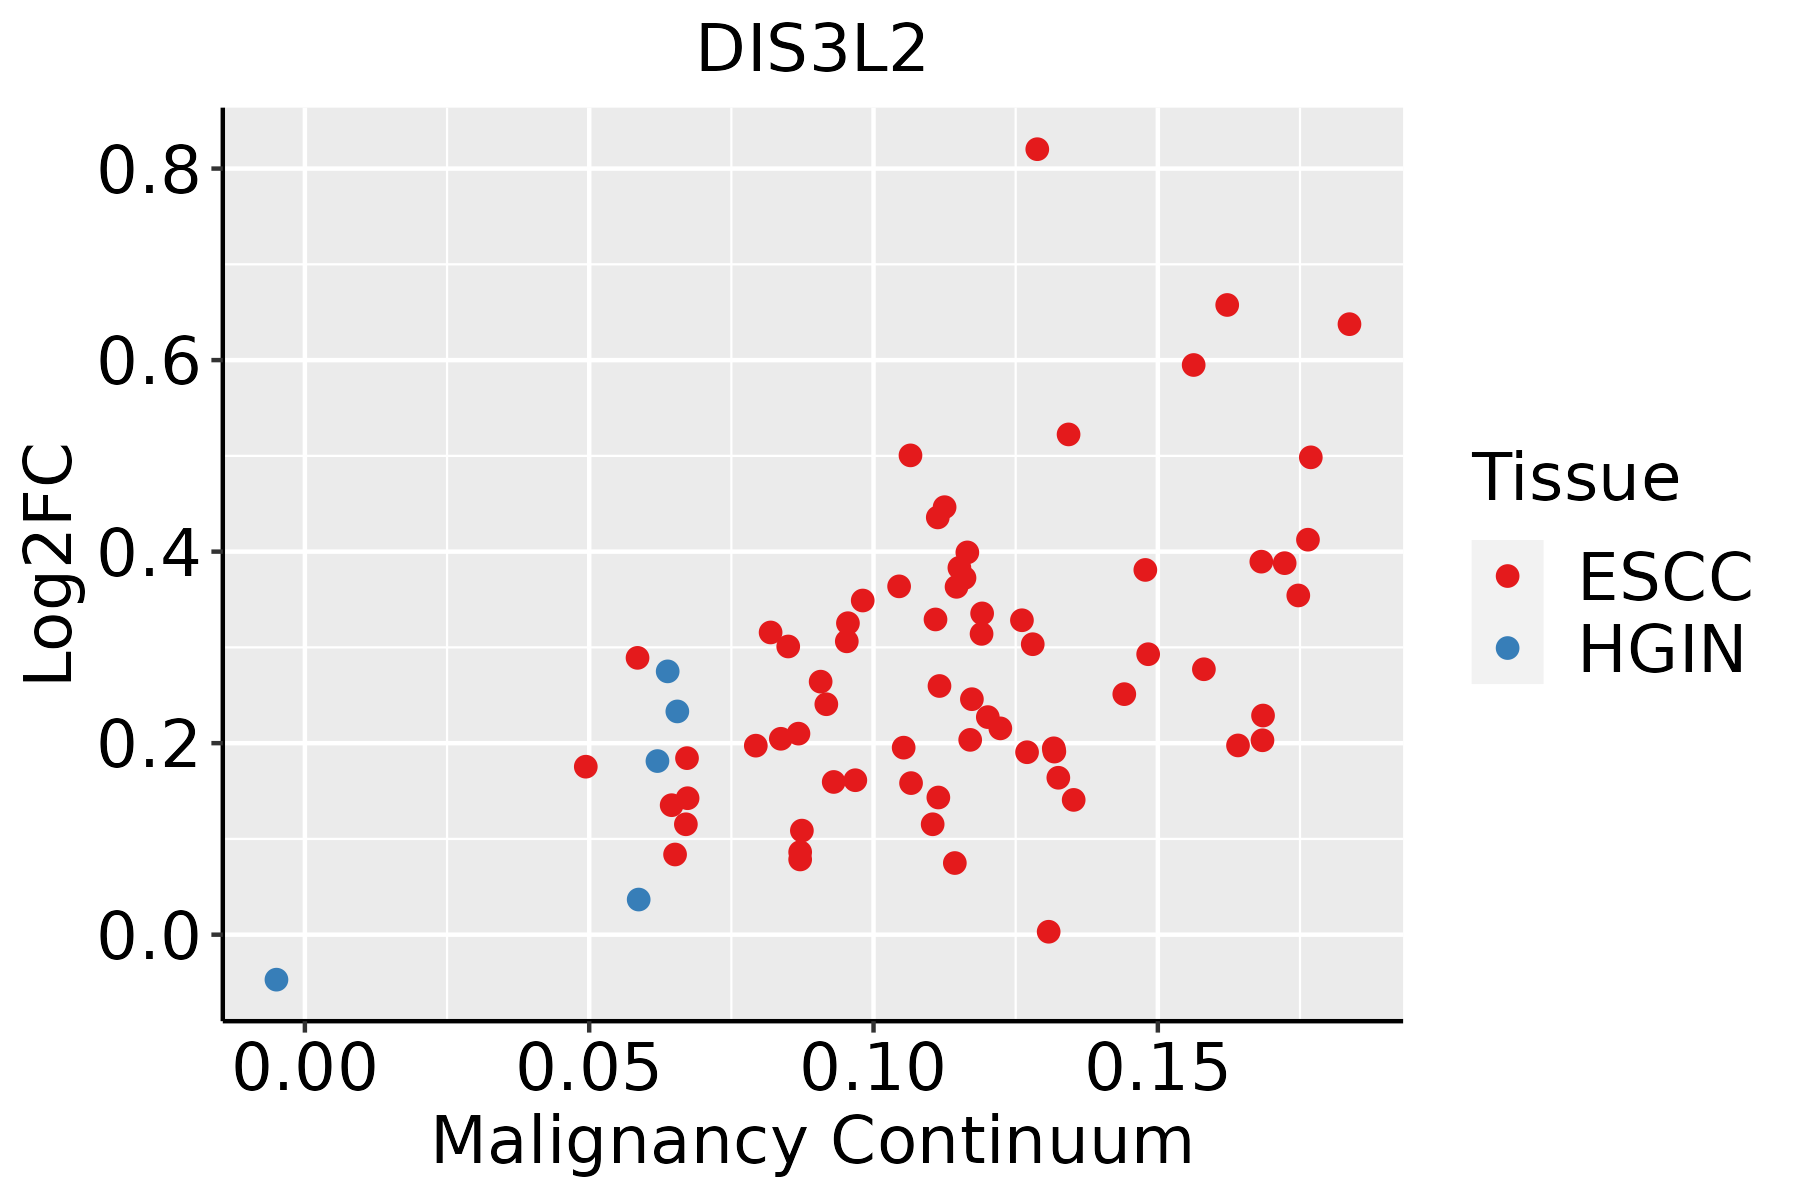 | ESCC: Esophageal squamous cell carcinoma |
| HGIN: High-grade intraepithelial neoplasias |
| LGIN: Low-grade intraepithelial neoplasias |
| Lung |  | AAH: Atypical adenomatous hyperplasia |
| AIS: Adenocarcinoma in situ |
| IAC: Invasive lung adenocarcinoma |
| MIA: Minimally invasive adenocarcinoma |
| Oral Cavity | 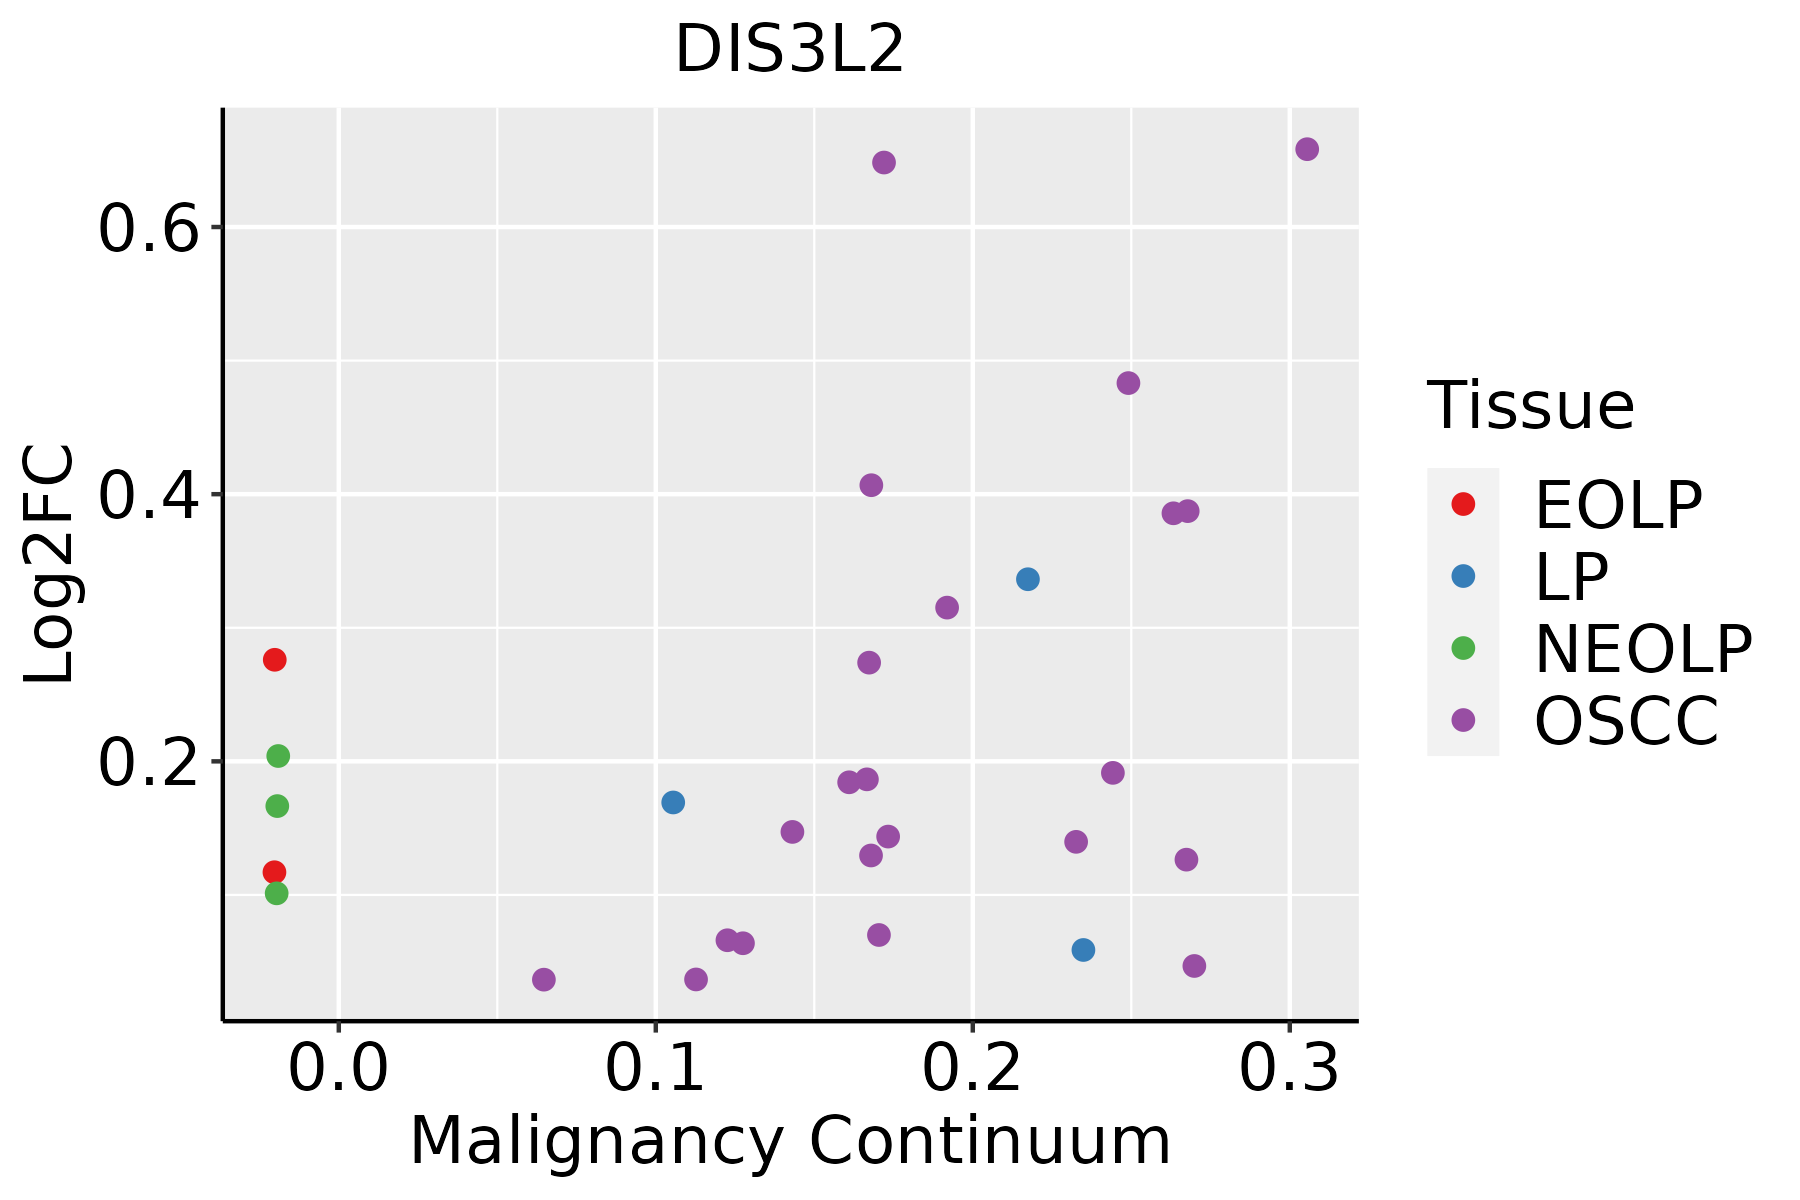 | EOLP: Erosive Oral lichen planus |
| LP: leukoplakia |
| NEOLP: Non-erosive oral lichen planus |
| OSCC: Oral squamous cell carcinoma |
| Thyroid |  | ATC: Anaplastic thyroid cancer |
| HT: Hashimoto's thyroiditis |
| PTC: Papillary thyroid cancer |
| GO ID | Tissue | Disease Stage | Description | Gene Ratio | Bg Ratio | pvalue | p.adjust | Count |
| GO:1903311112 | Thyroid | PTC | regulation of mRNA metabolic process | 181/5968 | 288/18723 | 1.60e-27 | 5.94e-25 | 181 |
| GO:0006401112 | Thyroid | PTC | RNA catabolic process | 163/5968 | 278/18723 | 2.13e-20 | 3.27e-18 | 163 |
| GO:0006402112 | Thyroid | PTC | mRNA catabolic process | 139/5968 | 232/18723 | 9.59e-19 | 1.12e-16 | 139 |
| GO:0006417113 | Thyroid | PTC | regulation of translation | 236/5968 | 468/18723 | 2.70e-17 | 2.52e-15 | 236 |
| GO:0034655112 | Thyroid | PTC | nucleobase-containing compound catabolic process | 211/5968 | 407/18723 | 2.72e-17 | 2.52e-15 | 211 |
| GO:0000956111 | Thyroid | PTC | nuclear-transcribed mRNA catabolic process | 78/5968 | 112/18723 | 2.37e-16 | 1.94e-14 | 78 |
| GO:00346608 | Thyroid | PTC | ncRNA metabolic process | 239/5968 | 485/18723 | 5.54e-16 | 4.26e-14 | 239 |
| GO:0046700111 | Thyroid | PTC | heterocycle catabolic process | 221/5968 | 445/18723 | 2.43e-15 | 1.72e-13 | 221 |
| GO:0044270111 | Thyroid | PTC | cellular nitrogen compound catabolic process | 223/5968 | 451/18723 | 3.34e-15 | 2.31e-13 | 223 |
| GO:0019439111 | Thyroid | PTC | aromatic compound catabolic process | 225/5968 | 467/18723 | 8.51e-14 | 4.71e-12 | 225 |
| GO:1903313110 | Thyroid | PTC | positive regulation of mRNA metabolic process | 76/5968 | 118/18723 | 3.60e-13 | 1.80e-11 | 76 |
| GO:1901361111 | Thyroid | PTC | organic cyclic compound catabolic process | 231/5968 | 495/18723 | 2.55e-12 | 1.12e-10 | 231 |
| GO:0043487111 | Thyroid | PTC | regulation of RNA stability | 97/5968 | 170/18723 | 9.51e-12 | 3.97e-10 | 97 |
| GO:0061013111 | Thyroid | PTC | regulation of mRNA catabolic process | 94/5968 | 166/18723 | 3.55e-11 | 1.29e-09 | 94 |
| GO:0043488111 | Thyroid | PTC | regulation of mRNA stability | 90/5968 | 158/18723 | 5.98e-11 | 2.11e-09 | 90 |
| GO:006115719 | Thyroid | PTC | mRNA destabilization | 52/5968 | 84/18723 | 1.40e-08 | 3.30e-07 | 52 |
| GO:006101419 | Thyroid | PTC | positive regulation of mRNA catabolic process | 53/5968 | 87/18723 | 2.25e-08 | 5.16e-07 | 53 |
| GO:005077919 | Thyroid | PTC | RNA destabilization | 53/5968 | 88/18723 | 3.91e-08 | 8.51e-07 | 53 |
| GO:01400148 | Thyroid | PTC | mitotic nuclear division | 135/5968 | 287/18723 | 4.90e-08 | 1.04e-06 | 135 |
| GO:00002915 | Thyroid | PTC | nuclear-transcribed mRNA catabolic process, exonucleolytic | 17/5968 | 19/18723 | 2.98e-07 | 5.09e-06 | 17 |
| Hugo Symbol | Variant Class | Variant Classification | dbSNP RS | HGVSc | HGVSp | HGVSp Short | SWISSPROT | BIOTYPE | SIFT | PolyPhen | Tumor Sample Barcode | Tissue | Histology | Sex | Age | Stage | Therapy Types | Drugs | Outcome |
| DIS3L2 | SNV | Missense_Mutation | rs376340398 | c.1459N>T | p.Arg487Cys | p.R487C | Q8IYB7 | protein_coding | tolerated(0.14) | benign(0.224) | TCGA-A2-A0EY-01 | Breast | breast invasive carcinoma | Female | <65 | I/II | Chemotherapy | adriamycin | SD |
| DIS3L2 | SNV | Missense_Mutation | novel | c.478N>A | p.Asp160Asn | p.D160N | Q8IYB7 | protein_coding | tolerated(0.4) | benign(0.071) | TCGA-AC-A5XS-01 | Breast | breast invasive carcinoma | Female | >=65 | I/II | Hormone Therapy | femara | SD |
| DIS3L2 | SNV | Missense_Mutation | novel | c.665N>C | p.Arg222Thr | p.R222T | Q8IYB7 | protein_coding | tolerated(0.49) | benign(0.003) | TCGA-AC-A5XS-01 | Breast | breast invasive carcinoma | Female | >=65 | I/II | Hormone Therapy | femara | SD |
| DIS3L2 | SNV | Missense_Mutation | novel | c.2366A>G | p.Tyr789Cys | p.Y789C | Q8IYB7 | protein_coding | deleterious(0) | benign(0.073) | TCGA-BH-A18G-01 | Breast | breast invasive carcinoma | Female | >=65 | I/II | Unknown | Unknown | SD |
| DIS3L2 | SNV | Missense_Mutation | rs770702636 | c.1693N>A | p.Gly565Arg | p.G565R | Q8IYB7 | protein_coding | deleterious(0.01) | benign(0.427) | TCGA-D8-A27N-01 | Breast | breast invasive carcinoma | Female | <65 | III/IV | Chemotherapy | taxol+adriamycin+cyclophosphamide+herceptin | SD |
| DIS3L2 | SNV | Missense_Mutation | novel | c.983A>G | p.Glu328Gly | p.E328G | Q8IYB7 | protein_coding | deleterious(0) | possibly_damaging(0.696) | TCGA-EW-A1IW-01 | Breast | breast invasive carcinoma | Female | >=65 | I/II | Hormone Therapy | aromasin | SD |
| DIS3L2 | SNV | Missense_Mutation | novel | c.2376N>C | p.Gln792His | p.Q792H | Q8IYB7 | protein_coding | deleterious(0.03) | benign(0) | TCGA-C5-A7X8-01 | Cervix | cervical & endocervical cancer | Female | <65 | I/II | Chemotherapy | cisplatin | SD |
| DIS3L2 | SNV | Missense_Mutation | novel | c.1417G>A | p.Glu473Lys | p.E473K | Q8IYB7 | protein_coding | tolerated(0.14) | benign(0.007) | TCGA-IR-A3LA-01 | Cervix | cervical & endocervical cancer | Female | <65 | I/II | Chemotherapy | cisplatin | CR |
| DIS3L2 | SNV | Missense_Mutation | novel | c.821G>A | p.Arg274Gln | p.R274Q | Q8IYB7 | protein_coding | deleterious(0) | probably_damaging(0.986) | TCGA-AA-3984-01 | Colorectum | colon adenocarcinoma | Female | <65 | I/II | Unknown | Unknown | SD |
| DIS3L2 | SNV | Missense_Mutation | rs368280072 | c.2381N>A | p.Arg794His | p.R794H | Q8IYB7 | protein_coding | deleterious(0) | benign(0.356) | TCGA-AA-A010-01 | Colorectum | colon adenocarcinoma | Female | <65 | I/II | Chemotherapy | folinic | CR |


