
|
|||||
|
 | |
| |
| |
| |
| |
| |
|
Gene: CTSL |
Gene summary for CTSL |
| Gene information | Species | Human | Gene symbol | CTSL | Gene ID | 1514 |
| Gene name | cathepsin L | |
| Gene Alias | CATL | |
| Cytomap | 9q21.33 | |
| Gene Type | protein-coding | GO ID | GO:0001775 | UniProtAcc | A0A024R276 |
Top |
Malignant transformation analysis |
| Identification of the aberrant gene expression in precancerous and cancerous lesions by comparing the gene expression of stem-like cells in diseased tissues with normal stem cells |
| Entrez ID | Symbol | Replicates | Species | Organ | Tissue | Adj P-value | Log2FC | Malignancy |
| 1514 | CTSL | AEH-subject1 | Human | Endometrium | AEH | 4.79e-03 | -1.85e-01 | -0.3059 |
| 1514 | CTSL | AEH-subject2 | Human | Endometrium | AEH | 4.71e-02 | -1.72e-01 | -0.2525 |
| 1514 | CTSL | AEH-subject5 | Human | Endometrium | AEH | 4.58e-06 | -2.75e-01 | -0.2953 |
| 1514 | CTSL | EEC-subject1 | Human | Endometrium | EEC | 3.06e-06 | -2.28e-01 | -0.2682 |
| 1514 | CTSL | EEC-subject2 | Human | Endometrium | EEC | 1.02e-07 | -2.21e-01 | -0.2607 |
| 1514 | CTSL | EEC-subject3 | Human | Endometrium | EEC | 1.48e-29 | -2.28e-01 | -0.2525 |
| 1514 | CTSL | EEC-subject4 | Human | Endometrium | EEC | 6.26e-04 | -1.14e-01 | -0.2571 |
| 1514 | CTSL | EEC-subject5 | Human | Endometrium | EEC | 3.98e-02 | -8.70e-02 | -0.249 |
| 1514 | CTSL | GSM5276934 | Human | Endometrium | EEC | 1.12e-24 | 7.89e-01 | -0.0913 |
| 1514 | CTSL | GSM5276937 | Human | Endometrium | EEC | 2.93e-38 | 1.07e+00 | -0.0897 |
| 1514 | CTSL | GSM6177620_NYU_UCEC1_lib1_lib1 | Human | Endometrium | EEC | 3.75e-11 | -9.39e-02 | -0.1869 |
| 1514 | CTSL | GSM6177620_NYU_UCEC1_lib2_lib2 | Human | Endometrium | EEC | 6.18e-10 | -2.59e-01 | -0.1875 |
| 1514 | CTSL | GSM6177620_NYU_UCEC1_lib3_lib3 | Human | Endometrium | EEC | 3.30e-12 | -2.11e-01 | -0.1883 |
| 1514 | CTSL | GSM6177621_NYU_UCEC2_lib1_lib1 | Human | Endometrium | EEC | 6.68e-18 | -1.99e-01 | -0.1934 |
| 1514 | CTSL | GSM6177622_NYU_UCEC3_lib1_lib1 | Human | Endometrium | EEC | 9.67e-26 | -2.75e-01 | -0.1917 |
| 1514 | CTSL | GSM6177622_NYU_UCEC3_lib2_lib2 | Human | Endometrium | EEC | 2.69e-11 | -2.48e-01 | -0.1916 |
| 1514 | CTSL | LZE2T | Human | Esophagus | ESCC | 2.61e-07 | 6.09e-01 | 0.082 |
| 1514 | CTSL | LZE4T | Human | Esophagus | ESCC | 2.01e-13 | 2.43e-01 | 0.0811 |
| 1514 | CTSL | LZE6T | Human | Esophagus | ESCC | 1.10e-07 | 1.08e+00 | 0.0845 |
| 1514 | CTSL | P2T-E | Human | Esophagus | ESCC | 1.24e-15 | 3.13e-01 | 0.1177 |
| Page: 1 2 3 4 5 6 |
| Tissue | Expression Dynamics | Abbreviation |
| Endometrium | 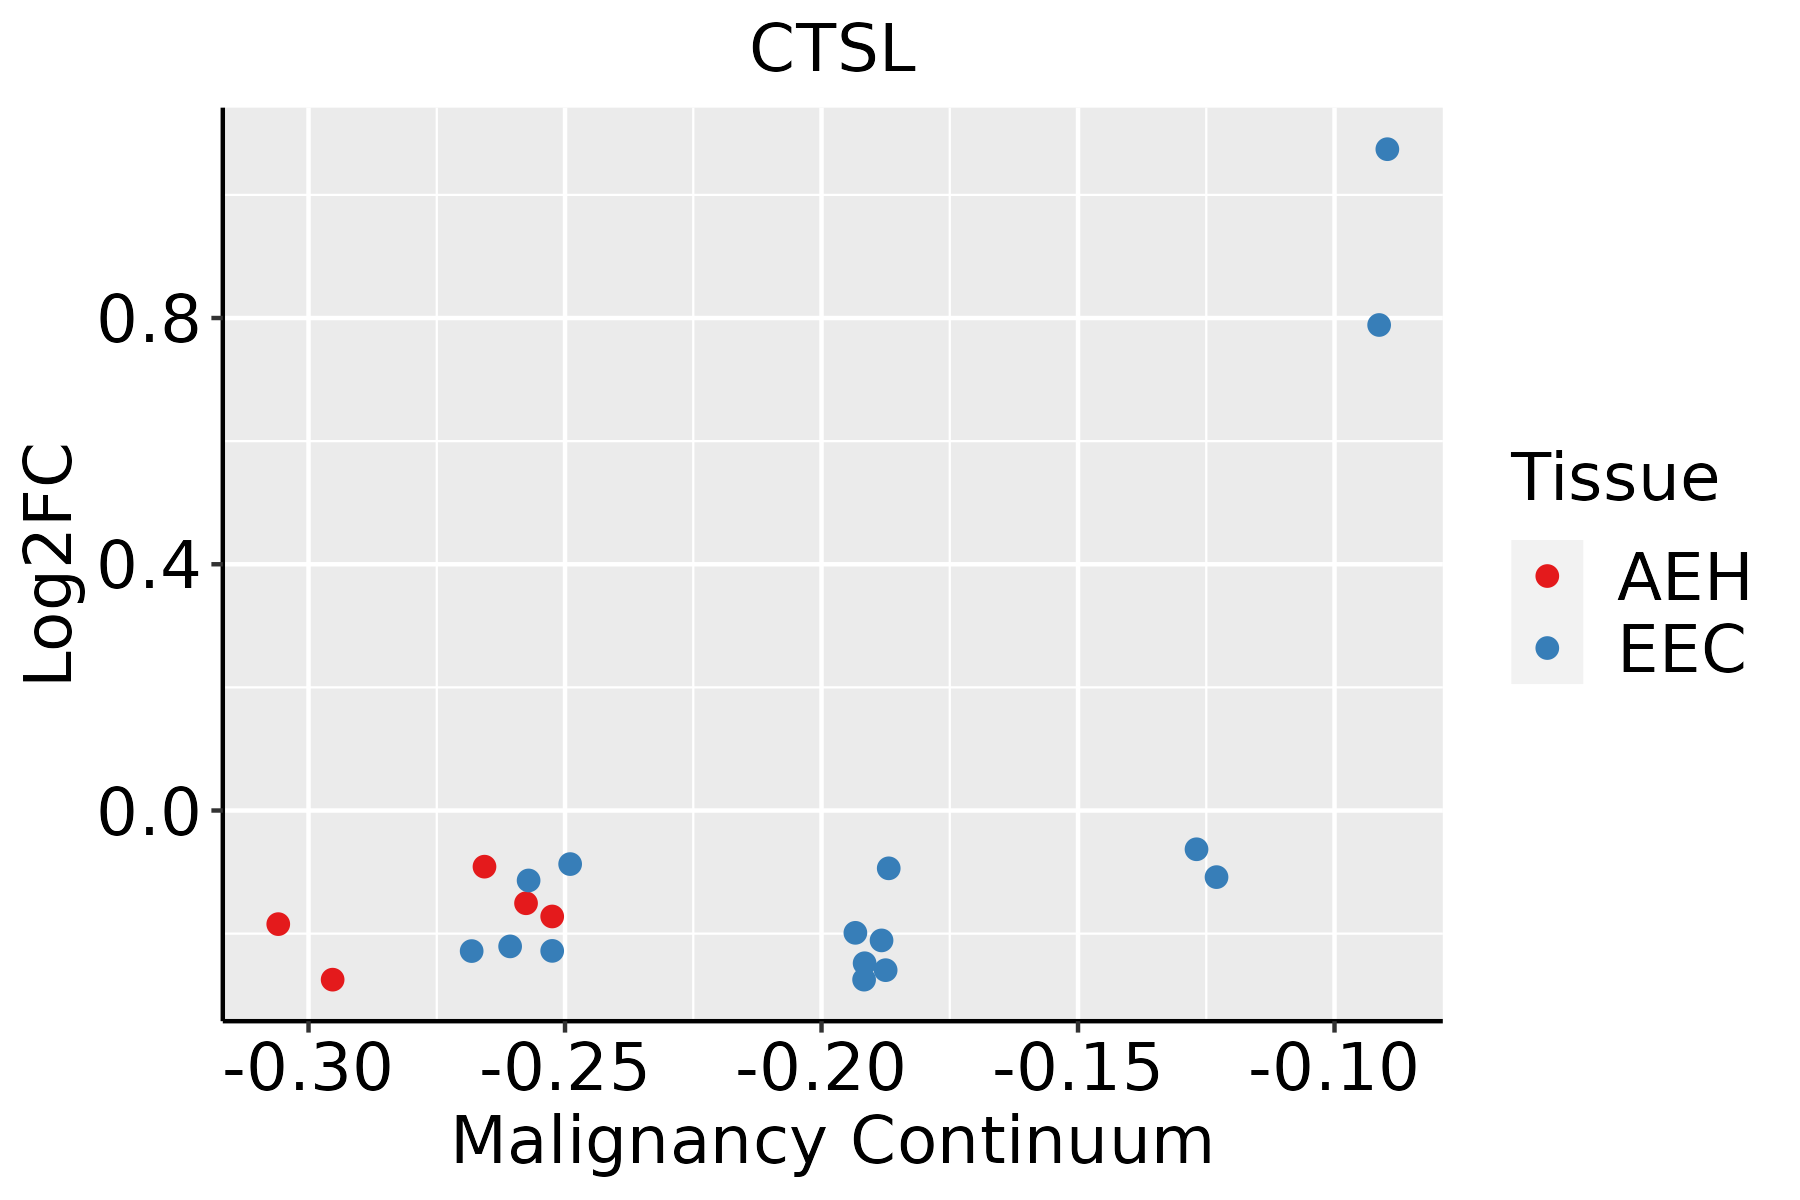 | AEH: Atypical endometrial hyperplasia |
| EEC: Endometrioid Cancer | ||
| Esophagus |  | ESCC: Esophageal squamous cell carcinoma |
| HGIN: High-grade intraepithelial neoplasias | ||
| LGIN: Low-grade intraepithelial neoplasias | ||
| Liver | 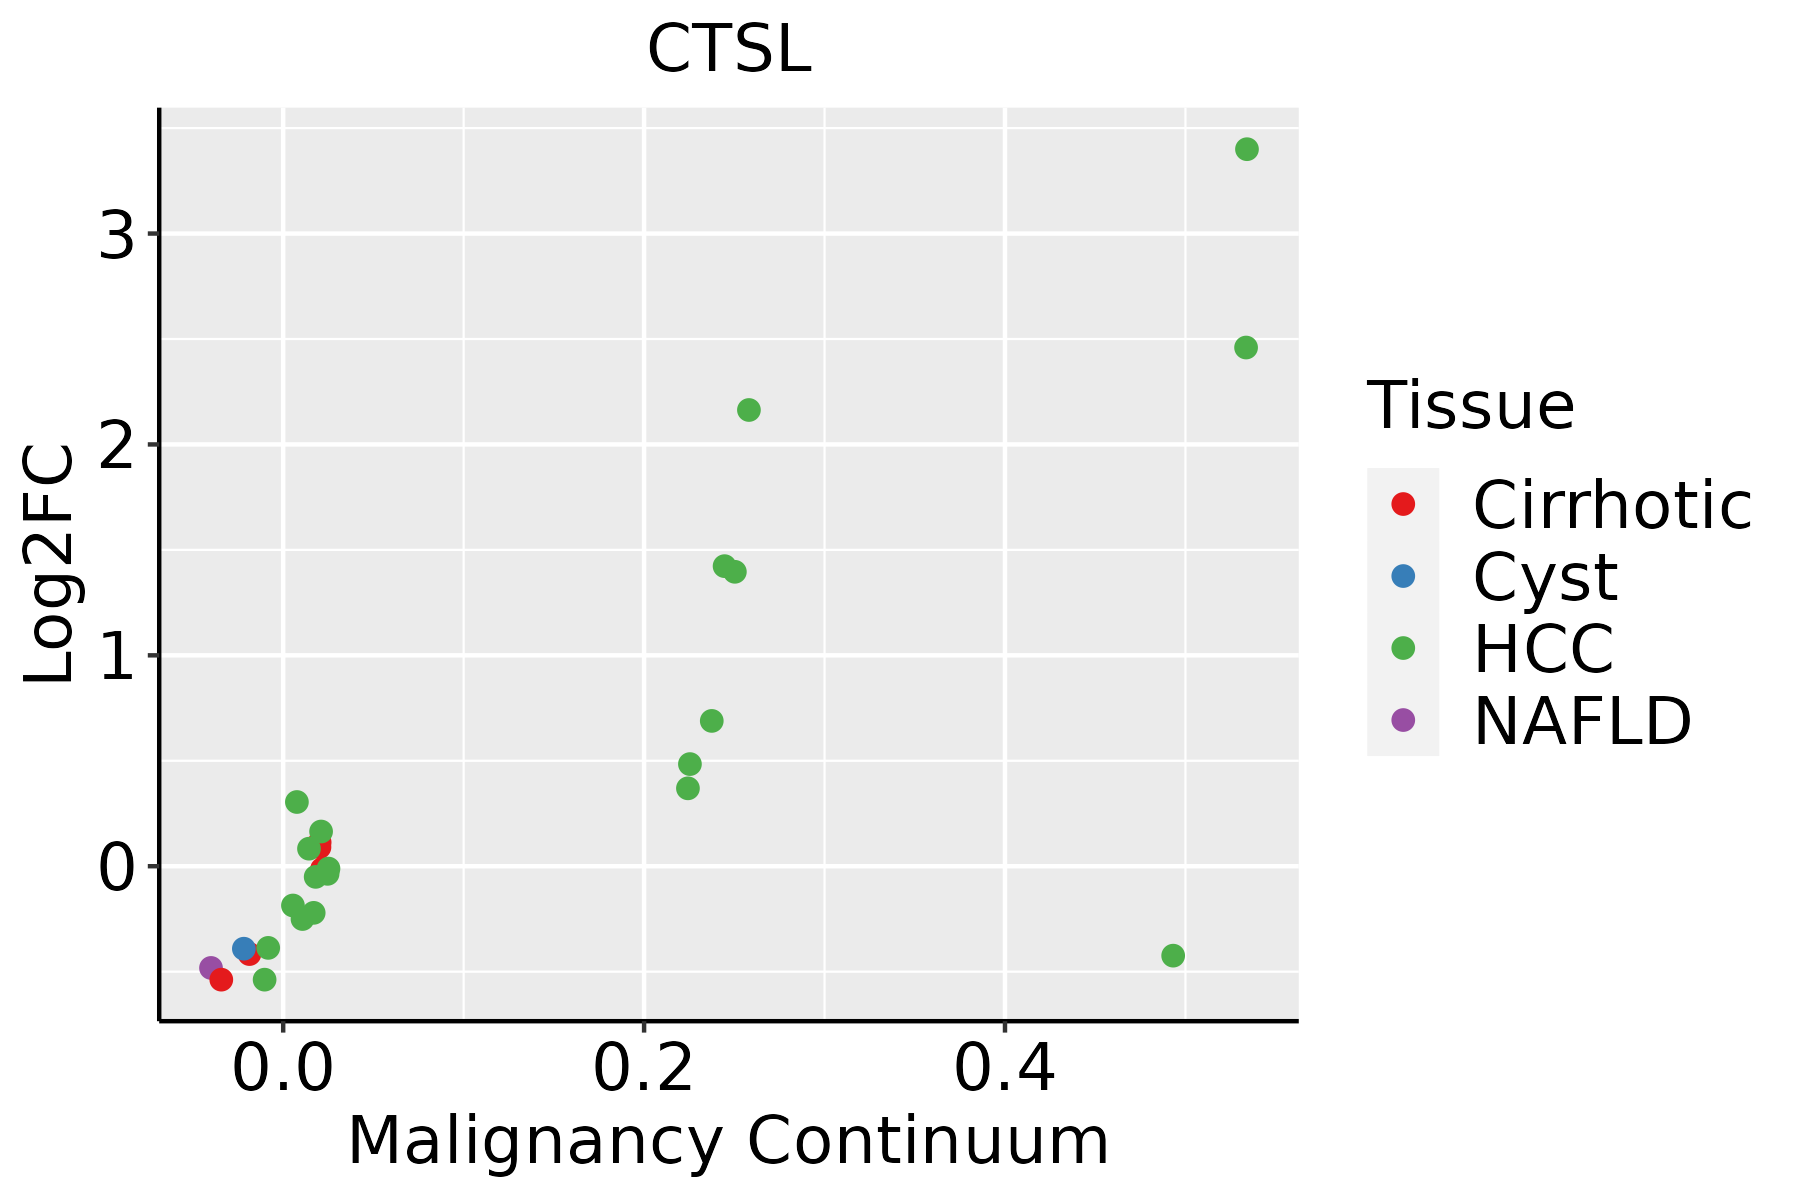 | HCC: Hepatocellular carcinoma |
| NAFLD: Non-alcoholic fatty liver disease | ||
| Oral Cavity |  | EOLP: Erosive Oral lichen planus |
| LP: leukoplakia | ||
| NEOLP: Non-erosive oral lichen planus | ||
| OSCC: Oral squamous cell carcinoma | ||
| Skin | 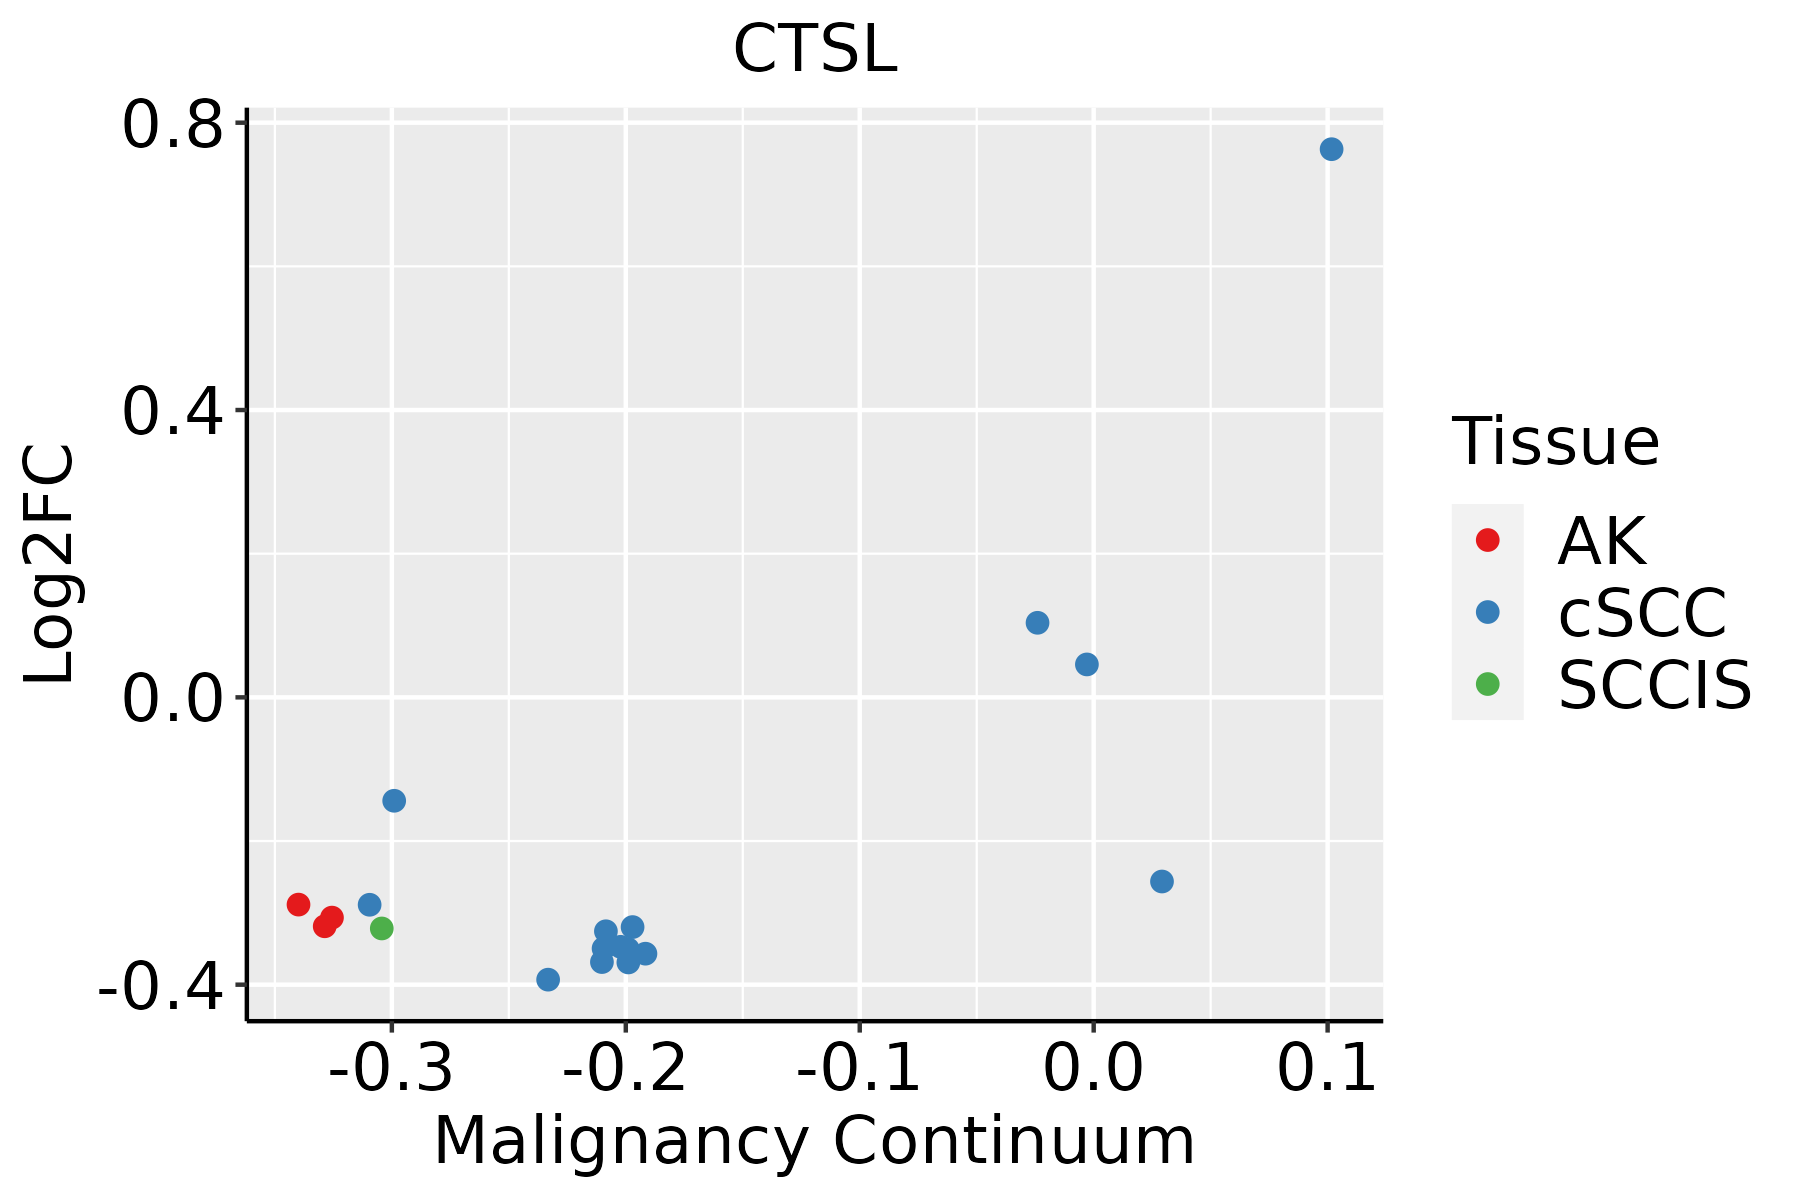 | AK: Actinic keratosis |
| cSCC: Cutaneous squamous cell carcinoma | ||
| SCCIS:squamous cell carcinoma in situ | ||
| Thyroid | 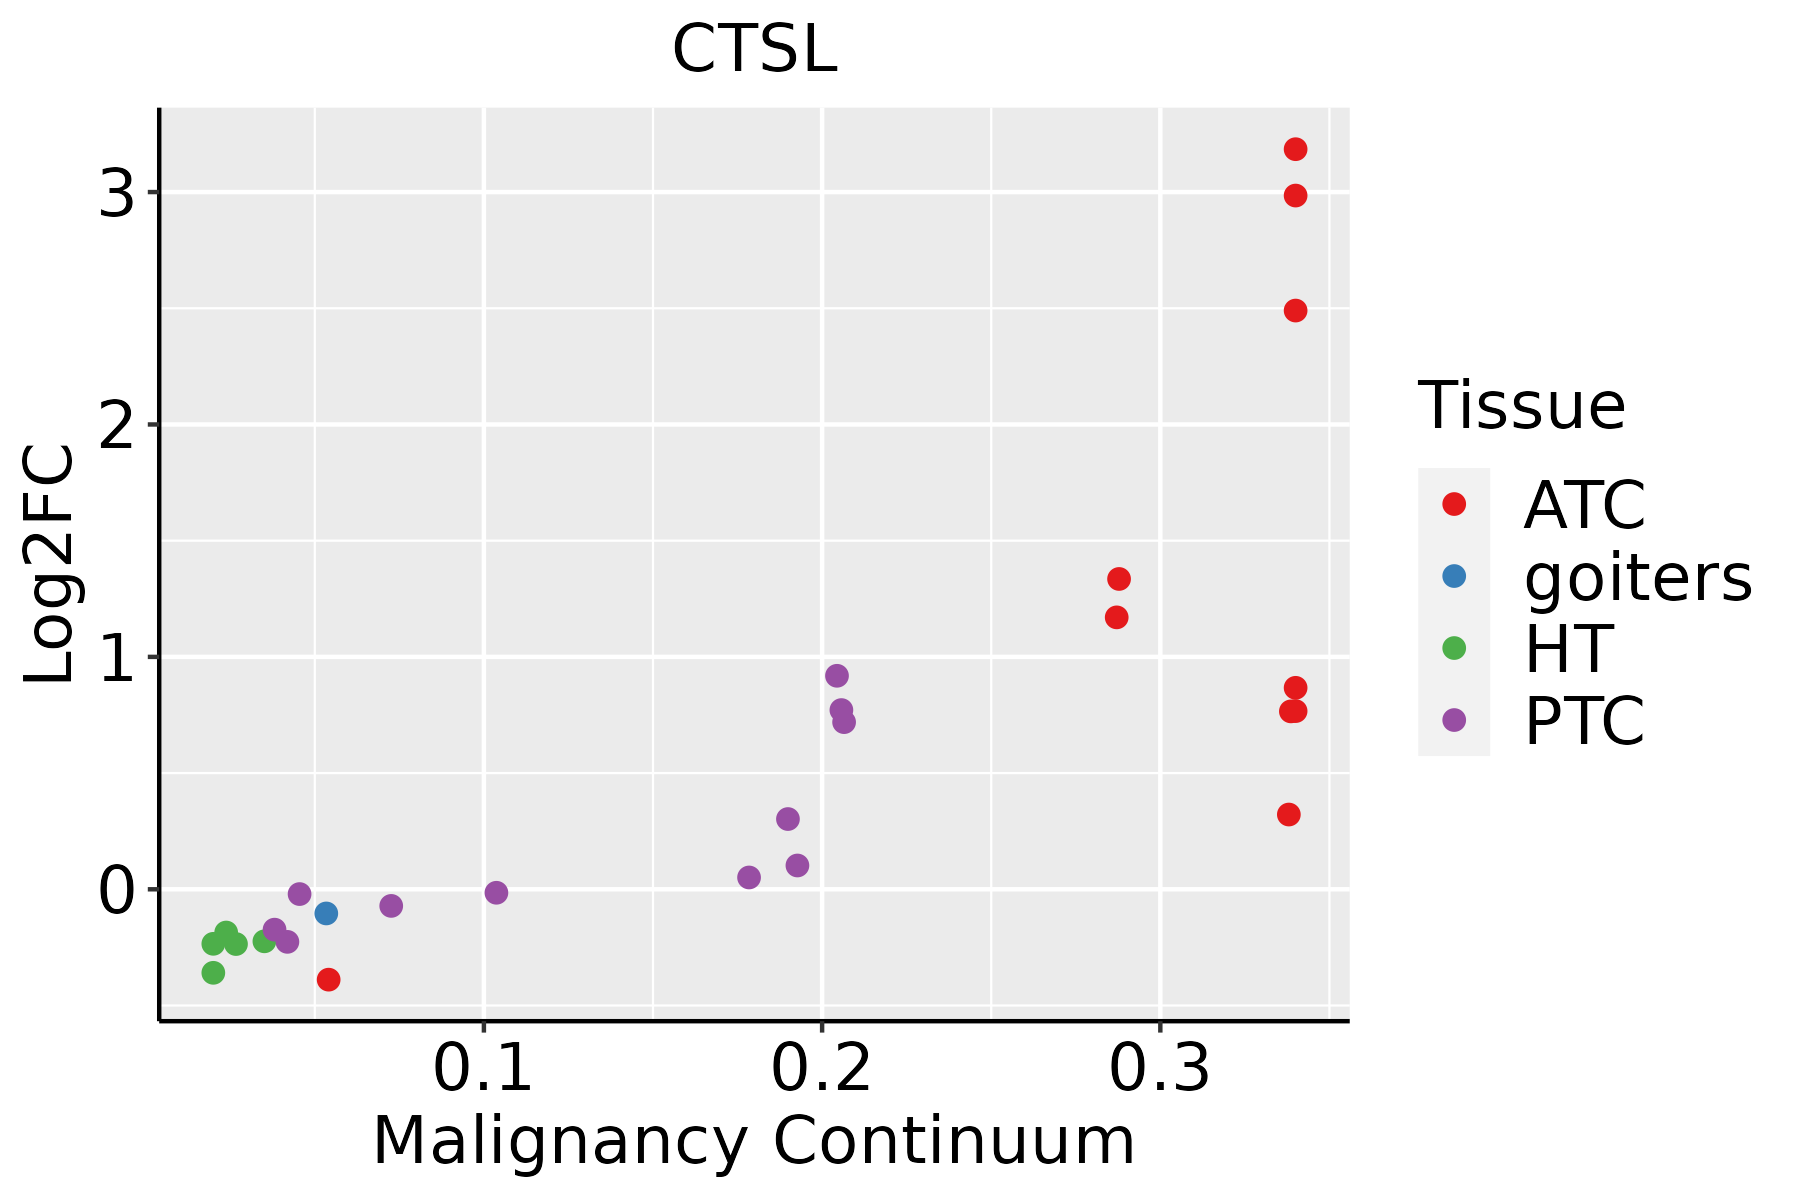 | ATC: Anaplastic thyroid cancer |
| HT: Hashimoto's thyroiditis | ||
| PTC: Papillary thyroid cancer |
| ∗log2FC in expression of this searched gene in stem-like cells from each diseased tissue sample relative to stem-like cells in normal samples in each tissue plotted against the malignancy continuum. Samples are colored based on if they are from different disease stage. |
Top |
Malignant transformation related pathway analysis |
| Find out the enriched GO biological processes and KEGG pathways involved in transition from healthy to precancer to cancer |
| Tissue | Disease Stage | Enriched GO biological Processes |
| Colorectum | AD |  |
| Colorectum | SER |  |
| Colorectum | MSS |  |
| Colorectum | MSI-H |  |
| Colorectum | FAP |  |
| ∗Top 15 enriched GO BP terms are showed in the bar plot of each disease state in each tissue. Each row represents a significant GO biological process which is colored according to the -log10(p.adjust). |
| Page: 1 2 3 4 5 6 7 8 9 |
| GO ID | Tissue | Disease Stage | Description | Gene Ratio | Bg Ratio | pvalue | p.adjust | Count |
| GO:00164859 | Thyroid | PTC | protein processing | 95/5968 | 225/18723 | 6.60e-04 | 4.15e-03 | 95 |
| GO:0002504110 | Thyroid | PTC | antigen processing and presentation of peptide or polysaccharide antigen via MHC class II | 21/5968 | 36/18723 | 9.36e-04 | 5.68e-03 | 21 |
| GO:0019886111 | Thyroid | PTC | antigen processing and presentation of exogenous peptide antigen via MHC class II | 18/5968 | 30/18723 | 1.38e-03 | 7.74e-03 | 18 |
| GO:009706612 | Thyroid | PTC | response to thyroid hormone | 16/5968 | 26/18723 | 1.75e-03 | 9.51e-03 | 16 |
| GO:00718872 | Thyroid | PTC | leukocyte apoptotic process | 48/5968 | 106/18723 | 2.58e-03 | 1.32e-02 | 48 |
| GO:0002495110 | Thyroid | PTC | antigen processing and presentation of peptide antigen via MHC class II | 19/5968 | 34/18723 | 3.21e-03 | 1.57e-02 | 19 |
| GO:009706711 | Thyroid | PTC | cellular response to thyroid hormone stimulus | 11/5968 | 17/18723 | 5.46e-03 | 2.49e-02 | 11 |
| GO:00091003 | Thyroid | PTC | glycoprotein metabolic process | 147/5968 | 387/18723 | 5.87e-03 | 2.64e-02 | 147 |
| GO:001603234 | Thyroid | ATC | viral process | 241/6293 | 415/18723 | 5.50e-25 | 2.04e-22 | 241 |
| GO:001905835 | Thyroid | ATC | viral life cycle | 173/6293 | 317/18723 | 9.22e-15 | 5.50e-13 | 173 |
| GO:004440334 | Thyroid | ATC | biological process involved in symbiotic interaction | 153/6293 | 290/18723 | 1.12e-11 | 4.12e-10 | 153 |
| GO:005170134 | Thyroid | ATC | biological process involved in interaction with host | 112/6293 | 203/18723 | 1.93e-10 | 5.76e-09 | 112 |
| GO:005212633 | Thyroid | ATC | movement in host environment | 94/6293 | 175/18723 | 3.20e-08 | 6.00e-07 | 94 |
| GO:000689826 | Thyroid | ATC | receptor-mediated endocytosis | 118/6293 | 244/18723 | 1.17e-06 | 1.50e-05 | 118 |
| GO:0051604110 | Thyroid | ATC | protein maturation | 136/6293 | 294/18723 | 4.00e-06 | 4.42e-05 | 136 |
| GO:001988229 | Thyroid | ATC | antigen processing and presentation | 57/6293 | 106/18723 | 1.48e-05 | 1.39e-04 | 57 |
| GO:004440933 | Thyroid | ATC | entry into host | 76/6293 | 151/18723 | 1.54e-05 | 1.43e-04 | 76 |
| GO:004671833 | Thyroid | ATC | viral entry into host cell | 72/6293 | 144/18723 | 3.38e-05 | 2.80e-04 | 72 |
| GO:007188711 | Thyroid | ATC | leukocyte apoptotic process | 53/6293 | 106/18723 | 3.48e-04 | 2.16e-03 | 53 |
| GO:006102511 | Thyroid | ATC | membrane fusion | 76/6293 | 163/18723 | 3.68e-04 | 2.27e-03 | 76 |
| Page: 1 2 3 4 5 6 7 8 9 10 11 12 13 14 15 |
| Pathway ID | Tissue | Disease Stage | Description | Gene Ratio | Bg Ratio | pvalue | p.adjust | qvalue | Count |
| hsa0541826 | Endometrium | AEH | Fluid shear stress and atherosclerosis | 43/1197 | 139/8465 | 2.47e-07 | 3.49e-06 | 2.55e-06 | 43 |
| hsa0520518 | Endometrium | AEH | Proteoglycans in cancer | 53/1197 | 205/8465 | 5.43e-06 | 6.53e-05 | 4.78e-05 | 53 |
| hsa0461225 | Endometrium | AEH | Antigen processing and presentation | 26/1197 | 78/8465 | 1.33e-05 | 1.55e-04 | 1.13e-04 | 26 |
| hsa0414524 | Endometrium | AEH | Phagosome | 41/1197 | 152/8465 | 2.12e-05 | 2.22e-04 | 1.63e-04 | 41 |
| hsa0532316 | Endometrium | AEH | Rheumatoid arthritis | 23/1197 | 93/8465 | 4.43e-03 | 2.46e-02 | 1.80e-02 | 23 |
| hsa0421010 | Endometrium | AEH | Apoptosis | 30/1197 | 136/8465 | 7.72e-03 | 4.05e-02 | 2.96e-02 | 30 |
| hsa05418112 | Endometrium | AEH | Fluid shear stress and atherosclerosis | 43/1197 | 139/8465 | 2.47e-07 | 3.49e-06 | 2.55e-06 | 43 |
| hsa0520519 | Endometrium | AEH | Proteoglycans in cancer | 53/1197 | 205/8465 | 5.43e-06 | 6.53e-05 | 4.78e-05 | 53 |
| hsa04612111 | Endometrium | AEH | Antigen processing and presentation | 26/1197 | 78/8465 | 1.33e-05 | 1.55e-04 | 1.13e-04 | 26 |
| hsa04145111 | Endometrium | AEH | Phagosome | 41/1197 | 152/8465 | 2.12e-05 | 2.22e-04 | 1.63e-04 | 41 |
| hsa0532317 | Endometrium | AEH | Rheumatoid arthritis | 23/1197 | 93/8465 | 4.43e-03 | 2.46e-02 | 1.80e-02 | 23 |
| hsa0421015 | Endometrium | AEH | Apoptosis | 30/1197 | 136/8465 | 7.72e-03 | 4.05e-02 | 2.96e-02 | 30 |
| hsa0541827 | Endometrium | EEC | Fluid shear stress and atherosclerosis | 45/1237 | 139/8465 | 7.76e-08 | 1.22e-06 | 9.07e-07 | 45 |
| hsa0461226 | Endometrium | EEC | Antigen processing and presentation | 27/1237 | 78/8465 | 7.66e-06 | 9.58e-05 | 7.14e-05 | 27 |
| hsa0414525 | Endometrium | EEC | Phagosome | 42/1237 | 152/8465 | 2.01e-05 | 2.28e-04 | 1.70e-04 | 42 |
| hsa0520524 | Endometrium | EEC | Proteoglycans in cancer | 52/1237 | 205/8465 | 3.01e-05 | 3.19e-04 | 2.38e-04 | 52 |
| hsa0532323 | Endometrium | EEC | Rheumatoid arthritis | 24/1237 | 93/8465 | 3.14e-03 | 1.78e-02 | 1.33e-02 | 24 |
| hsa0421024 | Endometrium | EEC | Apoptosis | 31/1237 | 136/8465 | 6.72e-03 | 3.25e-02 | 2.42e-02 | 31 |
| hsa0541836 | Endometrium | EEC | Fluid shear stress and atherosclerosis | 45/1237 | 139/8465 | 7.76e-08 | 1.22e-06 | 9.07e-07 | 45 |
| hsa0461235 | Endometrium | EEC | Antigen processing and presentation | 27/1237 | 78/8465 | 7.66e-06 | 9.58e-05 | 7.14e-05 | 27 |
| Page: 1 2 3 4 5 6 |
Top |
Cell-cell communication analysis |
| Identification of potential cell-cell interactions between two cell types and their ligand-receptor pairs for different disease states |
| Ligand | Receptor | LRpair | Pathway | Tissue | Disease Stage |
| Page: 1 |
Top |
Single-cell gene regulatory network inference analysis |
| Find out the significant the regulons (TFs) and the target genes of each regulon across cell types for different disease states |
| TF | Cell Type | Tissue | Disease Stage | Target Gene | RSS | Regulon Activity |
| ∗The dot plots of a searched regulon are shown for all cell subpopulations in each disease state of each tissue based on the regulon specific score inferred using pySCENIC and by calculating the average expression. |
| Page: 1 |
Top |
Somatic mutation of malignant transformation related genes |
| Annotation of somatic variants for genes involved in malignant transformation |
| Hugo Symbol | Variant Class | Variant Classification | dbSNP RS | HGVSc | HGVSp | HGVSp Short | SWISSPROT | BIOTYPE | SIFT | PolyPhen | Tumor Sample Barcode | Tissue | Histology | Sex | Age | Stage | Therapy Types | Drugs | Outcome |
| CTSL | SNV | Missense_Mutation | c.751G>A | p.Ala251Thr | p.A251T | P07711 | protein_coding | deleterious(0.03) | possibly_damaging(0.534) | TCGA-A8-A09Z-01 | Breast | breast invasive carcinoma | Female | >=65 | I/II | Unknown | Unknown | SD | |
| CTSL | SNV | Missense_Mutation | c.724G>A | p.Val242Met | p.V242M | P07711 | protein_coding | tolerated(0.05) | probably_damaging(0.931) | TCGA-AO-A128-01 | Breast | breast invasive carcinoma | Female | <65 | I/II | Chemotherapy | doxorubicin | SD | |
| CTSL | SNV | Missense_Mutation | c.545N>C | p.Leu182Pro | p.L182P | P07711 | protein_coding | deleterious(0.01) | probably_damaging(0.998) | TCGA-AA-3715-01 | Colorectum | colon adenocarcinoma | Male | >=65 | I/II | Unknown | Unknown | PD | |
| CTSL | SNV | Missense_Mutation | c.542N>A | p.Gly181Asp | p.G181D | P07711 | protein_coding | deleterious(0) | probably_damaging(1) | TCGA-AA-3811-01 | Colorectum | colon adenocarcinoma | Female | >=65 | III/IV | Unknown | Unknown | PD | |
| CTSL | SNV | Missense_Mutation | c.956G>T | p.Arg319Ile | p.R319I | P07711 | protein_coding | deleterious(0) | benign(0.007) | TCGA-AA-A00N-01 | Colorectum | colon adenocarcinoma | Male | >=65 | I/II | Unknown | Unknown | PD | |
| CTSL | SNV | Missense_Mutation | c.450G>T | p.Gln150His | p.Q150H | P07711 | protein_coding | deleterious(0.01) | probably_damaging(0.999) | TCGA-G4-6588-01 | Colorectum | colon adenocarcinoma | Female | <65 | I/II | Unknown | Unknown | SD | |
| CTSL | SNV | Missense_Mutation | novel | c.774N>A | p.Phe258Leu | p.F258L | P07711 | protein_coding | tolerated(0.21) | possibly_damaging(0.686) | TCGA-AG-A002-01 | Colorectum | rectum adenocarcinoma | Male | <65 | I/II | Unknown | Unknown | SD |
| CTSL | SNV | Missense_Mutation | c.956N>T | p.Arg319Ile | p.R319I | P07711 | protein_coding | deleterious(0) | benign(0.007) | TCGA-F5-6814-01 | Colorectum | rectum adenocarcinoma | Male | <65 | I/II | Unknown | Unknown | SD | |
| CTSL | SNV | Missense_Mutation | rs200642380 | c.119N>G | p.Tyr40Cys | p.Y40C | P07711 | protein_coding | deleterious(0) | probably_damaging(1) | TCGA-A5-A0G1-01 | Endometrium | uterine corpus endometrioid carcinoma | Female | >=65 | I/II | Unknown | Unknown | SD |
| CTSL | SNV | Missense_Mutation | rs769759603 | c.121N>A | p.Gly41Ser | p.G41S | P07711 | protein_coding | tolerated(1) | benign(0.006) | TCGA-A5-A0G2-01 | Endometrium | uterine corpus endometrioid carcinoma | Female | <65 | III/IV | Unknown | Unknown | SD |
| Page: 1 2 3 4 |
Top |
Related drugs of malignant transformation related genes |
| Identification of chemicals and drugs interact with genes involved in malignant transfromation |
| (DGIdb 4.0) |
| Entrez ID | Symbol | Category | Interaction Types | Drug Claim Name | Drug Name | PMIDs |
| 1514 | CTSL | PROTEASE, DRUGGABLE GENOME, ENZYME | PMID27998201-Compound-6 | |||
| 1514 | CTSL | PROTEASE, DRUGGABLE GENOME, ENZYME | inhibitor | 405067337 | ||
| 1514 | CTSL | PROTEASE, DRUGGABLE GENOME, ENZYME | HORMONES | 16099855 | ||
| 1514 | CTSL | PROTEASE, DRUGGABLE GENOME, ENZYME | PMID27998201-Compound-19 | |||
| 1514 | CTSL | PROTEASE, DRUGGABLE GENOME, ENZYME | KGP94 | |||
| 1514 | CTSL | PROTEASE, DRUGGABLE GENOME, ENZYME | PMID27998201-Compound-5 | |||
| 1514 | CTSL | PROTEASE, DRUGGABLE GENOME, ENZYME | Phenylalanine derivative 1 | |||
| 1514 | CTSL | PROTEASE, DRUGGABLE GENOME, ENZYME | inhibitor | 318164817 | ||
| 1514 | CTSL | PROTEASE, DRUGGABLE GENOME, ENZYME | PMID27998201-Compound-1 | |||
| 1514 | CTSL | PROTEASE, DRUGGABLE GENOME, ENZYME | PMID27998201-Compound-9 |
| Page: 1 2 |

Copyright 2023-Present -The University of Texas Health Science Center at Houston |