
|
|||||
|
 | |
| |
| |
| |
| |
| |
|
Gene: CITED2 |
Gene summary for CITED2 |
| Gene information | Species | Human | Gene symbol | CITED2 | Gene ID | 10370 |
| Gene name | Cbp/p300 interacting transactivator with Glu/Asp rich carboxy-terminal domain 2 | |
| Gene Alias | ASD8 | |
| Cytomap | 6q24.1 | |
| Gene Type | protein-coding | GO ID | GO:0000003 | UniProtAcc | D9ZGF1 |
Top |
Malignant transformation analysis |
| Identification of the aberrant gene expression in precancerous and cancerous lesions by comparing the gene expression of stem-like cells in diseased tissues with normal stem cells |
| Entrez ID | Symbol | Replicates | Species | Organ | Tissue | Adj P-value | Log2FC | Malignancy |
| 10370 | CITED2 | LZE7T | Human | Esophagus | ESCC | 1.86e-04 | -5.27e-02 | 0.0667 |
| 10370 | CITED2 | LZE8T | Human | Esophagus | ESCC | 1.68e-02 | -2.10e-01 | 0.067 |
| 10370 | CITED2 | LZE24T | Human | Esophagus | ESCC | 5.29e-10 | 1.09e+00 | 0.0596 |
| 10370 | CITED2 | LZE21T | Human | Esophagus | ESCC | 1.55e-03 | 7.30e-01 | 0.0655 |
| 10370 | CITED2 | P1T-E | Human | Esophagus | ESCC | 3.36e-12 | 1.34e+00 | 0.0875 |
| 10370 | CITED2 | P2T-E | Human | Esophagus | ESCC | 5.02e-23 | 5.22e-01 | 0.1177 |
| 10370 | CITED2 | P4T-E | Human | Esophagus | ESCC | 7.34e-14 | 7.64e-01 | 0.1323 |
| 10370 | CITED2 | P5T-E | Human | Esophagus | ESCC | 5.43e-42 | 1.42e+00 | 0.1327 |
| 10370 | CITED2 | P8T-E | Human | Esophagus | ESCC | 2.89e-24 | 7.21e-01 | 0.0889 |
| 10370 | CITED2 | P9T-E | Human | Esophagus | ESCC | 1.09e-02 | 4.32e-01 | 0.1131 |
| 10370 | CITED2 | P10T-E | Human | Esophagus | ESCC | 8.94e-27 | 5.41e-01 | 0.116 |
| 10370 | CITED2 | P11T-E | Human | Esophagus | ESCC | 1.14e-24 | 1.89e+00 | 0.1426 |
| 10370 | CITED2 | P12T-E | Human | Esophagus | ESCC | 1.67e-07 | 3.99e-01 | 0.1122 |
| 10370 | CITED2 | P15T-E | Human | Esophagus | ESCC | 1.09e-37 | 1.45e+00 | 0.1149 |
| 10370 | CITED2 | P16T-E | Human | Esophagus | ESCC | 3.99e-23 | 6.50e-01 | 0.1153 |
| 10370 | CITED2 | P17T-E | Human | Esophagus | ESCC | 1.91e-03 | 8.57e-01 | 0.1278 |
| 10370 | CITED2 | P19T-E | Human | Esophagus | ESCC | 6.24e-04 | 9.82e-01 | 0.1662 |
| 10370 | CITED2 | P20T-E | Human | Esophagus | ESCC | 2.05e-14 | 7.33e-01 | 0.1124 |
| 10370 | CITED2 | P21T-E | Human | Esophagus | ESCC | 6.31e-09 | 1.35e-01 | 0.1617 |
| 10370 | CITED2 | P22T-E | Human | Esophagus | ESCC | 2.55e-04 | 2.11e-01 | 0.1236 |
| Page: 1 2 3 4 5 6 |
| Tissue | Expression Dynamics | Abbreviation |
| Esophagus | 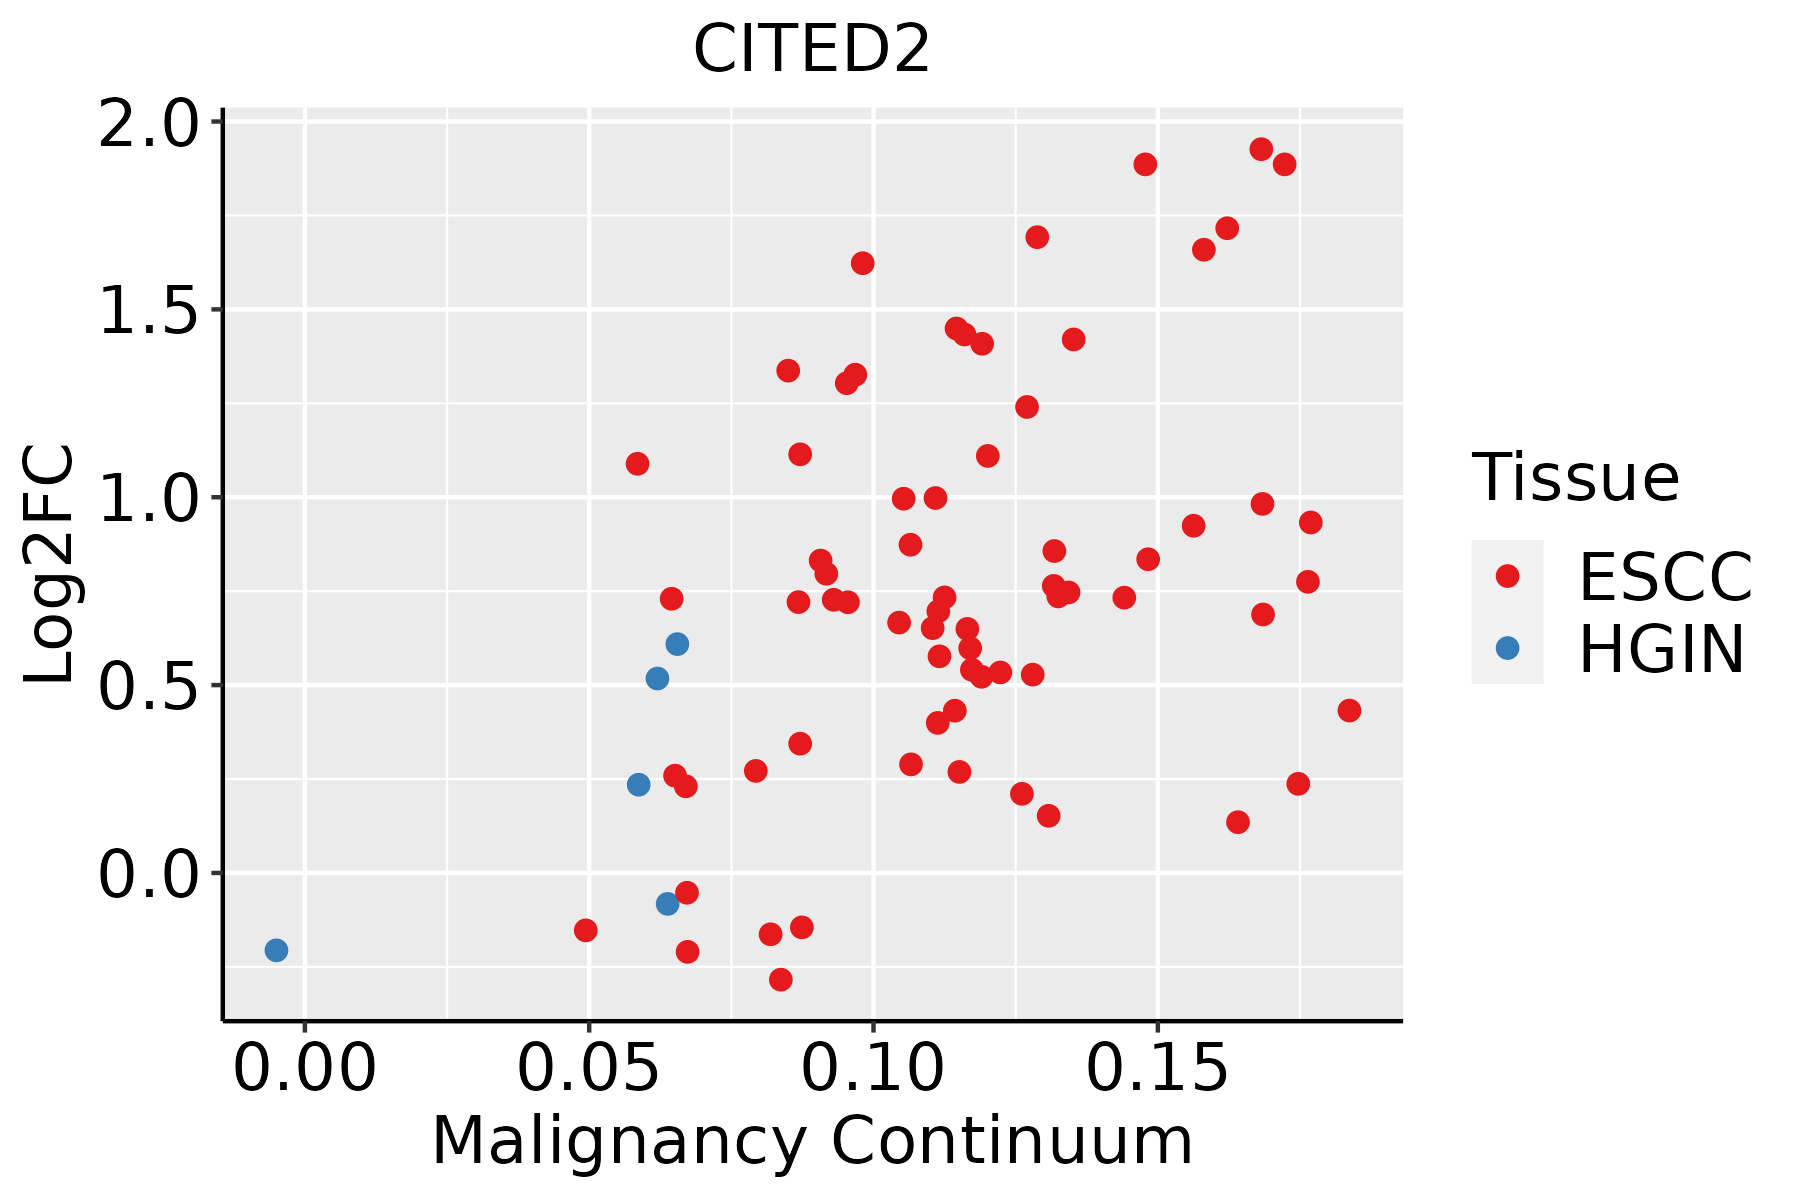 | ESCC: Esophageal squamous cell carcinoma |
| HGIN: High-grade intraepithelial neoplasias | ||
| LGIN: Low-grade intraepithelial neoplasias | ||
| Liver | 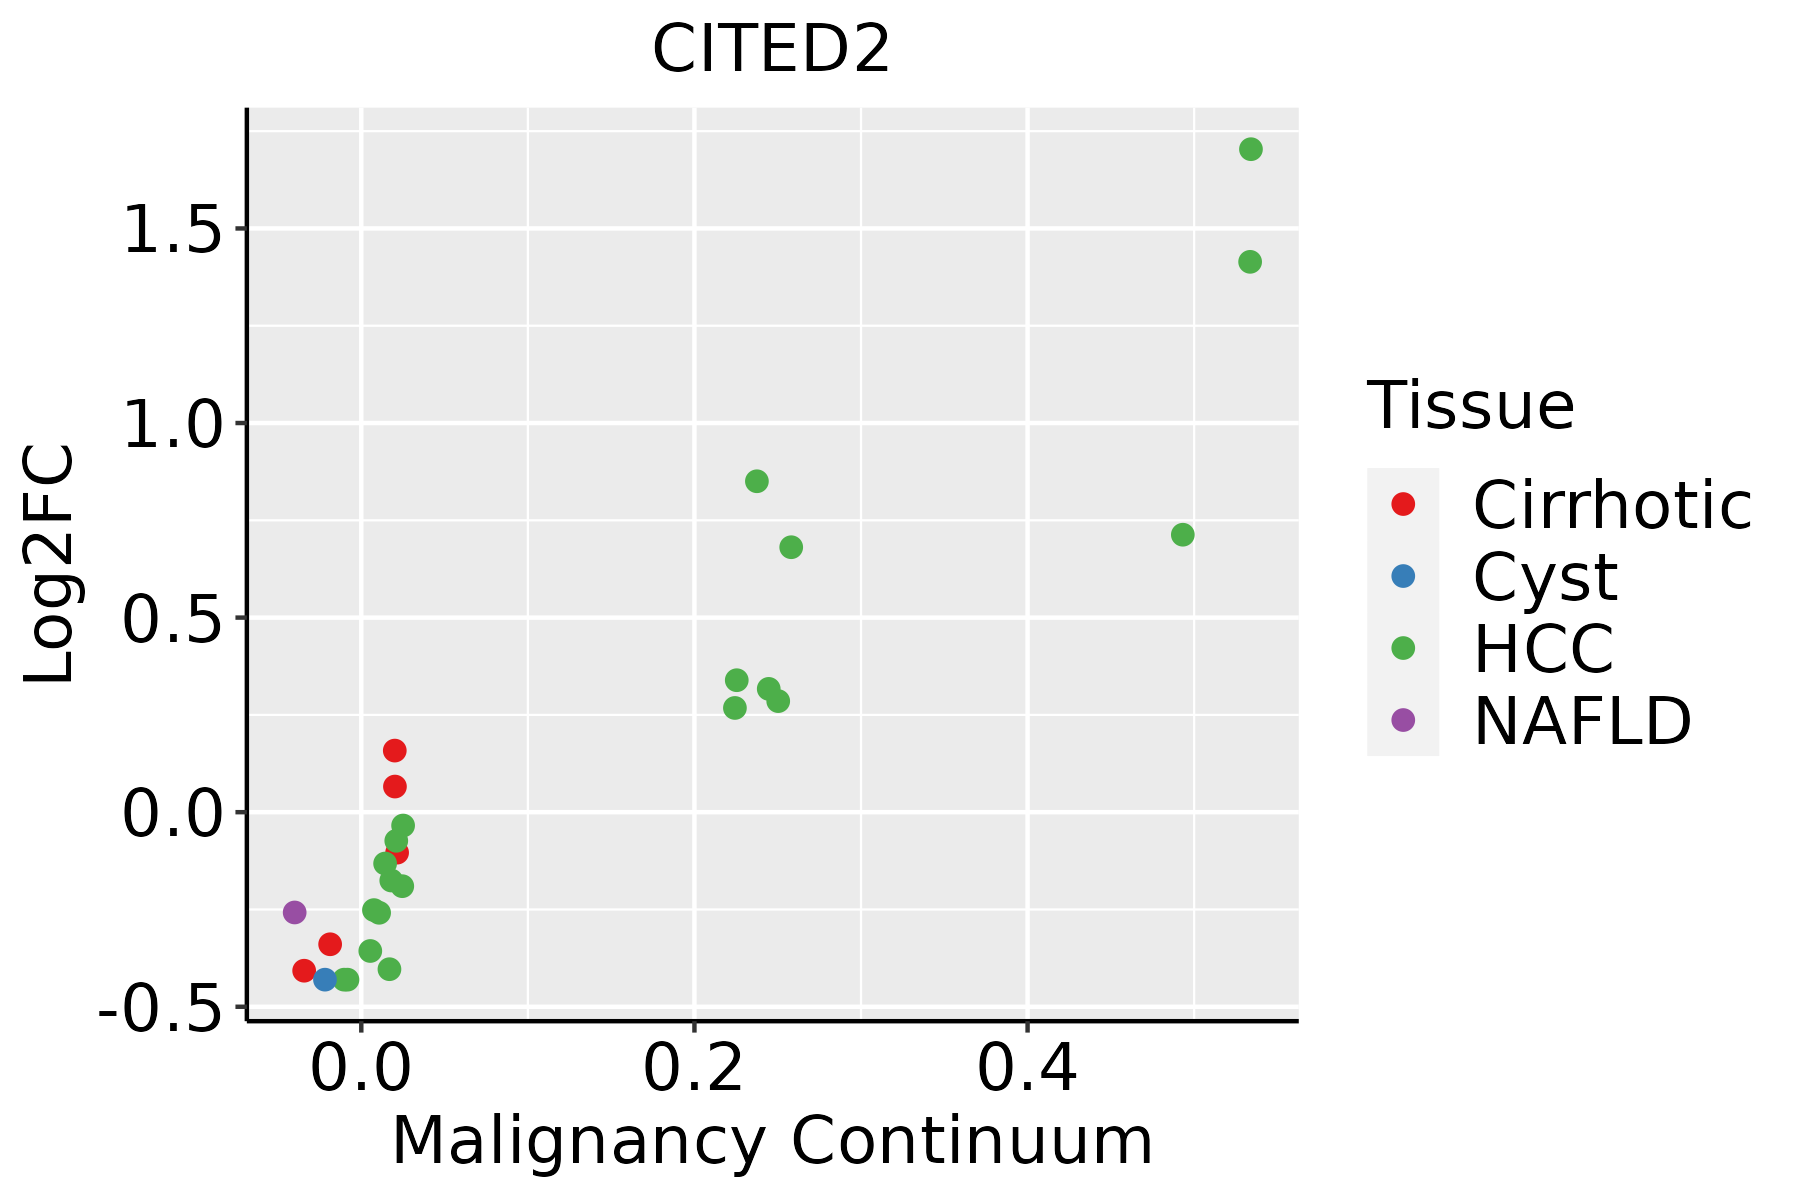 | HCC: Hepatocellular carcinoma |
| NAFLD: Non-alcoholic fatty liver disease | ||
| Oral Cavity |  | EOLP: Erosive Oral lichen planus |
| LP: leukoplakia | ||
| NEOLP: Non-erosive oral lichen planus | ||
| OSCC: Oral squamous cell carcinoma | ||
| Prostate |  | BPH: Benign Prostatic Hyperplasia |
| Skin |  | AK: Actinic keratosis |
| cSCC: Cutaneous squamous cell carcinoma | ||
| SCCIS:squamous cell carcinoma in situ | ||
| Thyroid |  | ATC: Anaplastic thyroid cancer |
| HT: Hashimoto's thyroiditis | ||
| PTC: Papillary thyroid cancer |
| ∗log2FC in expression of this searched gene in stem-like cells from each diseased tissue sample relative to stem-like cells in normal samples in each tissue plotted against the malignancy continuum. Samples are colored based on if they are from different disease stage. |
Top |
Malignant transformation related pathway analysis |
| Find out the enriched GO biological processes and KEGG pathways involved in transition from healthy to precancer to cancer |
| Tissue | Disease Stage | Enriched GO biological Processes |
| Colorectum | AD |  |
| Colorectum | SER |  |
| Colorectum | MSS |  |
| Colorectum | MSI-H |  |
| Colorectum | FAP |  |
| ∗Top 15 enriched GO BP terms are showed in the bar plot of each disease state in each tissue. Each row represents a significant GO biological process which is colored according to the -log10(p.adjust). |
| Page: 1 2 3 4 5 6 7 8 9 |
| GO ID | Tissue | Disease Stage | Description | Gene Ratio | Bg Ratio | pvalue | p.adjust | Count |
| GO:001402013 | Oral cavity | LP | primary neural tube formation | 36/4623 | 94/18723 | 2.34e-03 | 1.68e-02 | 36 |
| GO:0045785110 | Oral cavity | LP | positive regulation of cell adhesion | 134/4623 | 437/18723 | 2.44e-03 | 1.74e-02 | 134 |
| GO:0048872110 | Oral cavity | LP | homeostasis of number of cells | 87/4623 | 272/18723 | 3.75e-03 | 2.47e-02 | 87 |
| GO:0030218110 | Oral cavity | LP | erythrocyte differentiation | 43/4623 | 120/18723 | 4.13e-03 | 2.66e-02 | 43 |
| GO:006013515 | Oral cavity | LP | maternal process involved in female pregnancy | 25/4623 | 62/18723 | 4.74e-03 | 3.00e-02 | 25 |
| GO:000184313 | Oral cavity | LP | neural tube closure | 33/4623 | 88/18723 | 5.09e-03 | 3.16e-02 | 33 |
| GO:006141811 | Oral cavity | LP | regulation of transcription from RNA polymerase II promoter in response to hypoxia | 8/4623 | 13/18723 | 5.19e-03 | 3.19e-02 | 8 |
| GO:000756914 | Oral cavity | LP | cell aging | 46/4623 | 132/18723 | 5.64e-03 | 3.40e-02 | 46 |
| GO:006060613 | Oral cavity | LP | tube closure | 33/4623 | 89/18723 | 6.20e-03 | 3.67e-02 | 33 |
| GO:006145818 | Oral cavity | LP | reproductive system development | 128/4623 | 427/18723 | 6.91e-03 | 3.96e-02 | 128 |
| GO:004860817 | Oral cavity | LP | reproductive structure development | 127/4623 | 424/18723 | 7.31e-03 | 4.08e-02 | 127 |
| GO:000756515 | Oral cavity | LP | female pregnancy | 63/4623 | 193/18723 | 7.56e-03 | 4.17e-02 | 63 |
| GO:004578715 | Oral cavity | LP | positive regulation of cell cycle | 96/4623 | 313/18723 | 9.08e-03 | 4.85e-02 | 96 |
| GO:006145810 | Prostate | BPH | reproductive system development | 126/3107 | 427/18723 | 1.35e-11 | 9.95e-10 | 126 |
| GO:003009918 | Prostate | BPH | myeloid cell differentiation | 115/3107 | 381/18723 | 2.22e-11 | 1.51e-09 | 115 |
| GO:004860810 | Prostate | BPH | reproductive structure development | 124/3107 | 424/18723 | 3.76e-11 | 2.43e-09 | 124 |
| GO:007048217 | Prostate | BPH | response to oxygen levels | 104/3107 | 347/18723 | 3.13e-10 | 1.67e-08 | 104 |
| GO:004873218 | Prostate | BPH | gland development | 122/3107 | 436/18723 | 1.13e-09 | 5.01e-08 | 122 |
| GO:004362018 | Prostate | BPH | regulation of DNA-templated transcription in response to stress | 28/3107 | 53/18723 | 1.57e-09 | 6.70e-08 | 28 |
| GO:000756816 | Prostate | BPH | aging | 100/3107 | 339/18723 | 1.77e-09 | 7.44e-08 | 100 |
| Page: 1 2 3 4 5 6 7 8 9 10 11 12 13 14 15 16 17 18 19 20 21 22 23 24 25 26 27 28 29 30 31 32 33 34 35 36 37 38 |
| Pathway ID | Tissue | Disease Stage | Description | Gene Ratio | Bg Ratio | pvalue | p.adjust | qvalue | Count |
| hsa04137210 | Esophagus | ESCC | Mitophagy - animal | 54/4205 | 72/8465 | 9.33e-06 | 4.96e-05 | 2.54e-05 | 54 |
| hsa0413738 | Esophagus | ESCC | Mitophagy - animal | 54/4205 | 72/8465 | 9.33e-06 | 4.96e-05 | 2.54e-05 | 54 |
| hsa0413721 | Liver | Cirrhotic | Mitophagy - animal | 39/2530 | 72/8465 | 1.38e-05 | 1.24e-04 | 7.64e-05 | 39 |
| hsa0413731 | Liver | Cirrhotic | Mitophagy - animal | 39/2530 | 72/8465 | 1.38e-05 | 1.24e-04 | 7.64e-05 | 39 |
| hsa0413741 | Liver | HCC | Mitophagy - animal | 53/4020 | 72/8465 | 5.49e-06 | 4.59e-05 | 2.56e-05 | 53 |
| hsa0413751 | Liver | HCC | Mitophagy - animal | 53/4020 | 72/8465 | 5.49e-06 | 4.59e-05 | 2.56e-05 | 53 |
| hsa0413728 | Oral cavity | OSCC | Mitophagy - animal | 58/3704 | 72/8465 | 1.48e-10 | 2.07e-09 | 1.05e-09 | 58 |
| hsa04137112 | Oral cavity | OSCC | Mitophagy - animal | 58/3704 | 72/8465 | 1.48e-10 | 2.07e-09 | 1.05e-09 | 58 |
| hsa0413729 | Oral cavity | LP | Mitophagy - animal | 38/2418 | 72/8465 | 1.24e-05 | 8.63e-05 | 5.57e-05 | 38 |
| hsa0413737 | Oral cavity | LP | Mitophagy - animal | 38/2418 | 72/8465 | 1.24e-05 | 8.63e-05 | 5.57e-05 | 38 |
| hsa0413726 | Prostate | BPH | Mitophagy - animal | 28/1718 | 72/8465 | 2.12e-04 | 1.13e-03 | 6.98e-04 | 28 |
| hsa04137111 | Prostate | BPH | Mitophagy - animal | 28/1718 | 72/8465 | 2.12e-04 | 1.13e-03 | 6.98e-04 | 28 |
| hsa0413727 | Prostate | Tumor | Mitophagy - animal | 30/1791 | 72/8465 | 6.31e-05 | 4.64e-04 | 2.88e-04 | 30 |
| hsa0413736 | Prostate | Tumor | Mitophagy - animal | 30/1791 | 72/8465 | 6.31e-05 | 4.64e-04 | 2.88e-04 | 30 |
| Page: 1 |
Top |
Cell-cell communication analysis |
| Identification of potential cell-cell interactions between two cell types and their ligand-receptor pairs for different disease states |
| Ligand | Receptor | LRpair | Pathway | Tissue | Disease Stage |
| Page: 1 |
Top |
Single-cell gene regulatory network inference analysis |
| Find out the significant the regulons (TFs) and the target genes of each regulon across cell types for different disease states |
| TF | Cell Type | Tissue | Disease Stage | Target Gene | RSS | Regulon Activity |
| ∗The dot plots of a searched regulon are shown for all cell subpopulations in each disease state of each tissue based on the regulon specific score inferred using pySCENIC and by calculating the average expression. |
| Page: 1 |
Top |
Somatic mutation of malignant transformation related genes |
| Annotation of somatic variants for genes involved in malignant transformation |
| Hugo Symbol | Variant Class | Variant Classification | dbSNP RS | HGVSc | HGVSp | HGVSp Short | SWISSPROT | BIOTYPE | SIFT | PolyPhen | Tumor Sample Barcode | Tissue | Histology | Sex | Age | Stage | Therapy Types | Drugs | Outcome |
| CITED2 | SNV | Missense_Mutation | novel | c.775G>A | p.Asp259Asn | p.D259N | protein_coding | deleterious(0) | probably_damaging(0.998) | TCGA-A8-A08L-01 | Breast | breast invasive carcinoma | Female | >=65 | III/IV | Unknown | Unknown | SD | |
| CITED2 | SNV | Missense_Mutation | novel | c.235G>T | p.Gly79Trp | p.G79W | protein_coding | deleterious(0) | probably_damaging(0.984) | TCGA-BH-A8FY-01 | Breast | breast invasive carcinoma | Female | >=65 | I/II | Unknown | Unknown | SD | |
| CITED2 | SNV | Missense_Mutation | novel | c.8G>T | p.Gly3Val | p.G3V | protein_coding | deleterious_low_confidence(0.02) | probably_damaging(0.98) | TCGA-OL-A5RZ-01 | Breast | breast invasive carcinoma | Female | <65 | I/II | Chemotherapy | doxorubicin | CR | |
| CITED2 | SNV | Missense_Mutation | c.697C>A | p.Leu233Ile | p.L233I | protein_coding | deleterious(0) | probably_damaging(0.992) | TCGA-AA-3977-01 | Colorectum | colon adenocarcinoma | Male | >=65 | I/II | Unknown | Unknown | SD | ||
| CITED2 | SNV | Missense_Mutation | rs762473911 | c.202N>G | p.Met68Val | p.M68V | protein_coding | tolerated(0.15) | benign(0.015) | TCGA-AY-6197-01 | Colorectum | colon adenocarcinoma | Male | <65 | I/II | Unknown | Unknown | SD | |
| CITED2 | SNV | Missense_Mutation | novel | c.669N>G | p.Ile223Met | p.I223M | protein_coding | tolerated(0.52) | benign(0.047) | TCGA-A5-A0G2-01 | Endometrium | uterine corpus endometrioid carcinoma | Female | <65 | III/IV | Unknown | Unknown | SD | |
| CITED2 | SNV | Missense_Mutation | novel | c.278C>T | p.Ala93Val | p.A93V | protein_coding | tolerated(0.28) | benign(0.328) | TCGA-AX-A2HC-01 | Endometrium | uterine corpus endometrioid carcinoma | Female | <65 | III/IV | Chemotherapy | paclitaxel | PD | |
| CITED2 | SNV | Missense_Mutation | novel | c.389N>T | p.Asn130Ile | p.N130I | protein_coding | deleterious(0.01) | benign(0.277) | TCGA-AX-A3G9-01 | Endometrium | uterine corpus endometrioid carcinoma | Female | <65 | III/IV | Chemotherapy | carboplatin | SD | |
| CITED2 | SNV | Missense_Mutation | rs780995434 | c.505A>G | p.Ser169Gly | p.S169G | protein_coding | tolerated(0.41) | benign(0) | TCGA-B5-A11G-01 | Endometrium | uterine corpus endometrioid carcinoma | Female | >=65 | I/II | Unknown | Unknown | SD | |
| CITED2 | SNV | Missense_Mutation | novel | c.310N>G | p.Met104Val | p.M104V | protein_coding | tolerated(0.11) | benign(0.11) | TCGA-B5-A3FC-01 | Endometrium | uterine corpus endometrioid carcinoma | Female | <65 | I/II | Unknown | Unknown | SD |
| Page: 1 2 |
Top |
Related drugs of malignant transformation related genes |
| Identification of chemicals and drugs interact with genes involved in malignant transfromation |
| (DGIdb 4.0) |
| Entrez ID | Symbol | Category | Interaction Types | Drug Claim Name | Drug Name | PMIDs |
| Page: 1 |

Copyright 2023-Present -The University of Texas Health Science Center at Houston |