
|
|||||
|
 | |
| |
| |
| |
| |
| |
|
Gene: CDC37 |
Gene summary for CDC37 |
| Gene information | Species | Human | Gene symbol | CDC37 | Gene ID | 11140 |
| Gene name | cell division cycle 37, HSP90 cochaperone | |
| Gene Alias | P50CDC37 | |
| Cytomap | 19p13.2 | |
| Gene Type | protein-coding | GO ID | GO:0000079 | UniProtAcc | A0A024R7B7 |
Top |
Malignant transformation analysis |
| Identification of the aberrant gene expression in precancerous and cancerous lesions by comparing the gene expression of stem-like cells in diseased tissues with normal stem cells |
| Entrez ID | Symbol | Replicates | Species | Organ | Tissue | Adj P-value | Log2FC | Malignancy |
| 11140 | CDC37 | HTA11_3410_2000001011 | Human | Colorectum | AD | 2.77e-04 | 2.51e-01 | 0.0155 |
| 11140 | CDC37 | HTA11_1938_2000001011 | Human | Colorectum | AD | 2.25e-11 | 7.99e-01 | -0.0811 |
| 11140 | CDC37 | HTA11_347_2000001011 | Human | Colorectum | AD | 9.77e-13 | 5.76e-01 | -0.1954 |
| 11140 | CDC37 | HTA11_411_2000001011 | Human | Colorectum | SER | 5.75e-05 | 1.03e+00 | -0.2602 |
| 11140 | CDC37 | HTA11_2112_2000001011 | Human | Colorectum | SER | 1.91e-02 | 7.41e-01 | -0.2196 |
| 11140 | CDC37 | HTA11_3361_2000001011 | Human | Colorectum | AD | 2.80e-03 | 5.44e-01 | -0.1207 |
| 11140 | CDC37 | HTA11_696_2000001011 | Human | Colorectum | AD | 4.34e-16 | 7.11e-01 | -0.1464 |
| 11140 | CDC37 | HTA11_1391_2000001011 | Human | Colorectum | AD | 1.59e-18 | 9.91e-01 | -0.059 |
| 11140 | CDC37 | HTA11_2992_2000001011 | Human | Colorectum | SER | 2.04e-04 | 8.36e-01 | -0.1706 |
| 11140 | CDC37 | HTA11_5216_2000001011 | Human | Colorectum | SER | 2.70e-03 | 6.15e-01 | -0.1462 |
| 11140 | CDC37 | HTA11_866_3004761011 | Human | Colorectum | AD | 5.24e-11 | 5.63e-01 | 0.096 |
| 11140 | CDC37 | HTA11_10711_2000001011 | Human | Colorectum | AD | 3.43e-02 | 3.98e-01 | 0.0338 |
| 11140 | CDC37 | HTA11_7696_3000711011 | Human | Colorectum | AD | 5.53e-13 | 7.11e-01 | 0.0674 |
| 11140 | CDC37 | HTA11_6818_2000001021 | Human | Colorectum | AD | 3.78e-07 | 5.54e-01 | 0.0588 |
| 11140 | CDC37 | HTA11_99999970781_79442 | Human | Colorectum | MSS | 6.20e-20 | 8.27e-01 | 0.294 |
| 11140 | CDC37 | HTA11_99999965104_69814 | Human | Colorectum | MSS | 1.16e-16 | 9.84e-01 | 0.281 |
| 11140 | CDC37 | HTA11_99999971662_82457 | Human | Colorectum | MSS | 2.54e-22 | 1.05e+00 | 0.3859 |
| 11140 | CDC37 | HTA11_99999974143_84620 | Human | Colorectum | MSS | 5.53e-05 | 4.97e-01 | 0.3005 |
| 11140 | CDC37 | A015-C-203 | Human | Colorectum | FAP | 7.83e-09 | 4.61e-02 | -0.1294 |
| 11140 | CDC37 | A001-C-108 | Human | Colorectum | FAP | 7.35e-03 | 1.07e-01 | -0.0272 |
| Page: 1 2 3 4 5 6 7 8 9 |
| Tissue | Expression Dynamics | Abbreviation |
| Colorectum (GSE201348) |  | FAP: Familial adenomatous polyposis |
| CRC: Colorectal cancer | ||
| Colorectum (HTA11) |  | AD: Adenomas |
| SER: Sessile serrated lesions | ||
| MSI-H: Microsatellite-high colorectal cancer | ||
| MSS: Microsatellite stable colorectal cancer | ||
| Endometrium | 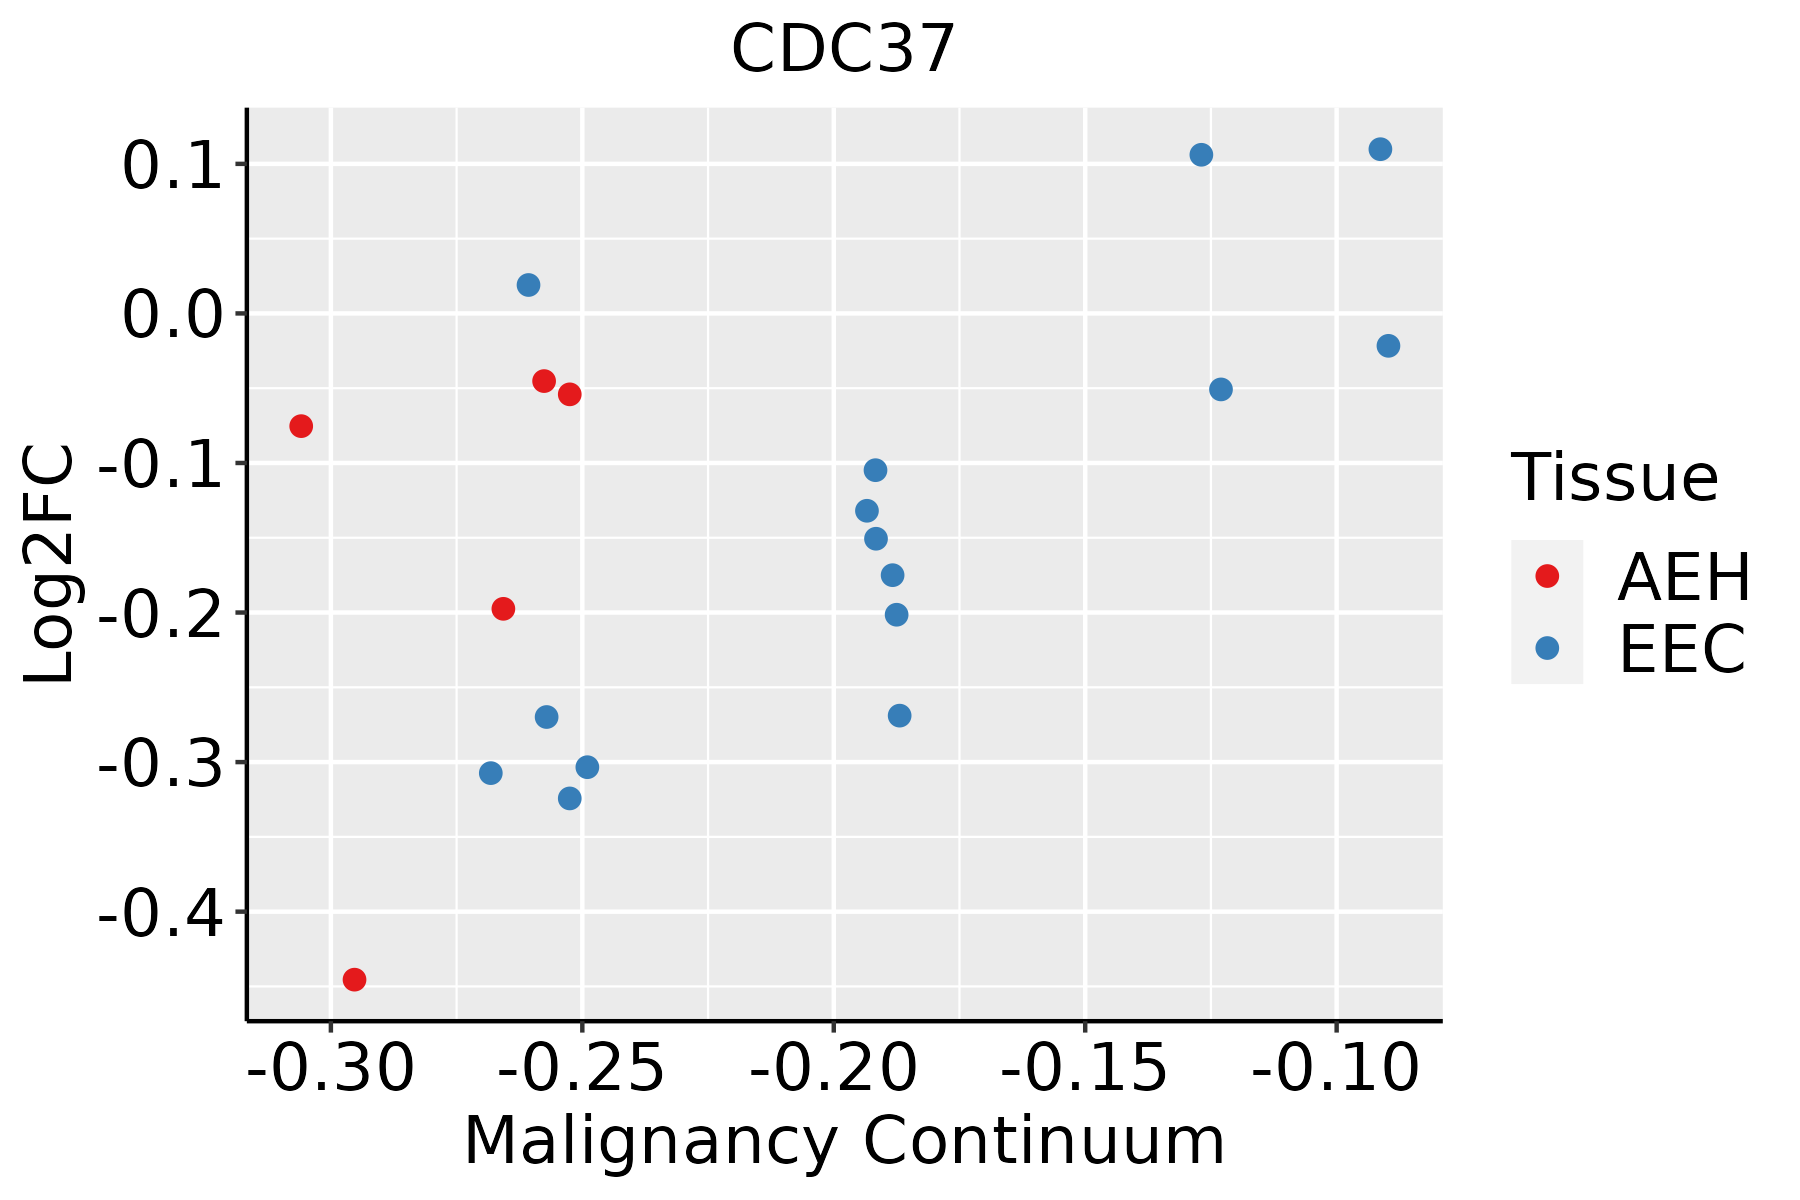 | AEH: Atypical endometrial hyperplasia |
| EEC: Endometrioid Cancer | ||
| Esophagus | 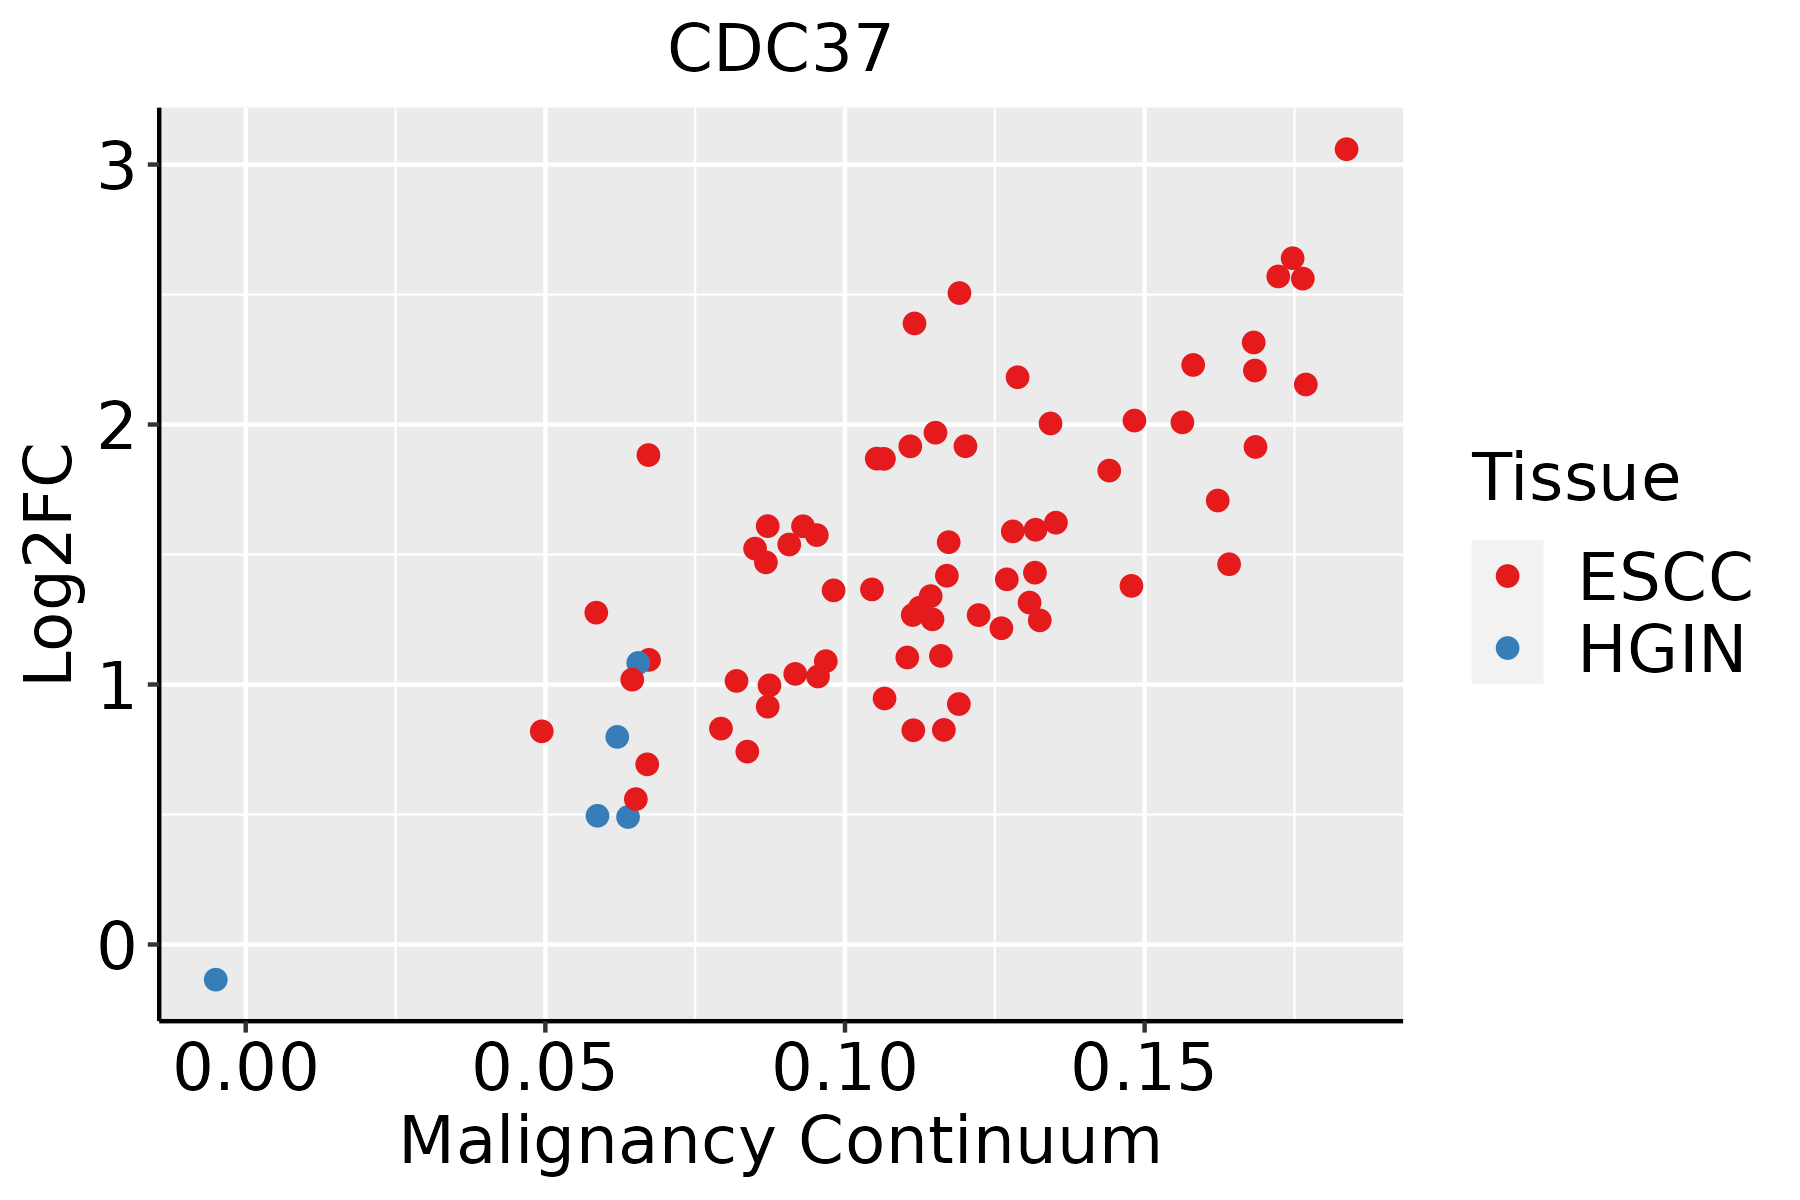 | ESCC: Esophageal squamous cell carcinoma |
| HGIN: High-grade intraepithelial neoplasias | ||
| LGIN: Low-grade intraepithelial neoplasias | ||
| Liver |  | HCC: Hepatocellular carcinoma |
| NAFLD: Non-alcoholic fatty liver disease | ||
| Oral Cavity |  | EOLP: Erosive Oral lichen planus |
| LP: leukoplakia | ||
| NEOLP: Non-erosive oral lichen planus | ||
| OSCC: Oral squamous cell carcinoma | ||
| Prostate | 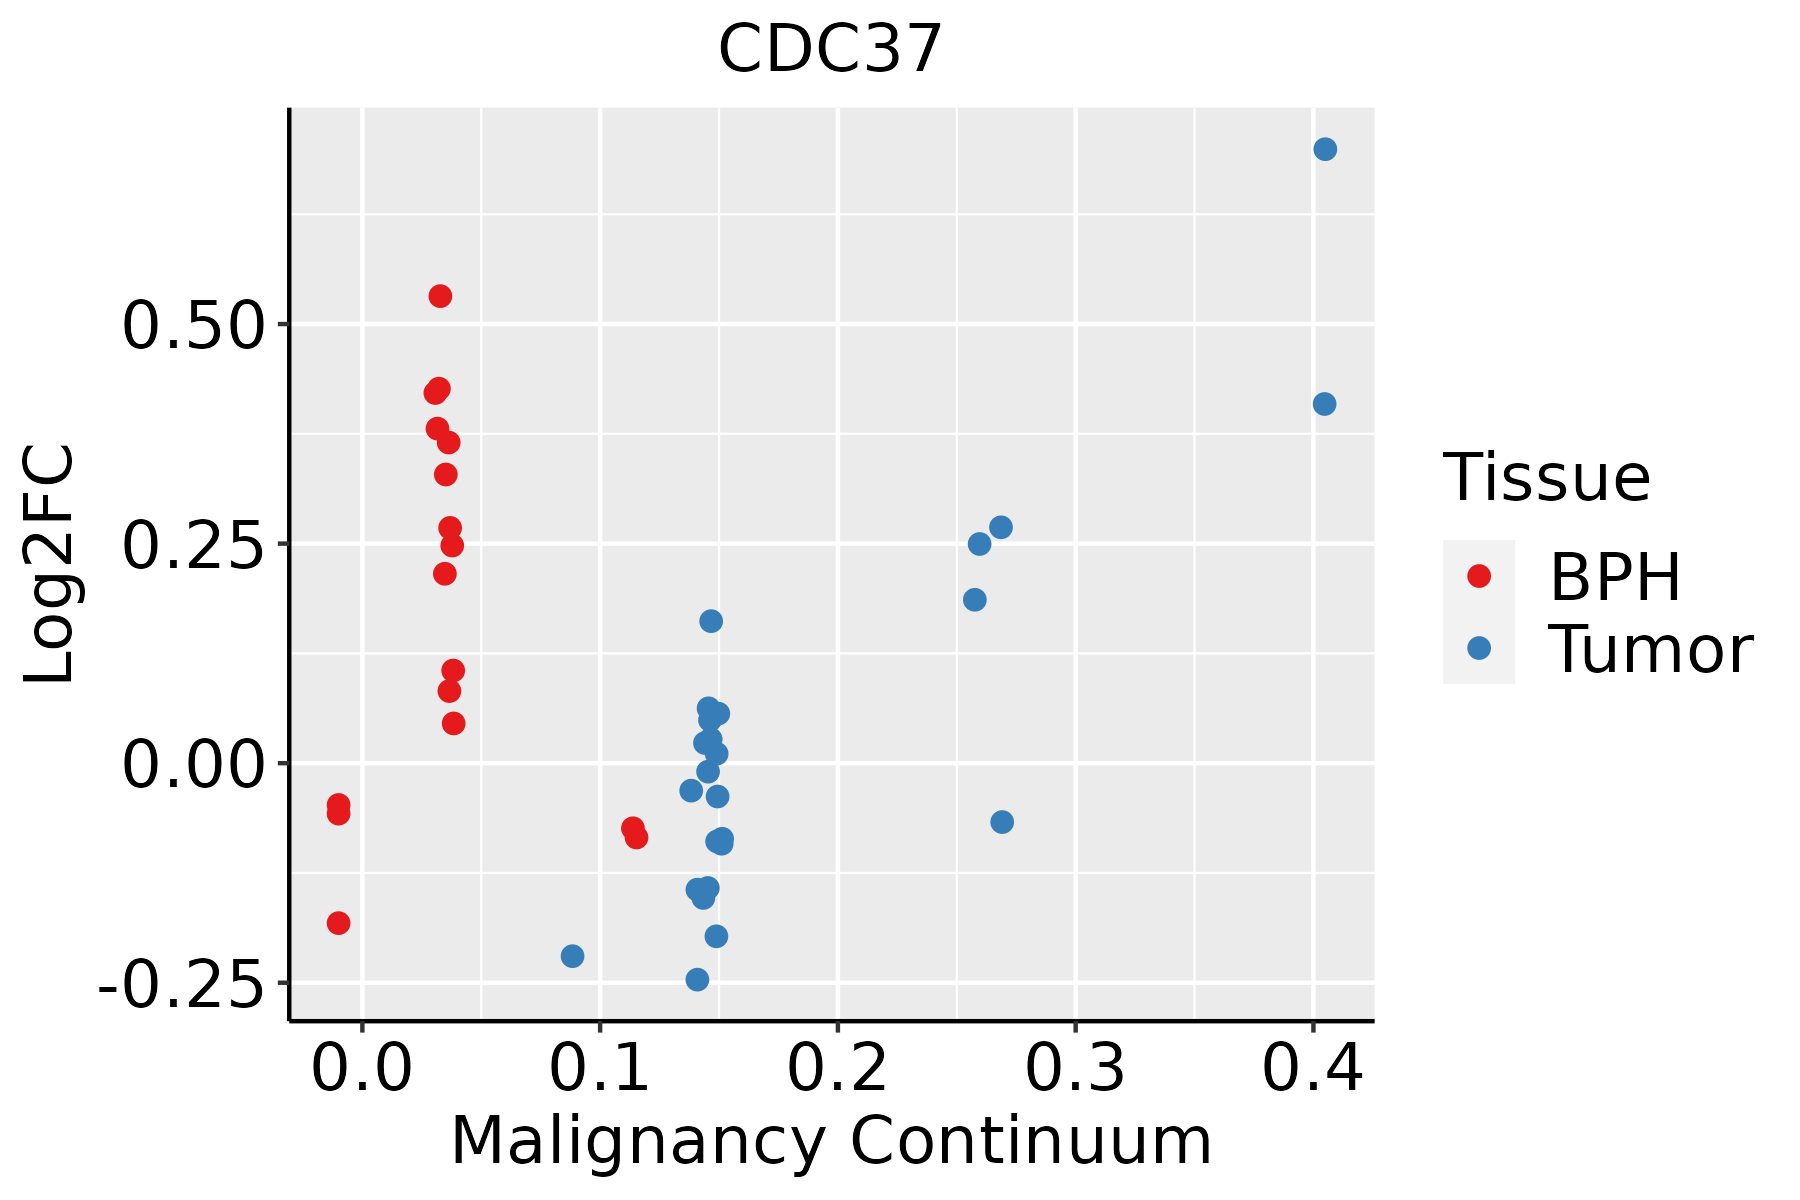 | BPH: Benign Prostatic Hyperplasia |
| Skin | 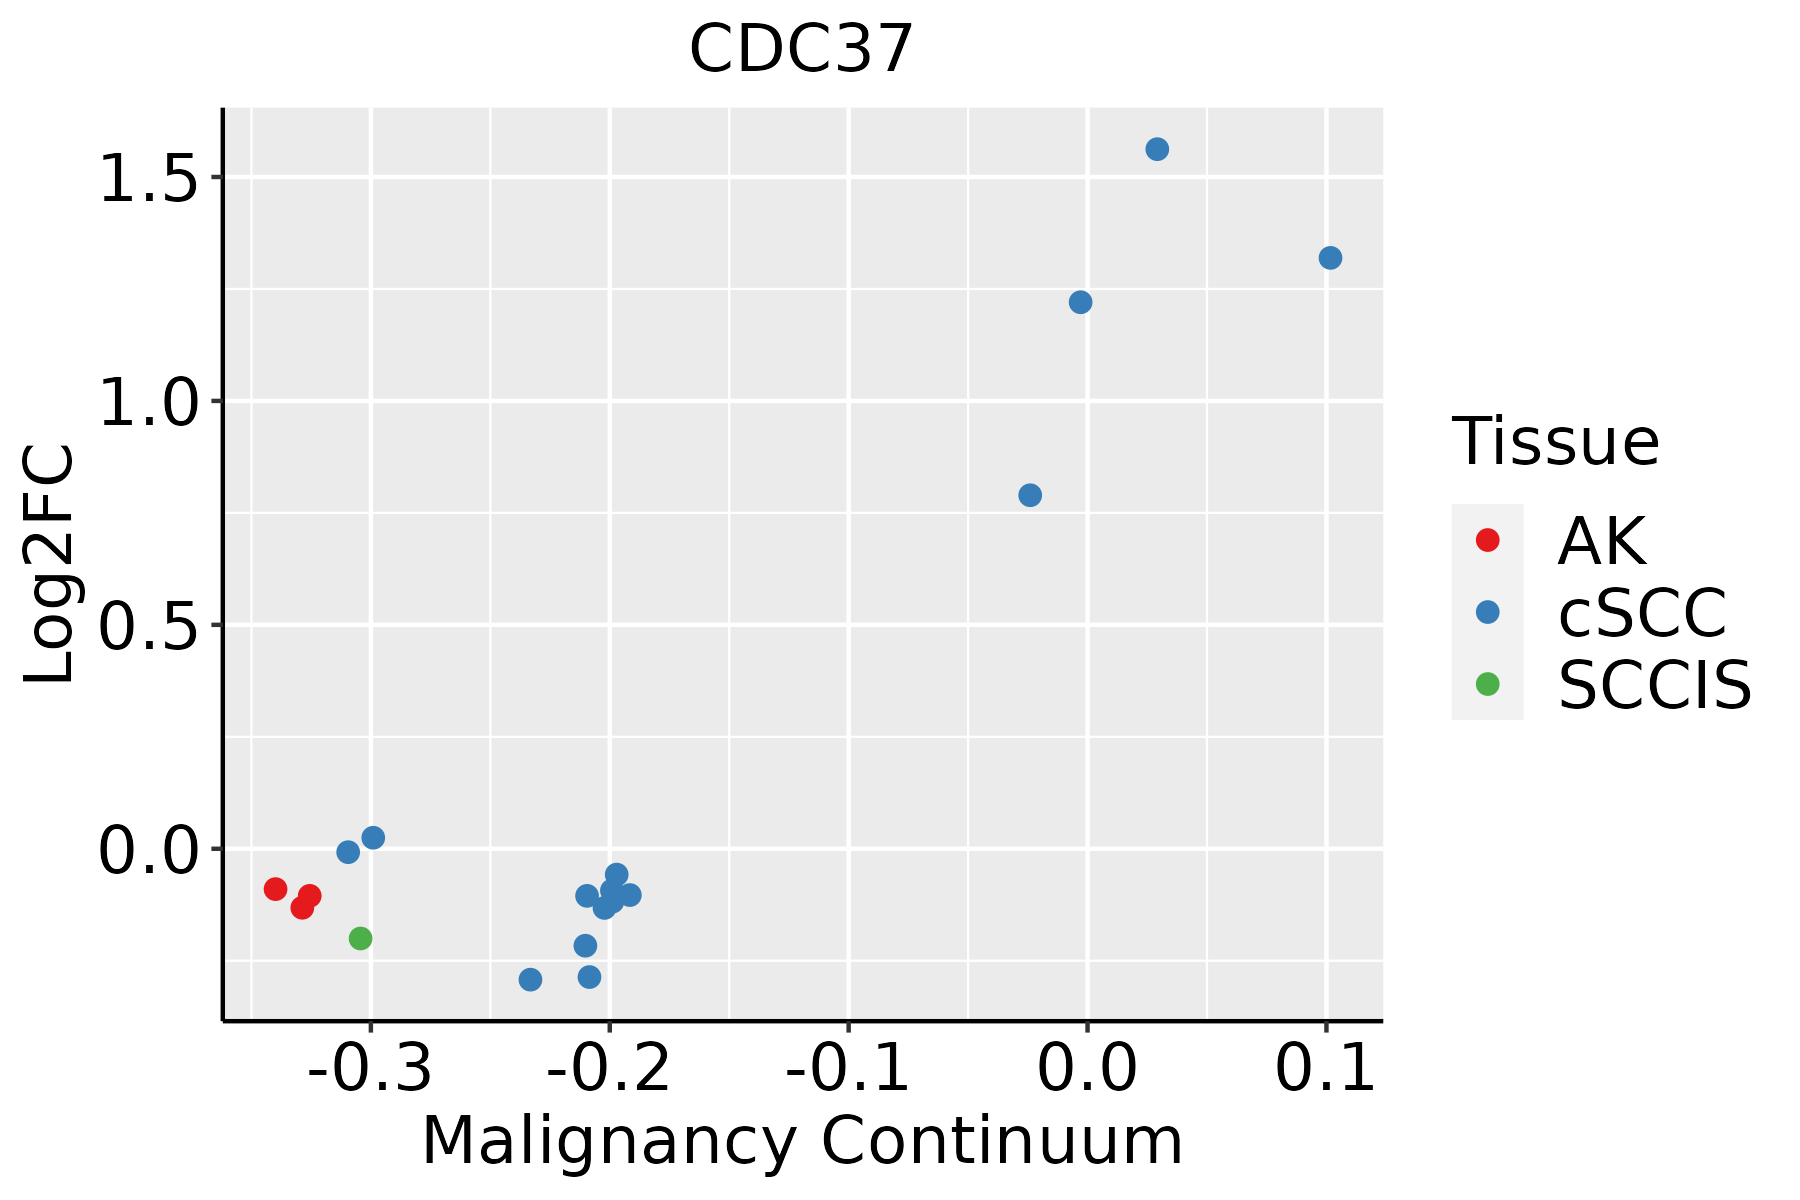 | AK: Actinic keratosis |
| cSCC: Cutaneous squamous cell carcinoma | ||
| SCCIS:squamous cell carcinoma in situ | ||
| Thyroid |  | ATC: Anaplastic thyroid cancer |
| HT: Hashimoto's thyroiditis | ||
| PTC: Papillary thyroid cancer |
| ∗log2FC in expression of this searched gene in stem-like cells from each diseased tissue sample relative to stem-like cells in normal samples in each tissue plotted against the malignancy continuum. Samples are colored based on if they are from different disease stage. |
Top |
Malignant transformation related pathway analysis |
| Find out the enriched GO biological processes and KEGG pathways involved in transition from healthy to precancer to cancer |
| Tissue | Disease Stage | Enriched GO biological Processes |
| Colorectum | AD |  |
| Colorectum | SER |  |
| Colorectum | MSS |  |
| Colorectum | MSI-H |  |
| Colorectum | FAP |  |
| ∗Top 15 enriched GO BP terms are showed in the bar plot of each disease state in each tissue. Each row represents a significant GO biological process which is colored according to the -log10(p.adjust). |
| Page: 1 2 3 4 5 6 7 8 9 |
| GO ID | Tissue | Disease Stage | Description | Gene Ratio | Bg Ratio | pvalue | p.adjust | Count |
| GO:007190031 | Oral cavity | NEOLP | regulation of protein serine/threonine kinase activity | 64/2005 | 359/18723 | 2.93e-05 | 4.48e-04 | 64 |
| GO:001623631 | Oral cavity | NEOLP | macroautophagy | 54/2005 | 291/18723 | 3.95e-05 | 5.62e-04 | 54 |
| GO:00603383 | Oral cavity | NEOLP | regulation of type I interferon-mediated signaling pathway | 13/2005 | 36/18723 | 5.04e-05 | 6.90e-04 | 13 |
| GO:00450883 | Oral cavity | NEOLP | regulation of innate immune response | 43/2005 | 218/18723 | 5.49e-05 | 7.44e-04 | 43 |
| GO:007134631 | Oral cavity | NEOLP | cellular response to interferon-gamma | 27/2005 | 118/18723 | 1.03e-04 | 1.24e-03 | 27 |
| GO:006033331 | Oral cavity | NEOLP | interferon-gamma-mediated signaling pathway | 10/2005 | 27/18723 | 2.94e-04 | 2.92e-03 | 10 |
| GO:190300831 | Oral cavity | NEOLP | organelle disassembly | 25/2005 | 114/18723 | 3.66e-04 | 3.49e-03 | 25 |
| GO:000042231 | Oral cavity | NEOLP | autophagy of mitochondrion | 19/2005 | 81/18723 | 7.53e-04 | 6.12e-03 | 19 |
| GO:006172631 | Oral cavity | NEOLP | mitochondrion disassembly | 19/2005 | 81/18723 | 7.53e-04 | 6.12e-03 | 19 |
| GO:009878013 | Oral cavity | NEOLP | response to mitochondrial depolarisation | 7/2005 | 19/18723 | 2.51e-03 | 1.59e-02 | 7 |
| GO:006033011 | Oral cavity | NEOLP | regulation of response to interferon-gamma | 6/2005 | 16/18723 | 4.64e-03 | 2.56e-02 | 6 |
| GO:006033411 | Oral cavity | NEOLP | regulation of interferon-gamma-mediated signaling pathway | 6/2005 | 16/18723 | 4.64e-03 | 2.56e-02 | 6 |
| GO:000660532 | Oral cavity | NEOLP | protein targeting | 48/2005 | 314/18723 | 7.23e-03 | 3.66e-02 | 48 |
| GO:000042321 | Oral cavity | NEOLP | mitophagy | 8/2005 | 28/18723 | 7.44e-03 | 3.73e-02 | 8 |
| GO:190492511 | Oral cavity | NEOLP | positive regulation of autophagy of mitochondrion in response to mitochondrial depolarization | 5/2005 | 13/18723 | 8.62e-03 | 4.15e-02 | 5 |
| GO:003164718 | Prostate | BPH | regulation of protein stability | 111/3107 | 298/18723 | 4.58e-18 | 1.42e-15 | 111 |
| GO:000645716 | Prostate | BPH | protein folding | 85/3107 | 212/18723 | 2.37e-16 | 4.74e-14 | 85 |
| GO:005082118 | Prostate | BPH | protein stabilization | 75/3107 | 191/18723 | 4.96e-14 | 5.68e-12 | 75 |
| GO:000660518 | Prostate | BPH | protein targeting | 102/3107 | 314/18723 | 2.51e-12 | 2.05e-10 | 102 |
| GO:002241117 | Prostate | BPH | cellular component disassembly | 121/3107 | 443/18723 | 6.34e-09 | 2.25e-07 | 121 |
| Page: 1 2 3 4 5 6 7 8 9 10 11 12 13 14 15 16 17 18 19 20 |
| Pathway ID | Tissue | Disease Stage | Description | Gene Ratio | Bg Ratio | pvalue | p.adjust | qvalue | Count |
| hsa04151 | Colorectum | FAP | PI3K-Akt signaling pathway | 75/1404 | 354/8465 | 1.23e-02 | 4.19e-02 | 2.55e-02 | 75 |
| hsa041511 | Colorectum | FAP | PI3K-Akt signaling pathway | 75/1404 | 354/8465 | 1.23e-02 | 4.19e-02 | 2.55e-02 | 75 |
| hsa041517 | Esophagus | ESCC | PI3K-Akt signaling pathway | 197/4205 | 354/8465 | 1.24e-02 | 2.83e-02 | 1.45e-02 | 197 |
| hsa0415114 | Esophagus | ESCC | PI3K-Akt signaling pathway | 197/4205 | 354/8465 | 1.24e-02 | 2.83e-02 | 1.45e-02 | 197 |
| hsa041516 | Oral cavity | OSCC | PI3K-Akt signaling pathway | 185/3704 | 354/8465 | 6.26e-04 | 1.86e-03 | 9.49e-04 | 185 |
| hsa0415113 | Oral cavity | OSCC | PI3K-Akt signaling pathway | 185/3704 | 354/8465 | 6.26e-04 | 1.86e-03 | 9.49e-04 | 185 |
| hsa0415123 | Oral cavity | EOLP | PI3K-Akt signaling pathway | 73/1218 | 354/8465 | 7.03e-04 | 2.69e-03 | 1.59e-03 | 73 |
| hsa0415133 | Oral cavity | EOLP | PI3K-Akt signaling pathway | 73/1218 | 354/8465 | 7.03e-04 | 2.69e-03 | 1.59e-03 | 73 |
| hsa0415141 | Oral cavity | NEOLP | PI3K-Akt signaling pathway | 79/1112 | 354/8465 | 8.42e-07 | 9.92e-06 | 6.24e-06 | 79 |
| hsa0415151 | Oral cavity | NEOLP | PI3K-Akt signaling pathway | 79/1112 | 354/8465 | 8.42e-07 | 9.92e-06 | 6.24e-06 | 79 |
| hsa041515 | Prostate | BPH | PI3K-Akt signaling pathway | 104/1718 | 354/8465 | 2.07e-05 | 1.55e-04 | 9.61e-05 | 104 |
| hsa0415112 | Prostate | BPH | PI3K-Akt signaling pathway | 104/1718 | 354/8465 | 2.07e-05 | 1.55e-04 | 9.61e-05 | 104 |
| hsa0415122 | Prostate | Tumor | PI3K-Akt signaling pathway | 105/1791 | 354/8465 | 7.42e-05 | 5.30e-04 | 3.28e-04 | 105 |
| hsa0415132 | Prostate | Tumor | PI3K-Akt signaling pathway | 105/1791 | 354/8465 | 7.42e-05 | 5.30e-04 | 3.28e-04 | 105 |
| Page: 1 |
Top |
Cell-cell communication analysis |
| Identification of potential cell-cell interactions between two cell types and their ligand-receptor pairs for different disease states |
| Ligand | Receptor | LRpair | Pathway | Tissue | Disease Stage |
| Page: 1 |
Top |
Single-cell gene regulatory network inference analysis |
| Find out the significant the regulons (TFs) and the target genes of each regulon across cell types for different disease states |
| TF | Cell Type | Tissue | Disease Stage | Target Gene | RSS | Regulon Activity |
| ∗The dot plots of a searched regulon are shown for all cell subpopulations in each disease state of each tissue based on the regulon specific score inferred using pySCENIC and by calculating the average expression. |
| Page: 1 |
Top |
Somatic mutation of malignant transformation related genes |
| Annotation of somatic variants for genes involved in malignant transformation |
| Hugo Symbol | Variant Class | Variant Classification | dbSNP RS | HGVSc | HGVSp | HGVSp Short | SWISSPROT | BIOTYPE | SIFT | PolyPhen | Tumor Sample Barcode | Tissue | Histology | Sex | Age | Stage | Therapy Types | Drugs | Outcome |
| CDC37 | SNV | Missense_Mutation | novel | c.650N>C | p.Gln217Pro | p.Q217P | Q16543 | protein_coding | deleterious(0) | possibly_damaging(0.903) | TCGA-A2-A0YK-01 | Breast | breast invasive carcinoma | Female | <65 | I/II | Chemotherapy | cytoxan | SD |
| CDC37 | SNV | Missense_Mutation | rs779190160 | c.691N>T | p.Arg231Trp | p.R231W | Q16543 | protein_coding | deleterious(0) | probably_damaging(0.996) | TCGA-AC-A23H-01 | Breast | breast invasive carcinoma | Female | >=65 | I/II | Unknown | Unknown | PD |
| CDC37 | SNV | Missense_Mutation | c.56N>T | p.Thr19Met | p.T19M | Q16543 | protein_coding | deleterious(0) | probably_damaging(0.966) | TCGA-B6-A0I2-01 | Breast | breast invasive carcinoma | Female | <65 | I/II | Unknown | Unknown | SD | |
| CDC37 | SNV | Missense_Mutation | c.449C>T | p.Thr150Ile | p.T150I | Q16543 | protein_coding | tolerated(0.07) | possibly_damaging(0.673) | TCGA-D8-A1J8-01 | Breast | breast invasive carcinoma | Female | >=65 | I/II | Hormone Therapy | nolvadex | SD | |
| CDC37 | SNV | Missense_Mutation | c.1027N>A | p.Val343Ile | p.V343I | Q16543 | protein_coding | tolerated(0.1) | benign(0.009) | TCGA-D8-A1JB-01 | Breast | breast invasive carcinoma | Female | <65 | I/II | Chemotherapy | adriamycin | SD | |
| CDC37 | deletion | Frame_Shift_Del | novel | c.462delN | p.Lys154AsnfsTer44 | p.K154Nfs*44 | Q16543 | protein_coding | TCGA-D8-A27V-01 | Breast | breast invasive carcinoma | Female | <65 | I/II | Hormone Therapy | tamoxiphen | SD | ||
| CDC37 | SNV | Missense_Mutation | novel | c.166N>A | p.Glu56Lys | p.E56K | Q16543 | protein_coding | tolerated(0.15) | benign(0.295) | TCGA-HM-A4S6-01 | Cervix | cervical & endocervical cancer | Female | <65 | III/IV | Chemotherapy | cisplatin | CR |
| CDC37 | SNV | Missense_Mutation | rs751173951 | c.1004N>A | p.Arg335His | p.R335H | Q16543 | protein_coding | deleterious(0) | probably_damaging(0.944) | TCGA-MA-AA42-01 | Cervix | cervical & endocervical cancer | Female | >=65 | I/II | Unknown | Unknown | SD |
| CDC37 | SNV | Missense_Mutation | c.358N>G | p.Ser120Gly | p.S120G | Q16543 | protein_coding | tolerated(0.07) | possibly_damaging(0.579) | TCGA-A6-3809-01 | Colorectum | colon adenocarcinoma | Female | >=65 | I/II | Unknown | Unknown | SD | |
| CDC37 | SNV | Missense_Mutation | c.207N>T | p.Lys69Asn | p.K69N | Q16543 | protein_coding | tolerated(0.15) | benign(0.007) | TCGA-AA-3710-01 | Colorectum | colon adenocarcinoma | Female | >=65 | I/II | Unknown | Unknown | SD |
| Page: 1 2 3 4 5 |
Top |
Related drugs of malignant transformation related genes |
| Identification of chemicals and drugs interact with genes involved in malignant transfromation |
| (DGIdb 4.0) |
| Entrez ID | Symbol | Category | Interaction Types | Drug Claim Name | Drug Name | PMIDs |
| 11140 | CDC37 | KINASE | SODIUM MOLYBDATE | SODIUM MOLYBDATE | 21486005 | |
| 11140 | CDC37 | KINASE | GELDANAMYCIN | GELDANAMYCIN | 21486005 |
| Page: 1 |

Copyright 2023-Present -The University of Texas Health Science Center at Houston |