
|
|||||
|
 | |
| |
| |
| |
| |
| |
|
Gene: CD46 |
Gene summary for CD46 |
| Gene information | Species | Human | Gene symbol | CD46 | Gene ID | 4179 |
| Gene name | CD46 molecule | |
| Gene Alias | AHUS2 | |
| Cytomap | 1q32.2 | |
| Gene Type | protein-coding | GO ID | GO:0000003 | UniProtAcc | P15529 |
Top |
Malignant transformation analysis |
| Identification of the aberrant gene expression in precancerous and cancerous lesions by comparing the gene expression of stem-like cells in diseased tissues with normal stem cells |
| Entrez ID | Symbol | Replicates | Species | Organ | Tissue | Adj P-value | Log2FC | Malignancy |
| 4179 | CD46 | CA_HPV_1 | Human | Cervix | CC | 1.05e-10 | -2.57e-01 | 0.0264 |
| 4179 | CD46 | CA_HPV_3 | Human | Cervix | CC | 5.27e-03 | 3.45e-02 | 0.0414 |
| 4179 | CD46 | CCI_1 | Human | Cervix | CC | 9.52e-05 | 6.96e-01 | 0.528 |
| 4179 | CD46 | CCI_3 | Human | Cervix | CC | 6.50e-06 | 9.20e-01 | 0.516 |
| 4179 | CD46 | CCII_1 | Human | Cervix | CC | 4.52e-05 | -4.11e-01 | 0.3249 |
| 4179 | CD46 | sample3 | Human | Cervix | CC | 4.21e-05 | 2.51e-01 | 0.1387 |
| 4179 | CD46 | H2 | Human | Cervix | HSIL_HPV | 3.25e-13 | 3.74e-01 | 0.0632 |
| 4179 | CD46 | L1 | Human | Cervix | CC | 1.97e-04 | -2.63e-02 | 0.0802 |
| 4179 | CD46 | T3 | Human | Cervix | CC | 7.65e-06 | 2.31e-01 | 0.1389 |
| 4179 | CD46 | HTA11_3410_2000001011 | Human | Colorectum | AD | 1.77e-16 | -5.86e-01 | 0.0155 |
| 4179 | CD46 | HTA11_2487_2000001011 | Human | Colorectum | SER | 2.35e-06 | -4.77e-01 | -0.1808 |
| 4179 | CD46 | HTA11_3361_2000001011 | Human | Colorectum | AD | 1.26e-07 | -6.32e-01 | -0.1207 |
| 4179 | CD46 | HTA11_696_2000001011 | Human | Colorectum | AD | 1.77e-12 | -4.81e-01 | -0.1464 |
| 4179 | CD46 | HTA11_866_2000001011 | Human | Colorectum | AD | 3.85e-08 | -4.48e-01 | -0.1001 |
| 4179 | CD46 | HTA11_8622_2000001021 | Human | Colorectum | SER | 1.02e-02 | -4.91e-01 | 0.0528 |
| 4179 | CD46 | HTA11_99999970781_79442 | Human | Colorectum | MSS | 8.19e-06 | 5.92e-01 | 0.294 |
| 4179 | CD46 | HTA11_99999965062_69753 | Human | Colorectum | MSI-H | 8.37e-13 | 1.49e+00 | 0.3487 |
| 4179 | CD46 | F007 | Human | Colorectum | FAP | 4.73e-03 | -6.31e-02 | 0.1176 |
| 4179 | CD46 | A001-C-207 | Human | Colorectum | FAP | 9.37e-04 | -5.91e-02 | 0.1278 |
| 4179 | CD46 | A015-C-203 | Human | Colorectum | FAP | 7.51e-32 | -2.86e-01 | -0.1294 |
| Page: 1 2 3 4 5 6 7 8 9 10 11 12 |
| Tissue | Expression Dynamics | Abbreviation |
| Cervix | 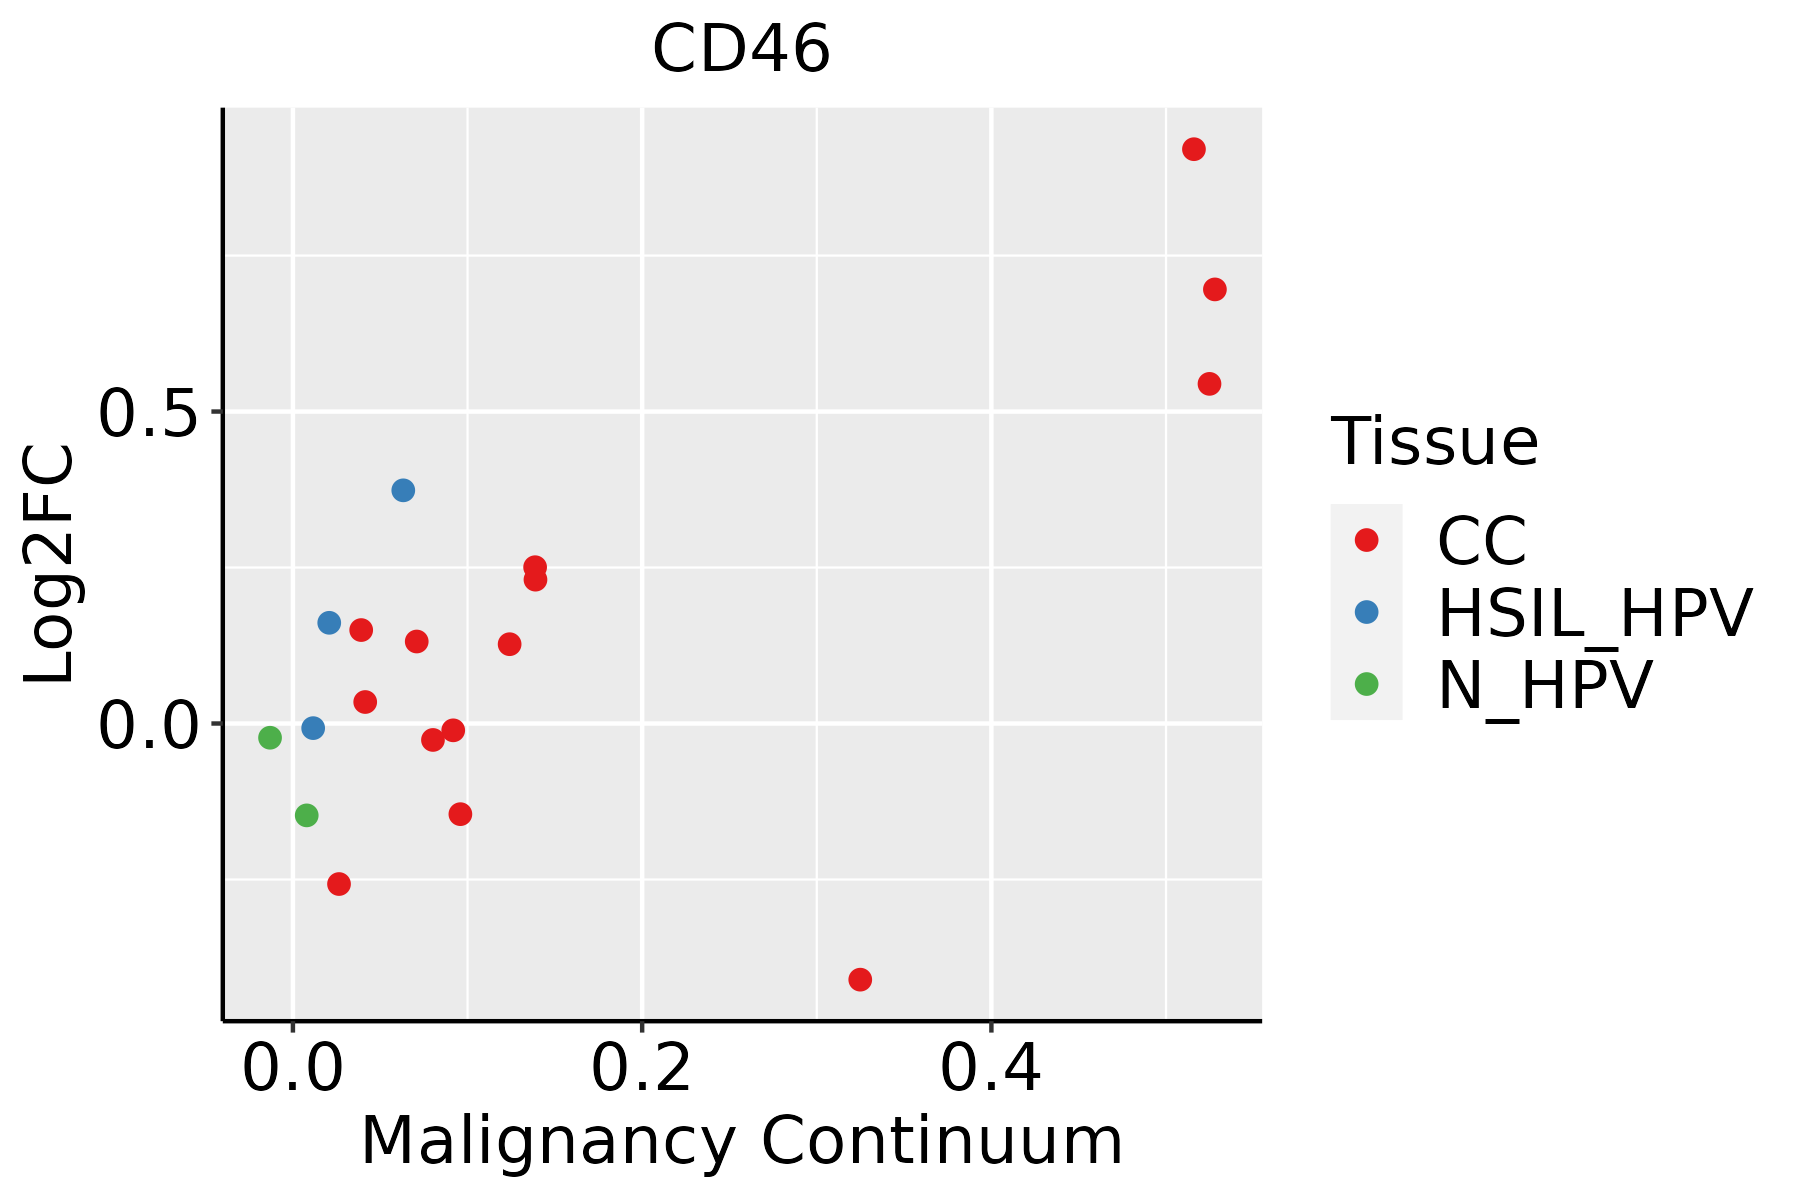 | CC: Cervix cancer |
| HSIL_HPV: HPV-infected high-grade squamous intraepithelial lesions | ||
| N_HPV: HPV-infected normal cervix | ||
| Colorectum (GSE201348) |  | FAP: Familial adenomatous polyposis |
| CRC: Colorectal cancer | ||
| Colorectum (HTA11) |  | AD: Adenomas |
| SER: Sessile serrated lesions | ||
| MSI-H: Microsatellite-high colorectal cancer | ||
| MSS: Microsatellite stable colorectal cancer | ||
| Esophagus | 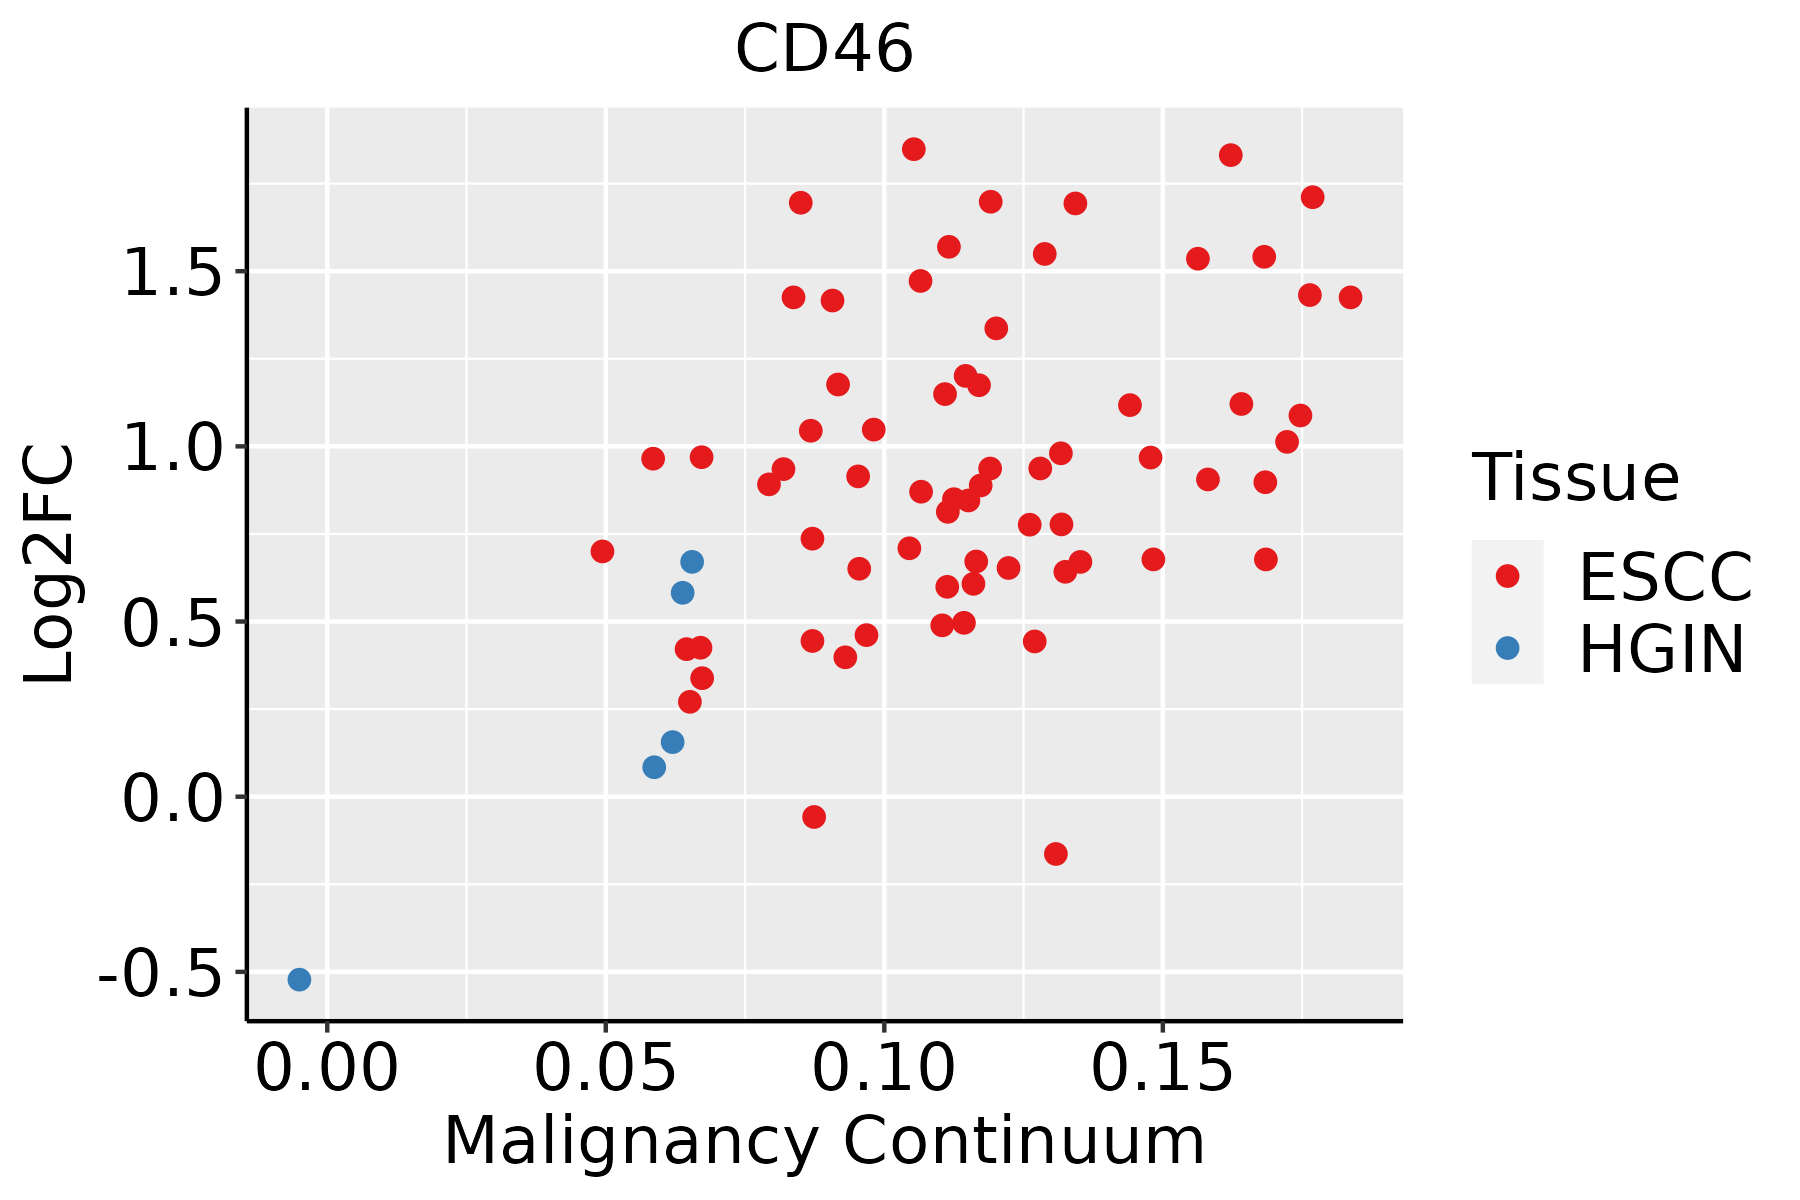 | ESCC: Esophageal squamous cell carcinoma |
| HGIN: High-grade intraepithelial neoplasias | ||
| LGIN: Low-grade intraepithelial neoplasias | ||
| Liver | 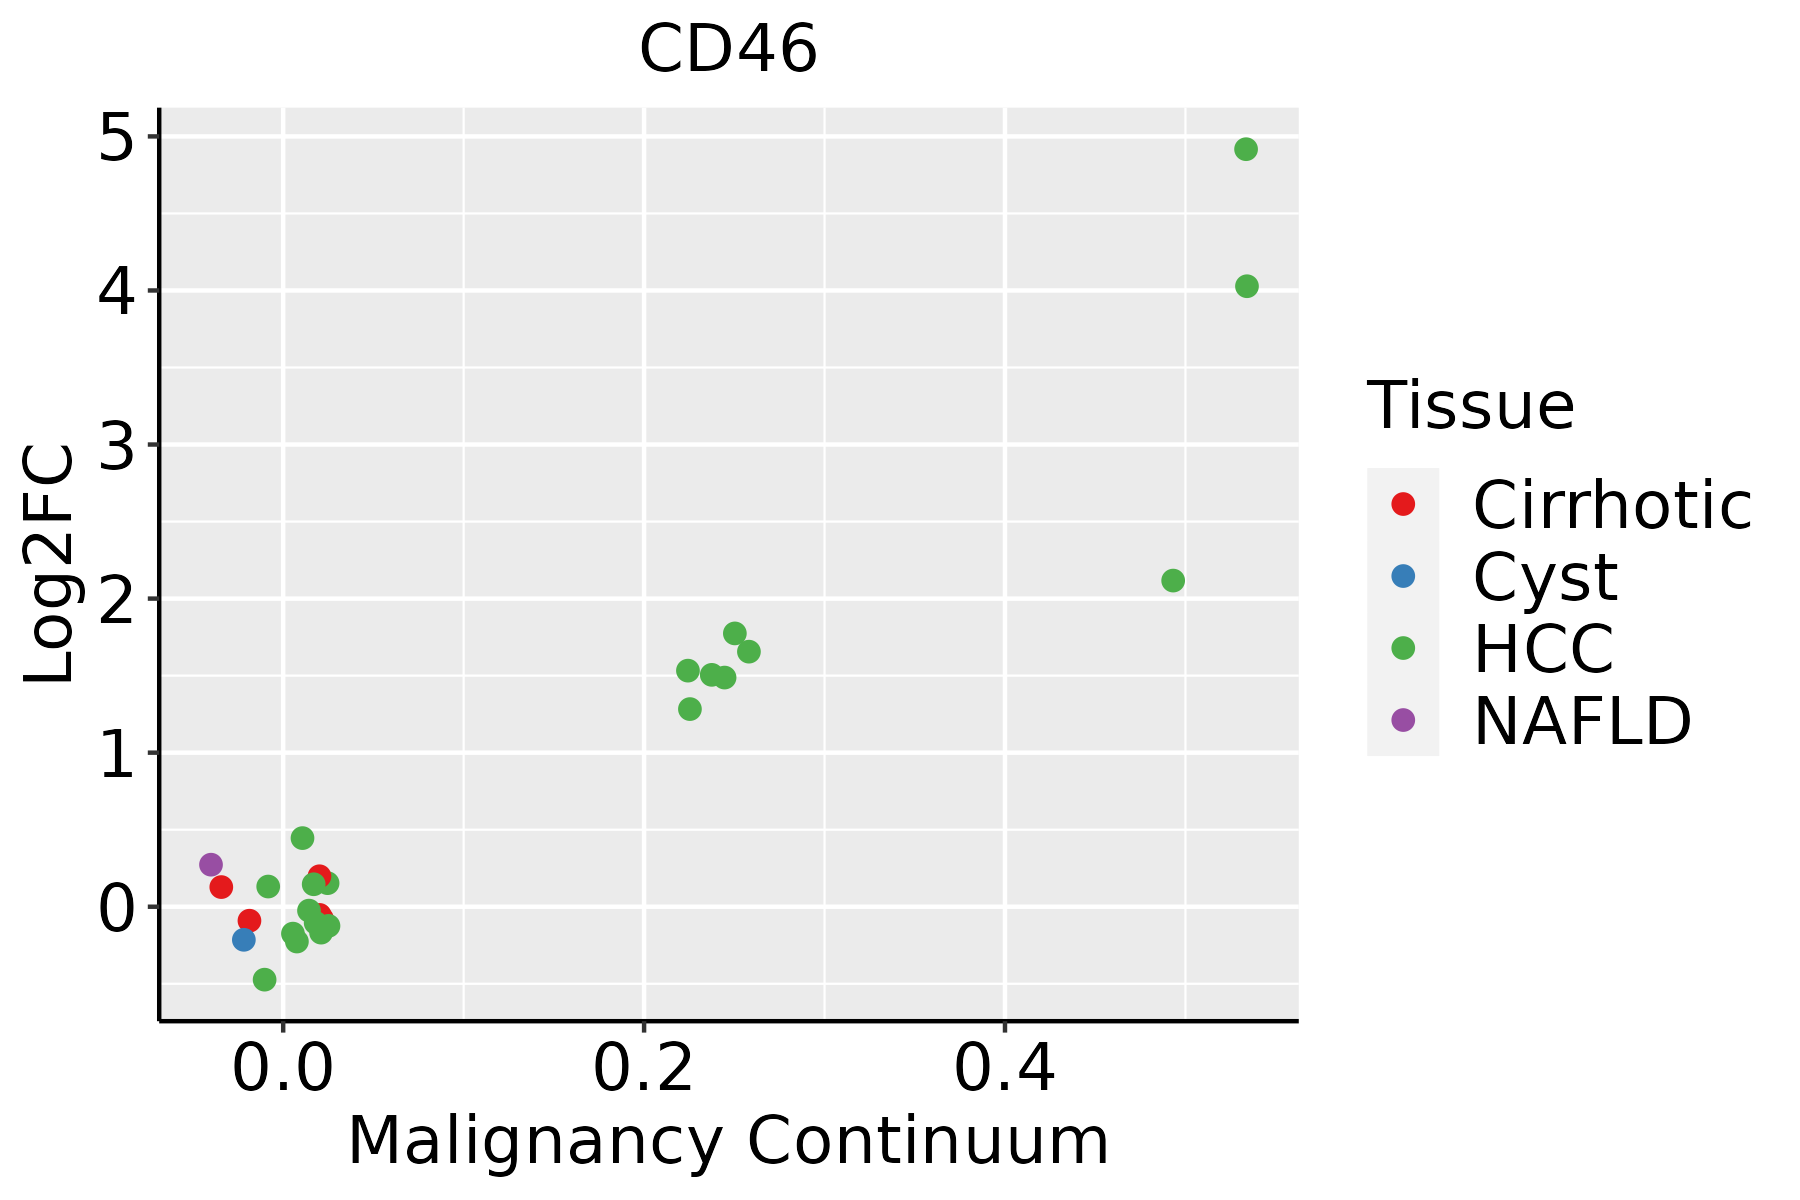 | HCC: Hepatocellular carcinoma |
| NAFLD: Non-alcoholic fatty liver disease | ||
| Lung | 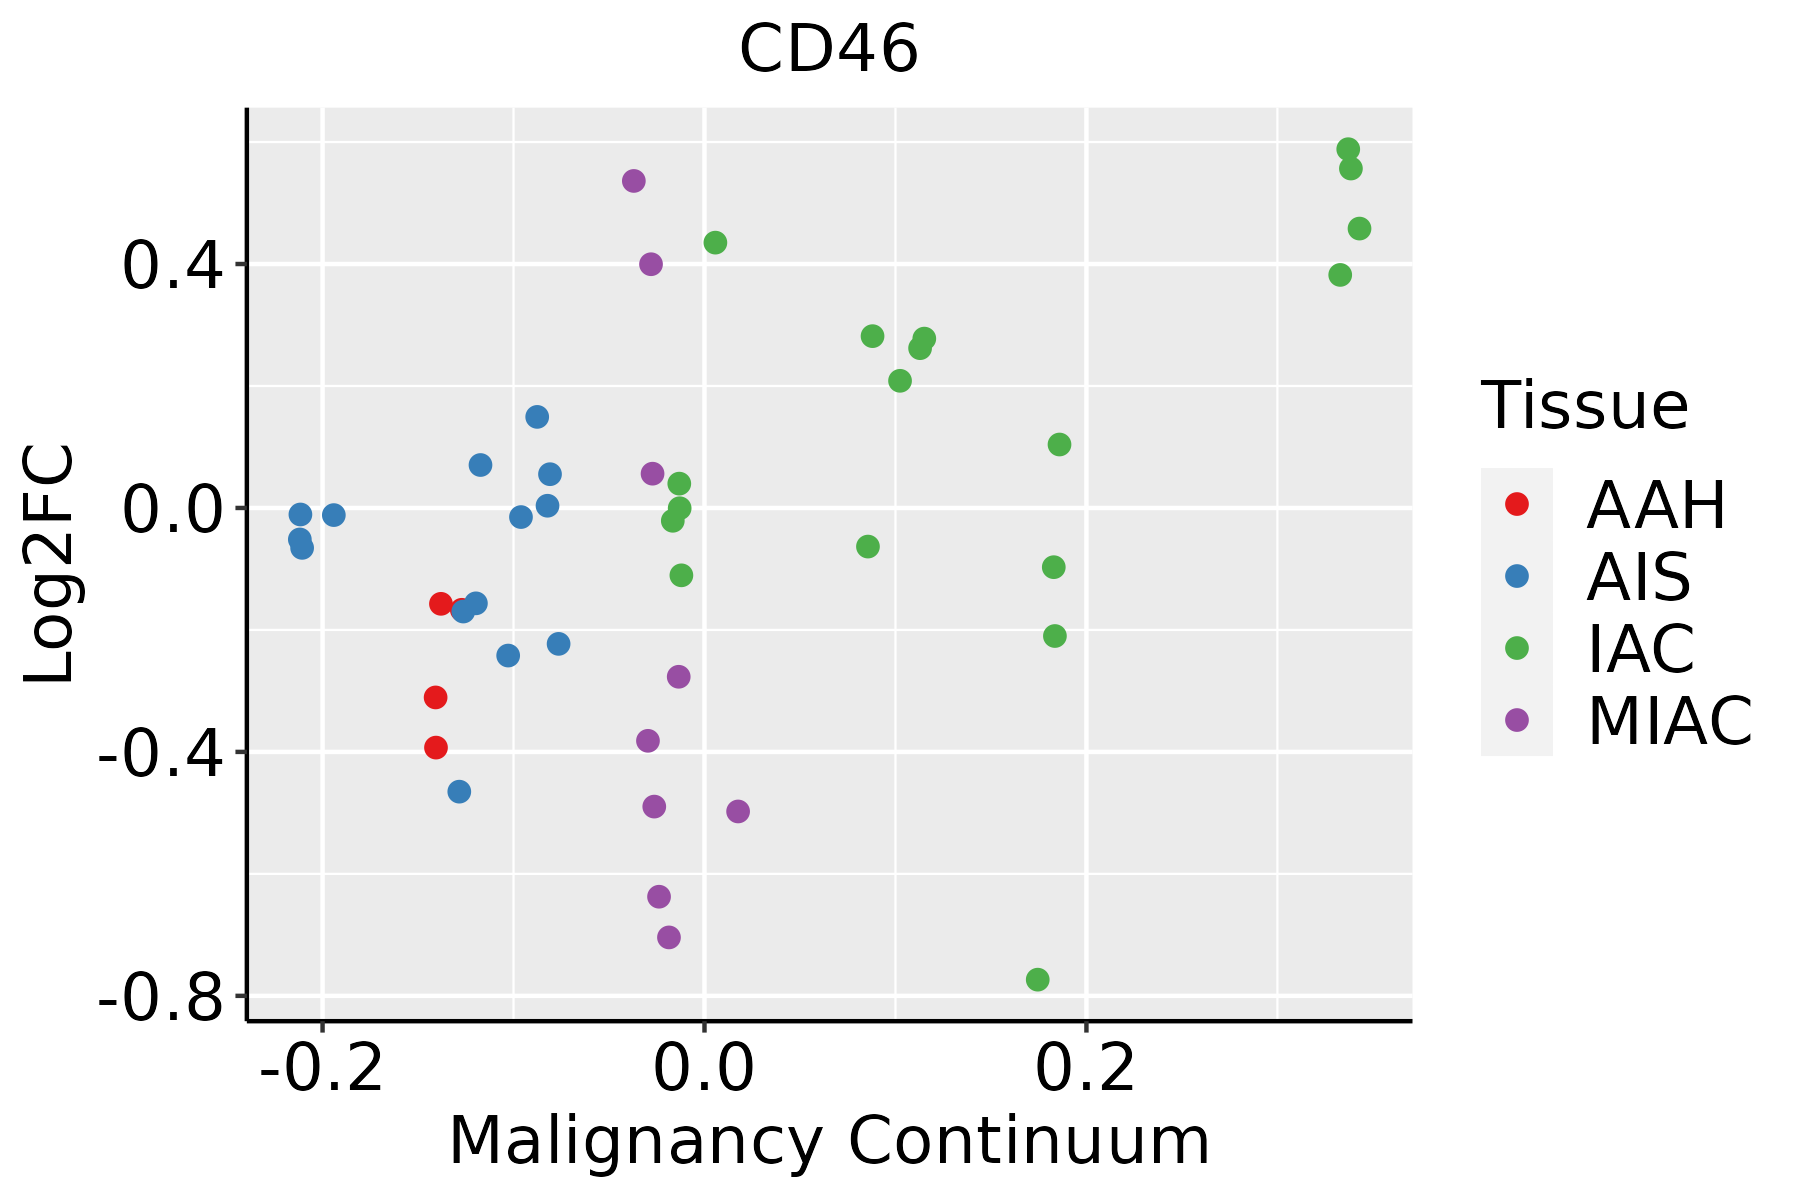 | AAH: Atypical adenomatous hyperplasia |
| AIS: Adenocarcinoma in situ | ||
| IAC: Invasive lung adenocarcinoma | ||
| MIA: Minimally invasive adenocarcinoma | ||
| Oral Cavity | 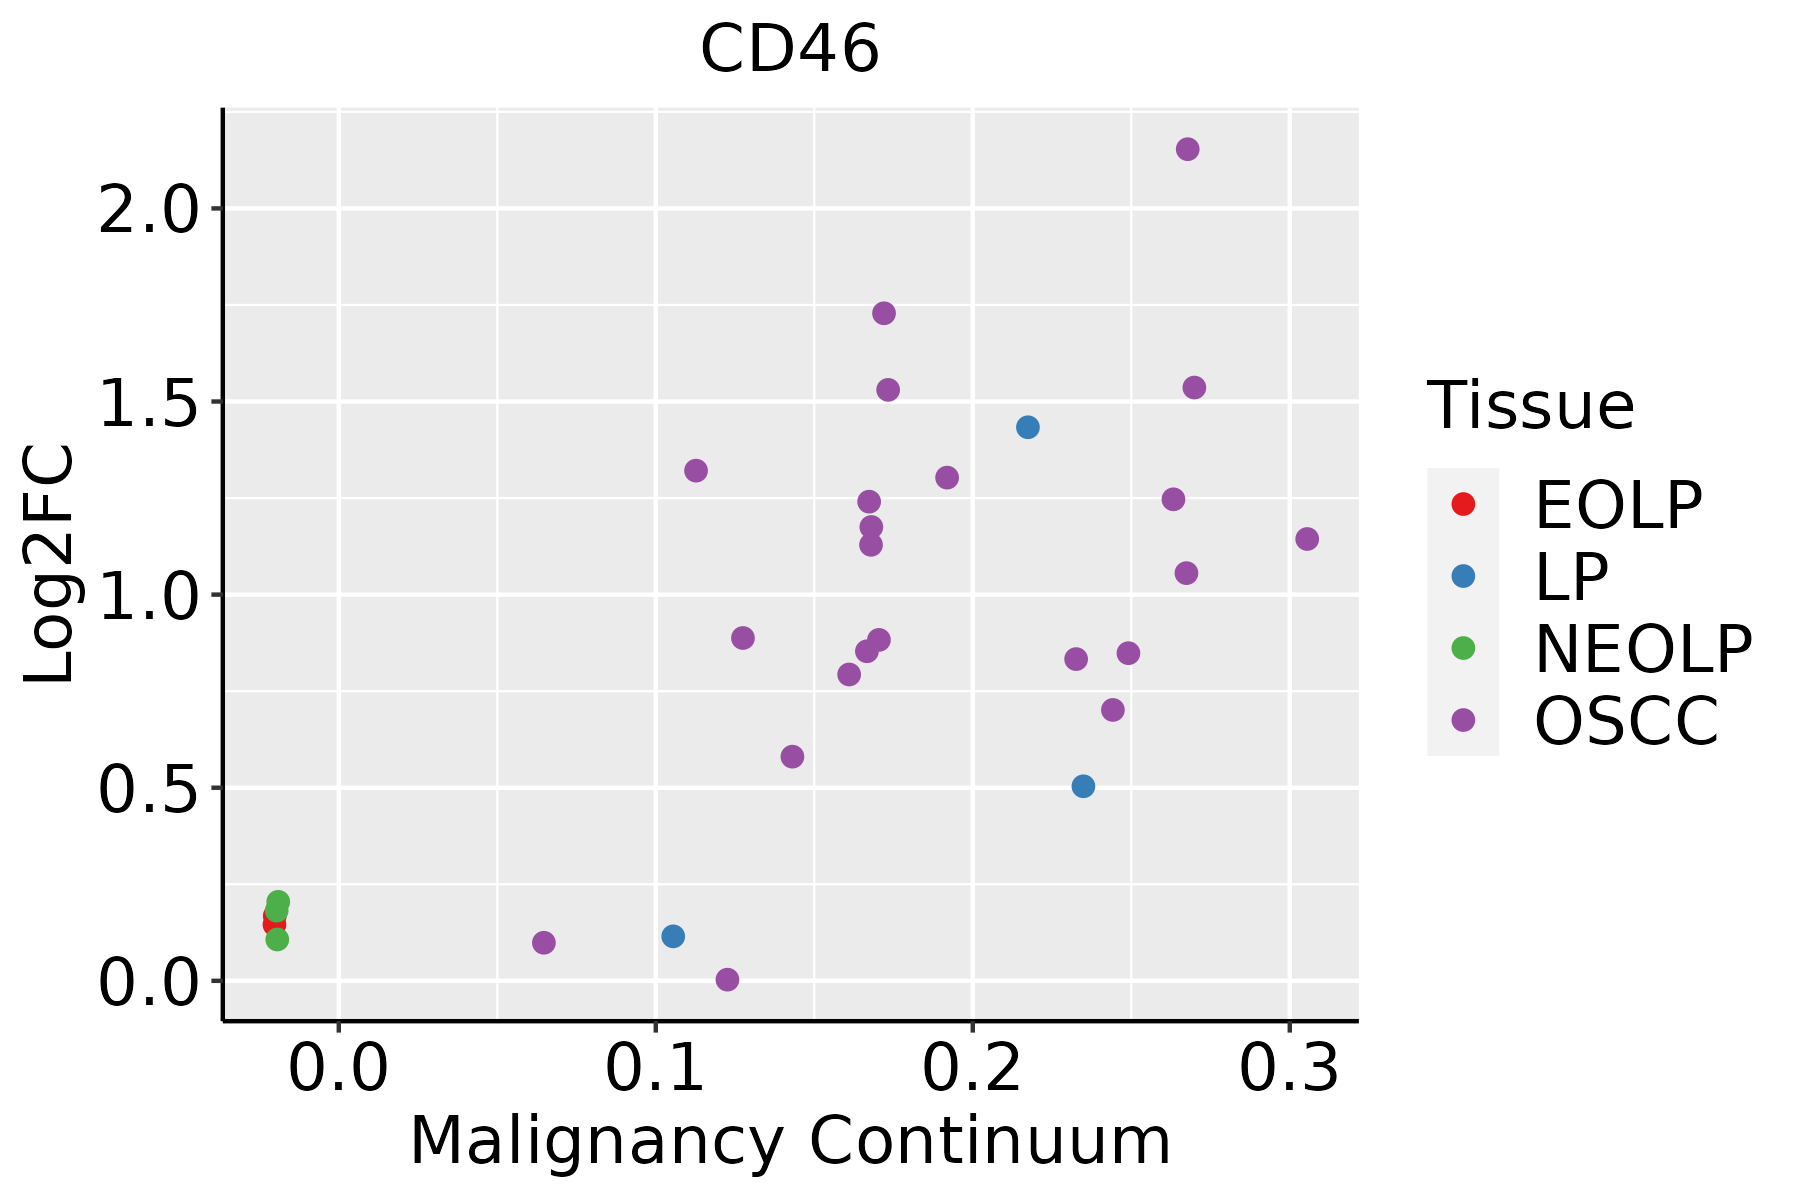 | EOLP: Erosive Oral lichen planus |
| LP: leukoplakia | ||
| NEOLP: Non-erosive oral lichen planus | ||
| OSCC: Oral squamous cell carcinoma | ||
| Prostate | 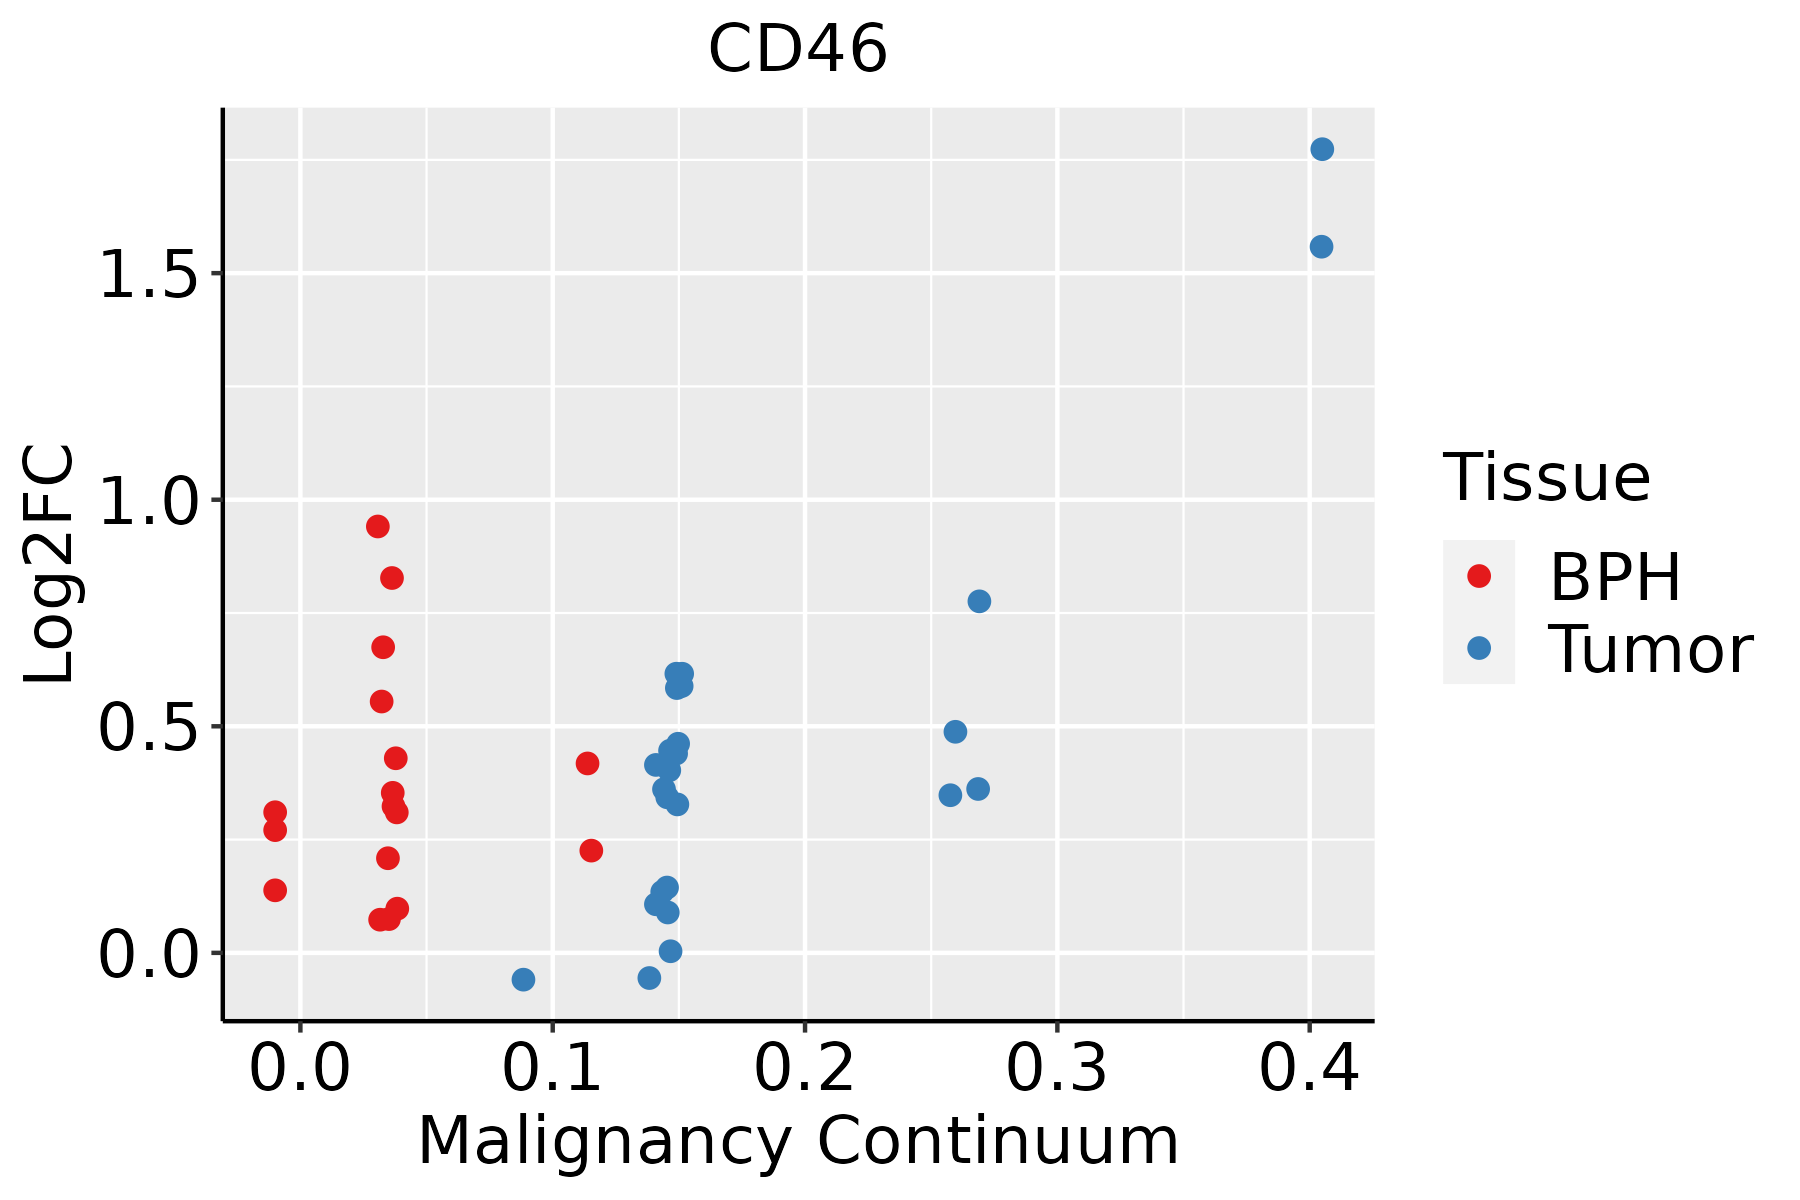 | BPH: Benign Prostatic Hyperplasia |
| Skin | 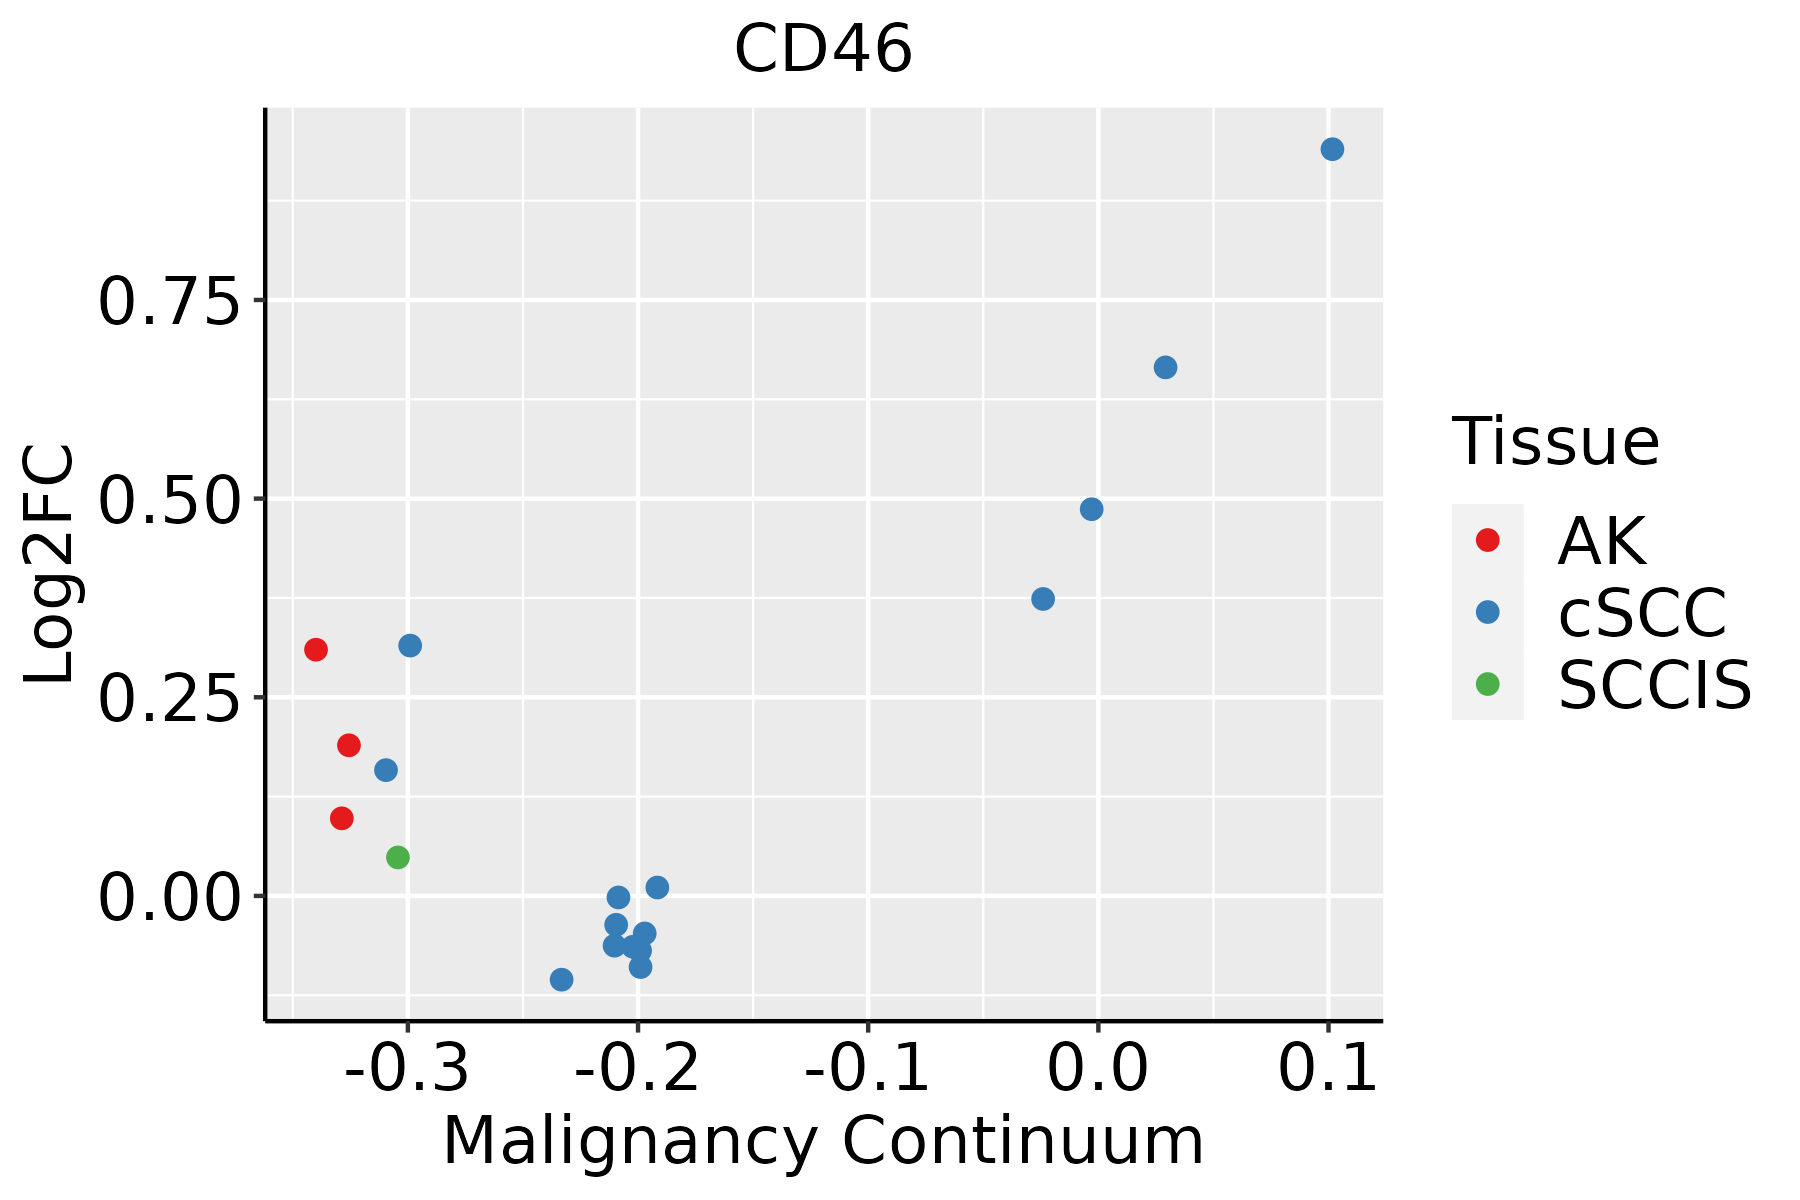 | AK: Actinic keratosis |
| cSCC: Cutaneous squamous cell carcinoma | ||
| SCCIS:squamous cell carcinoma in situ | ||
| Thyroid | 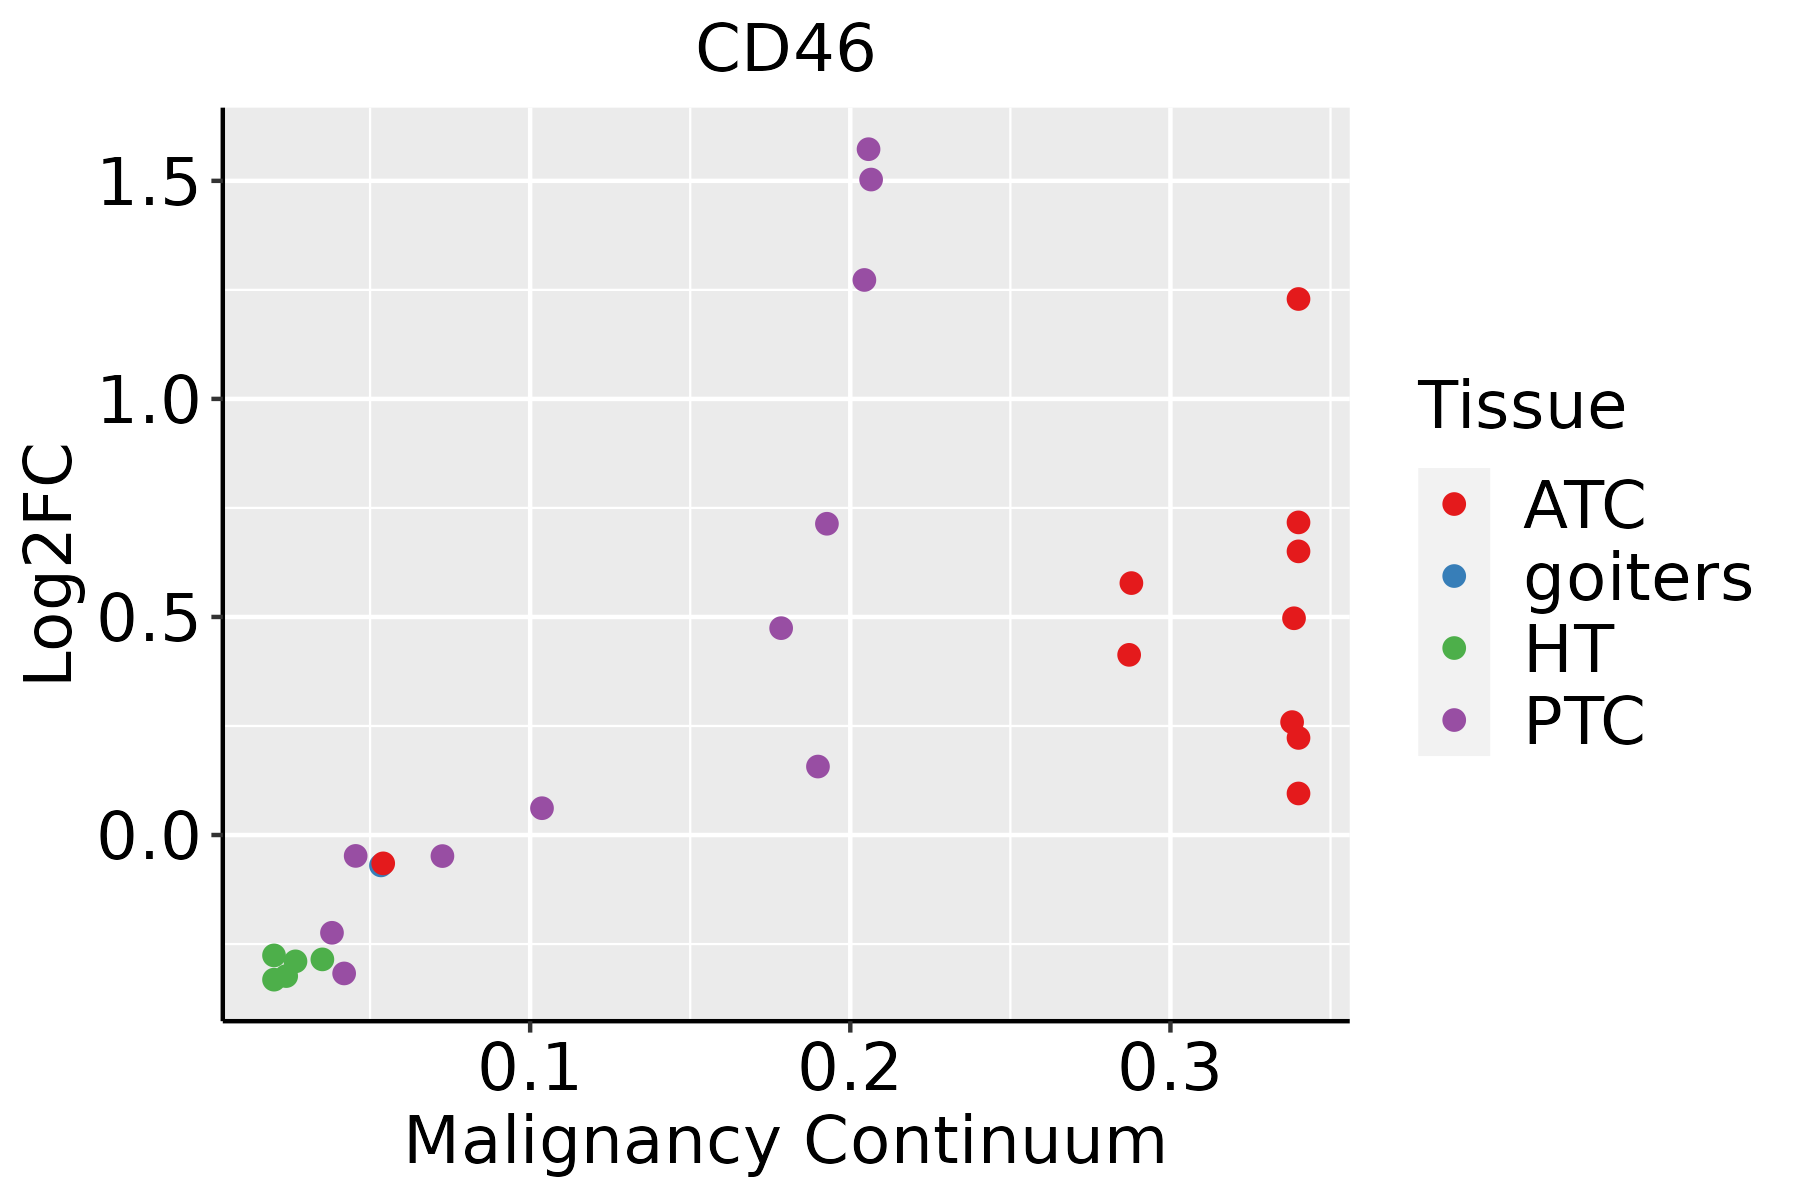 | ATC: Anaplastic thyroid cancer |
| HT: Hashimoto's thyroiditis | ||
| PTC: Papillary thyroid cancer |
| ∗log2FC in expression of this searched gene in stem-like cells from each diseased tissue sample relative to stem-like cells in normal samples in each tissue plotted against the malignancy continuum. Samples are colored based on if they are from different disease stage. |
Top |
Malignant transformation related pathway analysis |
| Find out the enriched GO biological processes and KEGG pathways involved in transition from healthy to precancer to cancer |
| Tissue | Disease Stage | Enriched GO biological Processes |
| Colorectum | AD |  |
| Colorectum | SER |  |
| Colorectum | MSS |  |
| Colorectum | MSI-H |  |
| Colorectum | FAP |  |
| ∗Top 15 enriched GO BP terms are showed in the bar plot of each disease state in each tissue. Each row represents a significant GO biological process which is colored according to the -log10(p.adjust). |
| Page: 1 2 3 4 5 6 7 8 9 |
| GO ID | Tissue | Disease Stage | Description | Gene Ratio | Bg Ratio | pvalue | p.adjust | Count |
| GO:00508636 | Lung | IAC | regulation of T cell activation | 54/2061 | 329/18723 | 1.77e-03 | 1.82e-02 | 54 |
| GO:19031311 | Lung | IAC | mononuclear cell differentiation | 66/2061 | 426/18723 | 2.63e-03 | 2.44e-02 | 66 |
| GO:19030376 | Lung | IAC | regulation of leukocyte cell-cell adhesion | 54/2061 | 336/18723 | 2.82e-03 | 2.55e-02 | 54 |
| GO:00085932 | Lung | IAC | regulation of Notch signaling pathway | 20/2061 | 95/18723 | 3.15e-03 | 2.75e-02 | 20 |
| GO:00420986 | Lung | IAC | T cell proliferation | 34/2061 | 199/18723 | 6.20e-03 | 4.47e-02 | 34 |
| GO:19037068 | Lung | IAC | regulation of hemopoiesis | 56/2061 | 367/18723 | 7.23e-03 | 4.94e-02 | 56 |
| GO:001603213 | Lung | AIS | viral process | 85/1849 | 415/18723 | 4.74e-11 | 1.95e-08 | 85 |
| GO:001905813 | Lung | AIS | viral life cycle | 68/1849 | 317/18723 | 5.39e-10 | 1.16e-07 | 68 |
| GO:004671813 | Lung | AIS | viral entry into host cell | 38/1849 | 144/18723 | 1.13e-08 | 1.68e-06 | 38 |
| GO:005212613 | Lung | AIS | movement in host environment | 43/1849 | 175/18723 | 1.29e-08 | 1.88e-06 | 43 |
| GO:005170113 | Lung | AIS | biological process involved in interaction with host | 47/1849 | 203/18723 | 2.09e-08 | 2.90e-06 | 47 |
| GO:004440913 | Lung | AIS | entry into host | 38/1849 | 151/18723 | 4.50e-08 | 5.24e-06 | 38 |
| GO:004440313 | Lung | AIS | biological process involved in symbiotic interaction | 58/1849 | 290/18723 | 1.33e-07 | 1.44e-05 | 58 |
| GO:004578513 | Lung | AIS | positive regulation of cell adhesion | 77/1849 | 437/18723 | 3.40e-07 | 2.83e-05 | 77 |
| GO:00085931 | Lung | AIS | regulation of Notch signaling pathway | 20/1849 | 95/18723 | 8.52e-04 | 1.17e-02 | 20 |
| GO:00072193 | Lung | AIS | Notch signaling pathway | 29/1849 | 172/18723 | 2.93e-03 | 2.92e-02 | 29 |
| GO:002240711 | Lung | AIS | regulation of cell-cell adhesion | 62/1849 | 448/18723 | 4.01e-03 | 3.65e-02 | 62 |
| GO:0090713 | Lung | AIS | immunological memory process | 6/1849 | 17/18723 | 4.36e-03 | 3.88e-02 | 6 |
| GO:004578523 | Lung | MIAC | positive regulation of cell adhesion | 47/967 | 437/18723 | 1.62e-06 | 2.10e-04 | 47 |
| GO:001905833 | Lung | MIAC | viral life cycle | 36/967 | 317/18723 | 8.00e-06 | 7.07e-04 | 36 |
| Page: 1 2 3 4 5 6 7 8 9 10 11 12 13 14 15 16 17 18 19 20 21 22 23 24 25 26 27 28 29 |
| Pathway ID | Tissue | Disease Stage | Description | Gene Ratio | Bg Ratio | pvalue | p.adjust | qvalue | Count |
| hsa051629 | Esophagus | ESCC | Measles | 90/4205 | 139/8465 | 2.16e-04 | 7.87e-04 | 4.03e-04 | 90 |
| hsa0516213 | Esophagus | ESCC | Measles | 90/4205 | 139/8465 | 2.16e-04 | 7.87e-04 | 4.03e-04 | 90 |
| hsa04610 | Liver | NAFLD | Complement and coagulation cascades | 35/1043 | 86/8465 | 2.48e-11 | 2.04e-09 | 1.64e-09 | 35 |
| hsa046101 | Liver | NAFLD | Complement and coagulation cascades | 35/1043 | 86/8465 | 2.48e-11 | 2.04e-09 | 1.64e-09 | 35 |
| hsa046102 | Liver | Cirrhotic | Complement and coagulation cascades | 48/2530 | 86/8465 | 4.41e-07 | 5.44e-06 | 3.35e-06 | 48 |
| hsa046103 | Liver | Cirrhotic | Complement and coagulation cascades | 48/2530 | 86/8465 | 4.41e-07 | 5.44e-06 | 3.35e-06 | 48 |
| hsa046104 | Liver | HCC | Complement and coagulation cascades | 57/4020 | 86/8465 | 3.19e-04 | 1.45e-03 | 8.04e-04 | 57 |
| hsa046105 | Liver | HCC | Complement and coagulation cascades | 57/4020 | 86/8465 | 3.19e-04 | 1.45e-03 | 8.04e-04 | 57 |
| hsa05162 | Lung | IAC | Measles | 27/1053 | 139/8465 | 1.16e-02 | 4.20e-02 | 2.79e-02 | 27 |
| hsa051621 | Lung | IAC | Measles | 27/1053 | 139/8465 | 1.16e-02 | 4.20e-02 | 2.79e-02 | 27 |
| hsa051628 | Oral cavity | OSCC | Measles | 90/3704 | 139/8465 | 4.10e-07 | 2.50e-06 | 1.27e-06 | 90 |
| hsa0516212 | Oral cavity | OSCC | Measles | 90/3704 | 139/8465 | 4.10e-07 | 2.50e-06 | 1.27e-06 | 90 |
| hsa0516221 | Oral cavity | LP | Measles | 59/2418 | 139/8465 | 2.90e-04 | 1.60e-03 | 1.03e-03 | 59 |
| hsa0516231 | Oral cavity | LP | Measles | 59/2418 | 139/8465 | 2.90e-04 | 1.60e-03 | 1.03e-03 | 59 |
| hsa051626 | Oral cavity | NEOLP | Measles | 35/1112 | 139/8465 | 8.30e-05 | 6.14e-04 | 3.86e-04 | 35 |
| hsa051627 | Oral cavity | NEOLP | Measles | 35/1112 | 139/8465 | 8.30e-05 | 6.14e-04 | 3.86e-04 | 35 |
| hsa051624 | Prostate | BPH | Measles | 42/1718 | 139/8465 | 3.35e-03 | 1.23e-02 | 7.61e-03 | 42 |
| hsa0516211 | Prostate | BPH | Measles | 42/1718 | 139/8465 | 3.35e-03 | 1.23e-02 | 7.61e-03 | 42 |
| hsa051622 | Prostate | Tumor | Measles | 44/1791 | 139/8465 | 2.33e-03 | 8.85e-03 | 5.49e-03 | 44 |
| hsa051623 | Prostate | Tumor | Measles | 44/1791 | 139/8465 | 2.33e-03 | 8.85e-03 | 5.49e-03 | 44 |
| Page: 1 |
Top |
Cell-cell communication analysis |
| Identification of potential cell-cell interactions between two cell types and their ligand-receptor pairs for different disease states |
| Ligand | Receptor | LRpair | Pathway | Tissue | Disease Stage |
| CD46 | JAG1 | CD46_JAG1 | CD46 | Breast | ADJ |
| CD46 | JAG1 | CD46_JAG1 | CD46 | Breast | DCIS |
| CD46 | JAG1 | CD46_JAG1 | CD46 | Breast | Healthy |
| CD46 | JAG1 | CD46_JAG1 | CD46 | Breast | IDC |
| CD46 | JAG1 | CD46_JAG1 | CD46 | Breast | Precancer |
| CD46 | JAG1 | CD46_JAG1 | CD46 | Cervix | CC |
| CD46 | JAG1 | CD46_JAG1 | CD46 | Cervix | Precancer |
| CD46 | JAG1 | CD46_JAG1 | CD46 | CRC | ADJ |
| CD46 | JAG1 | CD46_JAG1 | CD46 | CRC | CRC |
| CD46 | JAG1 | CD46_JAG1 | CD46 | CRC | FAP |
| CD46 | JAG1 | CD46_JAG1 | CD46 | CRC | Healthy |
| CD46 | JAG1 | CD46_JAG1 | CD46 | CRC | MSI-H |
| CD46 | JAG1 | CD46_JAG1 | CD46 | CRC | MSS |
| CD46 | JAG1 | CD46_JAG1 | CD46 | CRC | SER |
| CD46 | JAG1 | CD46_JAG1 | CD46 | Endometrium | ADJ |
| CD46 | JAG1 | CD46_JAG1 | CD46 | Endometrium | AEH |
| CD46 | JAG1 | CD46_JAG1 | CD46 | Endometrium | EEC |
| CD46 | JAG1 | CD46_JAG1 | CD46 | Endometrium | Healthy |
| CD46 | JAG1 | CD46_JAG1 | CD46 | Esophagus | ESCC |
| CD46 | JAG1 | CD46_JAG1 | CD46 | Esophagus | Healthy |
| Page: 1 2 3 |
Top |
Single-cell gene regulatory network inference analysis |
| Find out the significant the regulons (TFs) and the target genes of each regulon across cell types for different disease states |
| TF | Cell Type | Tissue | Disease Stage | Target Gene | RSS | Regulon Activity |
| ∗The dot plots of a searched regulon are shown for all cell subpopulations in each disease state of each tissue based on the regulon specific score inferred using pySCENIC and by calculating the average expression. |
| Page: 1 |
Top |
Somatic mutation of malignant transformation related genes |
| Annotation of somatic variants for genes involved in malignant transformation |
| Hugo Symbol | Variant Class | Variant Classification | dbSNP RS | HGVSc | HGVSp | HGVSp Short | SWISSPROT | BIOTYPE | SIFT | PolyPhen | Tumor Sample Barcode | Tissue | Histology | Sex | Age | Stage | Therapy Types | Drugs | Outcome |
| CD46 | SNV | Missense_Mutation | novel | c.200N>C | p.Gly67Ala | p.G67A | P15529 | protein_coding | tolerated(0.1) | probably_damaging(0.969) | TCGA-5L-AAT1-01 | Breast | breast invasive carcinoma | Female | <65 | III/IV | Hormone Therapy | letrozol | SD |
| CD46 | SNV | Missense_Mutation | novel | c.310G>A | p.Asp104Asn | p.D104N | P15529 | protein_coding | tolerated(0.56) | benign(0.012) | TCGA-A1-A0SF-01 | Breast | breast invasive carcinoma | Female | <65 | I/II | Chemotherapy | tc | SD |
| CD46 | SNV | Missense_Mutation | novel | c.178G>A | p.Val60Ile | p.V60I | P15529 | protein_coding | tolerated(1) | benign(0.278) | TCGA-A8-A0A6-01 | Breast | breast invasive carcinoma | Female | <65 | III/IV | Chemotherapy | epirubicin | CR |
| CD46 | SNV | Missense_Mutation | c.103N>G | p.Cys35Gly | p.C35G | P15529 | protein_coding | deleterious(0) | probably_damaging(1) | TCGA-BH-A204-01 | Breast | breast invasive carcinoma | Female | >=65 | I/II | Unknown | Unknown | SD | |
| CD46 | SNV | Missense_Mutation | novel | c.43C>T | p.Arg15Cys | p.R15C | P15529 | protein_coding | tolerated(0.13) | benign(0.049) | TCGA-2W-A8YY-01 | Cervix | cervical & endocervical cancer | Female | <65 | I/II | Chemotherapy | cisplatin | CR |
| CD46 | SNV | Missense_Mutation | novel | c.354N>T | p.Glu118Asp | p.E118D | P15529 | protein_coding | tolerated(0.52) | benign(0.071) | TCGA-EK-A2H0-01 | Cervix | cervical & endocervical cancer | Female | <65 | I/II | Chemotherapy | cisplatin | CR |
| CD46 | SNV | Missense_Mutation | c.1122N>T | p.Lys374Asn | p.K374N | P15529 | protein_coding | deleterious(0) | probably_damaging(0.993) | TCGA-AA-A010-01 | Colorectum | colon adenocarcinoma | Female | <65 | I/II | Chemotherapy | folinic | CR | |
| CD46 | SNV | Missense_Mutation | rs747504551 | c.554N>G | p.Asp185Gly | p.D185G | P15529 | protein_coding | deleterious(0) | possibly_damaging(0.596) | TCGA-AA-A01P-01 | Colorectum | colon adenocarcinoma | Female | >=65 | III/IV | Unknown | Unknown | PD |
| CD46 | SNV | Missense_Mutation | c.422N>A | p.Cys141Tyr | p.C141Y | P15529 | protein_coding | deleterious(0) | probably_damaging(1) | TCGA-CK-5916-01 | Colorectum | colon adenocarcinoma | Female | >=65 | I/II | Unknown | Unknown | PD | |
| CD46 | SNV | Missense_Mutation | c.968N>A | p.Pro323His | p.P323H | P15529 | protein_coding | deleterious(0.03) | benign(0.359) | TCGA-G4-6302-01 | Colorectum | colon adenocarcinoma | Female | >=65 | I/II | Unknown | Unknown | SD |
| Page: 1 2 3 4 5 |
Top |
Related drugs of malignant transformation related genes |
| Identification of chemicals and drugs interact with genes involved in malignant transfromation |
| (DGIdb 4.0) |
| Entrez ID | Symbol | Category | Interaction Types | Drug Claim Name | Drug Name | PMIDs |
| Page: 1 |

Copyright 2023-Present -The University of Texas Health Science Center at Houston |