
|
|||||
|
 | |
| |
| |
| |
| |
| |
|
Gene: CCDC8 |
Gene summary for CCDC8 |
| Gene information | Species | Human | Gene symbol | CCDC8 | Gene ID | 83987 |
| Gene name | coiled-coil domain containing 8 | |
| Gene Alias | 3M3 | |
| Cytomap | 19q13.32 | |
| Gene Type | protein-coding | GO ID | GO:0000226 | UniProtAcc | G8IFA7 |
Top |
Malignant transformation analysis |
| Identification of the aberrant gene expression in precancerous and cancerous lesions by comparing the gene expression of stem-like cells in diseased tissues with normal stem cells |
| Entrez ID | Symbol | Replicates | Species | Organ | Tissue | Adj P-value | Log2FC | Malignancy |
| 83987 | CCDC8 | P2T-E | Human | Esophagus | ESCC | 1.82e-12 | 2.21e-01 | 0.1177 |
| 83987 | CCDC8 | P5T-E | Human | Esophagus | ESCC | 1.13e-16 | 3.26e-01 | 0.1327 |
| 83987 | CCDC8 | P12T-E | Human | Esophagus | ESCC | 3.31e-19 | 4.07e-01 | 0.1122 |
| 83987 | CCDC8 | P15T-E | Human | Esophagus | ESCC | 5.19e-07 | 1.81e-01 | 0.1149 |
| 83987 | CCDC8 | P21T-E | Human | Esophagus | ESCC | 9.56e-08 | 2.01e-01 | 0.1617 |
| 83987 | CCDC8 | P31T-E | Human | Esophagus | ESCC | 9.20e-06 | 1.27e-01 | 0.1251 |
| 83987 | CCDC8 | P37T-E | Human | Esophagus | ESCC | 2.57e-08 | 1.74e-01 | 0.1371 |
| 83987 | CCDC8 | P42T-E | Human | Esophagus | ESCC | 9.05e-04 | 1.38e-01 | 0.1175 |
| 83987 | CCDC8 | P56T-E | Human | Esophagus | ESCC | 6.66e-05 | 4.10e-01 | 0.1613 |
| 83987 | CCDC8 | P61T-E | Human | Esophagus | ESCC | 2.55e-07 | 1.84e-01 | 0.099 |
| 83987 | CCDC8 | P65T-E | Human | Esophagus | ESCC | 9.91e-08 | 1.69e-01 | 0.0978 |
| 83987 | CCDC8 | P74T-E | Human | Esophagus | ESCC | 4.95e-14 | 3.87e-01 | 0.1479 |
| 83987 | CCDC8 | P76T-E | Human | Esophagus | ESCC | 2.13e-27 | 4.91e-01 | 0.1207 |
| 83987 | CCDC8 | P79T-E | Human | Esophagus | ESCC | 3.95e-30 | 5.07e-01 | 0.1154 |
| 83987 | CCDC8 | P107T-E | Human | Esophagus | ESCC | 1.41e-27 | 5.52e-01 | 0.171 |
| 83987 | CCDC8 | P130T-E | Human | Esophagus | ESCC | 3.51e-31 | 5.63e-01 | 0.1676 |
| Page: 1 |
| Tissue | Expression Dynamics | Abbreviation |
| Esophagus | 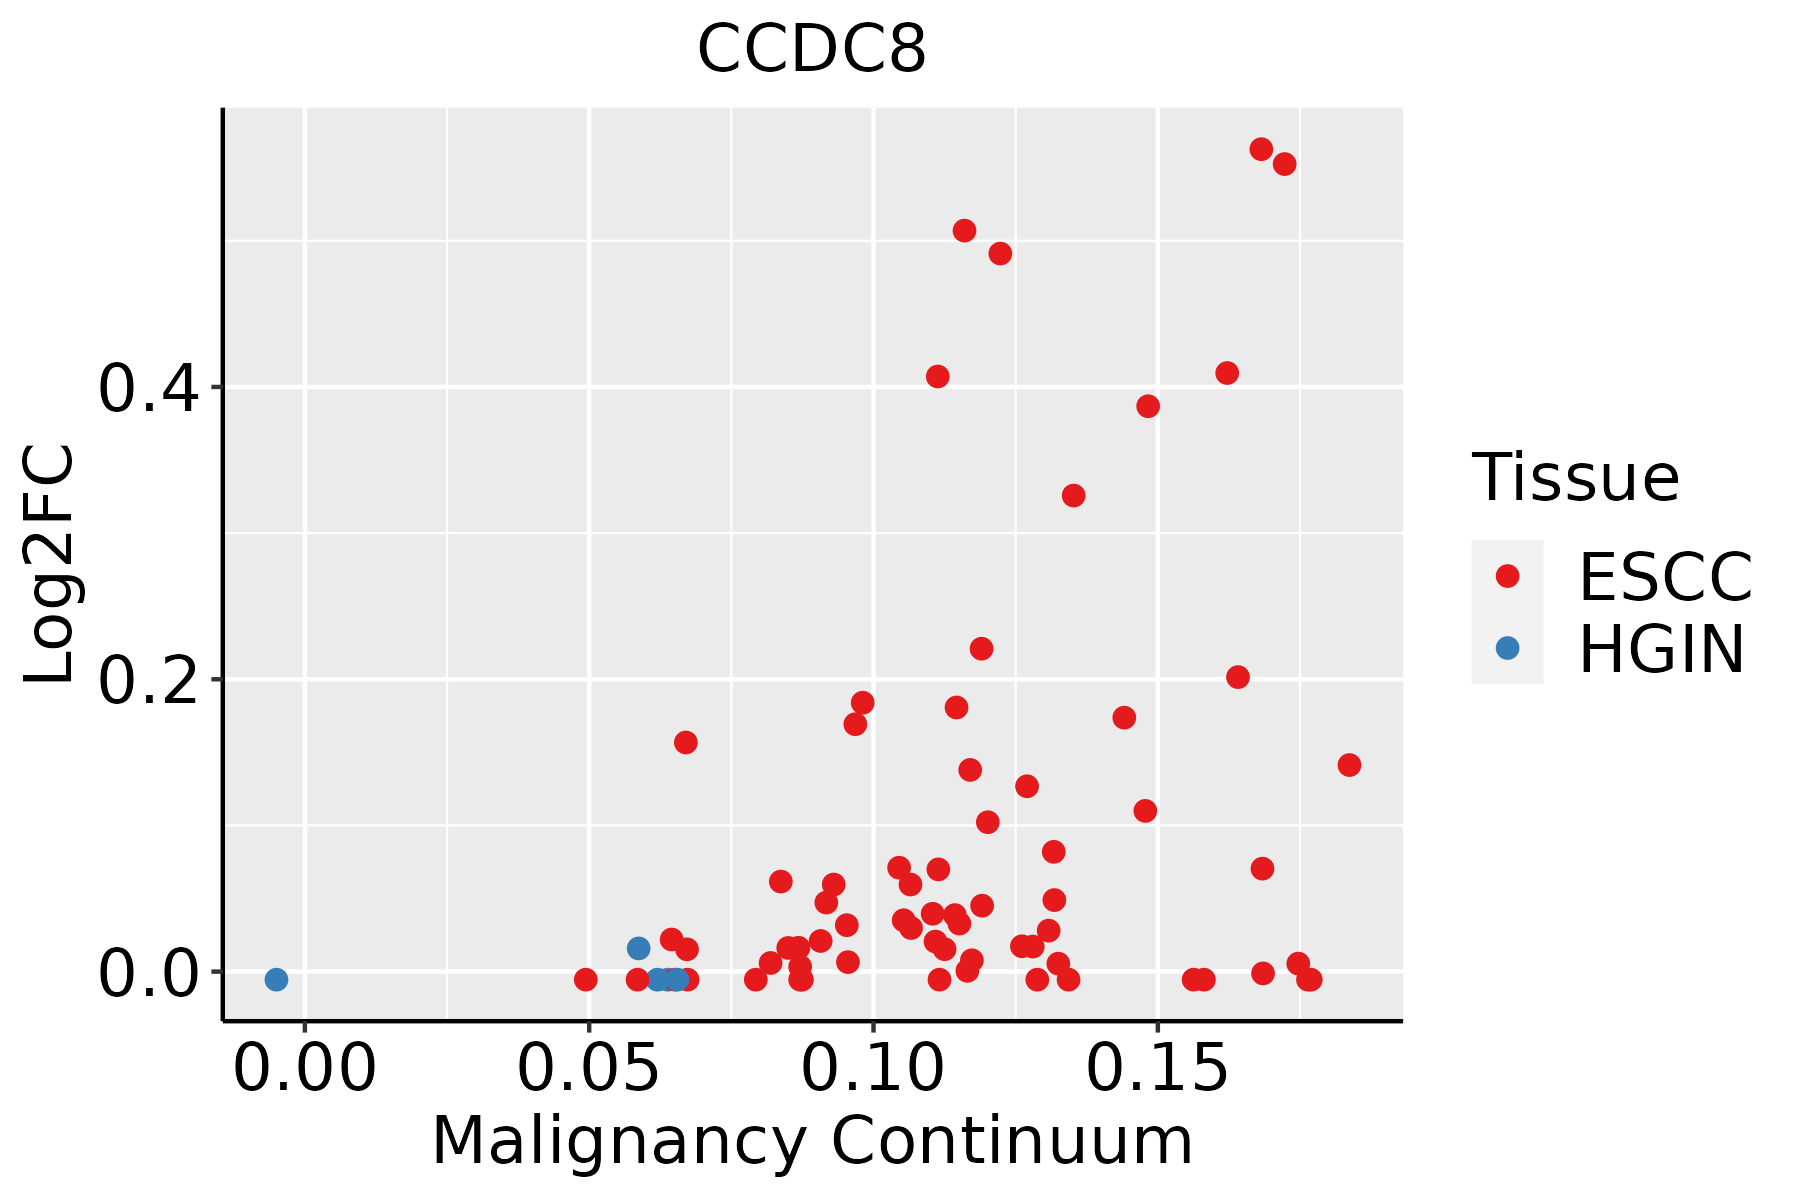 | ESCC: Esophageal squamous cell carcinoma |
| HGIN: High-grade intraepithelial neoplasias | ||
| LGIN: Low-grade intraepithelial neoplasias |
| ∗log2FC in expression of this searched gene in stem-like cells from each diseased tissue sample relative to stem-like cells in normal samples in each tissue plotted against the malignancy continuum. Samples are colored based on if they are from different disease stage. |
Top |
Malignant transformation related pathway analysis |
| Find out the enriched GO biological processes and KEGG pathways involved in transition from healthy to precancer to cancer |
| Tissue | Disease Stage | Enriched GO biological Processes |
| Colorectum | AD |  |
| Colorectum | SER |  |
| Colorectum | MSS |  |
| Colorectum | MSI-H |  |
| Colorectum | FAP |  |
| ∗Top 15 enriched GO BP terms are showed in the bar plot of each disease state in each tissue. Each row represents a significant GO biological process which is colored according to the -log10(p.adjust). |
| Page: 1 2 3 4 5 6 7 8 9 |
| GO ID | Tissue | Disease Stage | Description | Gene Ratio | Bg Ratio | pvalue | p.adjust | Count |
| GO:003297026 | Oral cavity | EOLP | regulation of actin filament-based process | 93/2218 | 397/18723 | 5.39e-11 | 7.03e-09 | 93 |
| GO:003295626 | Oral cavity | EOLP | regulation of actin cytoskeleton organization | 84/2218 | 358/18723 | 4.24e-10 | 3.65e-08 | 84 |
| GO:190290525 | Oral cavity | EOLP | positive regulation of supramolecular fiber organization | 57/2218 | 209/18723 | 8.27e-10 | 6.12e-08 | 57 |
| GO:005123525 | Oral cavity | EOLP | maintenance of location | 75/2218 | 327/18723 | 1.04e-08 | 4.98e-07 | 75 |
| GO:005165125 | Oral cavity | EOLP | maintenance of location in cell | 54/2218 | 214/18723 | 4.26e-08 | 1.64e-06 | 54 |
| GO:011005326 | Oral cavity | EOLP | regulation of actin filament organization | 65/2218 | 278/18723 | 4.55e-08 | 1.72e-06 | 65 |
| GO:009758122 | Oral cavity | EOLP | lamellipodium organization | 30/2218 | 90/18723 | 6.89e-08 | 2.49e-06 | 30 |
| GO:005149524 | Oral cavity | EOLP | positive regulation of cytoskeleton organization | 55/2218 | 226/18723 | 1.19e-07 | 3.99e-06 | 55 |
| GO:190382925 | Oral cavity | EOLP | positive regulation of cellular protein localization | 63/2218 | 276/18723 | 1.84e-07 | 5.87e-06 | 63 |
| GO:003003214 | Oral cavity | EOLP | lamellipodium assembly | 25/2218 | 72/18723 | 3.46e-07 | 1.01e-05 | 25 |
| GO:003134621 | Oral cavity | EOLP | positive regulation of cell projection organization | 74/2218 | 353/18723 | 6.00e-07 | 1.56e-05 | 74 |
| GO:004518522 | Oral cavity | EOLP | maintenance of protein location | 28/2218 | 94/18723 | 2.44e-06 | 5.45e-05 | 28 |
| GO:001097515 | Oral cavity | EOLP | regulation of neuron projection development | 86/2218 | 445/18723 | 2.75e-06 | 6.05e-05 | 86 |
| GO:003250724 | Oral cavity | EOLP | maintenance of protein location in cell | 22/2218 | 65/18723 | 2.82e-06 | 6.18e-05 | 22 |
| GO:190211712 | Oral cavity | EOLP | positive regulation of organelle assembly | 22/2218 | 67/18723 | 4.97e-06 | 1.02e-04 | 22 |
| GO:007265924 | Oral cavity | EOLP | protein localization to plasma membrane | 59/2218 | 284/18723 | 1.07e-05 | 1.91e-04 | 59 |
| GO:190211521 | Oral cavity | EOLP | regulation of organelle assembly | 43/2218 | 186/18723 | 1.11e-05 | 1.94e-04 | 43 |
| GO:004586017 | Oral cavity | EOLP | positive regulation of protein kinase activity | 74/2218 | 386/18723 | 1.78e-05 | 2.89e-04 | 74 |
| GO:003812723 | Oral cavity | EOLP | ERBB signaling pathway | 31/2218 | 121/18723 | 2.21e-05 | 3.37e-04 | 31 |
| GO:199077823 | Oral cavity | EOLP | protein localization to cell periphery | 65/2218 | 333/18723 | 3.17e-05 | 4.48e-04 | 65 |
| Page: 1 2 3 4 5 6 7 8 9 10 11 12 13 14 15 16 17 18 19 20 21 22 23 24 25 26 27 28 29 30 31 |
| Pathway ID | Tissue | Disease Stage | Description | Gene Ratio | Bg Ratio | pvalue | p.adjust | qvalue | Count |
| Page: 1 |
Top |
Cell-cell communication analysis |
| Identification of potential cell-cell interactions between two cell types and their ligand-receptor pairs for different disease states |
| Ligand | Receptor | LRpair | Pathway | Tissue | Disease Stage |
| Page: 1 |
Top |
Single-cell gene regulatory network inference analysis |
| Find out the significant the regulons (TFs) and the target genes of each regulon across cell types for different disease states |
| TF | Cell Type | Tissue | Disease Stage | Target Gene | RSS | Regulon Activity |
| ∗The dot plots of a searched regulon are shown for all cell subpopulations in each disease state of each tissue based on the regulon specific score inferred using pySCENIC and by calculating the average expression. |
| Page: 1 |
Top |
Somatic mutation of malignant transformation related genes |
| Annotation of somatic variants for genes involved in malignant transformation |
| Hugo Symbol | Variant Class | Variant Classification | dbSNP RS | HGVSc | HGVSp | HGVSp Short | SWISSPROT | BIOTYPE | SIFT | PolyPhen | Tumor Sample Barcode | Tissue | Histology | Sex | Age | Stage | Therapy Types | Drugs | Outcome |
| CCDC8 | SNV | Missense_Mutation | c.704N>T | p.Gly235Val | p.G235V | Q9H0W5 | protein_coding | deleterious_low_confidence(0) | possibly_damaging(0.571) | TCGA-AN-A0AK-01 | Breast | breast invasive carcinoma | Female | >=65 | I/II | Unknown | Unknown | SD | |
| CCDC8 | SNV | Missense_Mutation | rs752421136 | c.1234G>A | p.Val412Ile | p.V412I | Q9H0W5 | protein_coding | tolerated_low_confidence(0.48) | benign(0) | TCGA-BH-A1FH-01 | Breast | breast invasive carcinoma | Female | <65 | III/IV | Unknown | Unknown | PD |
| CCDC8 | SNV | Missense_Mutation | c.1463G>T | p.Trp488Leu | p.W488L | Q9H0W5 | protein_coding | deleterious_low_confidence(0) | probably_damaging(0.998) | TCGA-C8-A275-01 | Breast | breast invasive carcinoma | Female | <65 | I/II | Unknown | Unknown | SD | |
| CCDC8 | SNV | Missense_Mutation | rs764873641 | c.112N>T | p.Arg38Trp | p.R38W | Q9H0W5 | protein_coding | deleterious_low_confidence(0) | benign(0.095) | TCGA-C5-A1ML-01 | Cervix | cervical & endocervical cancer | Female | <65 | I/II | Unknown | Unknown | PD |
| CCDC8 | SNV | Missense_Mutation | c.583N>T | p.Arg195Trp | p.R195W | Q9H0W5 | protein_coding | deleterious_low_confidence(0) | probably_damaging(0.995) | TCGA-EK-A2PM-01 | Cervix | cervical & endocervical cancer | Female | >=65 | I/II | Unknown | Unknown | SD | |
| CCDC8 | SNV | Missense_Mutation | c.290N>G | p.Tyr97Cys | p.Y97C | Q9H0W5 | protein_coding | deleterious_low_confidence(0) | probably_damaging(0.973) | TCGA-A6-2686-01 | Colorectum | colon adenocarcinoma | Female | >=65 | I/II | Unknown | Unknown | SD | |
| CCDC8 | SNV | Missense_Mutation | rs754734333 | c.1373N>T | p.Ala458Val | p.A458V | Q9H0W5 | protein_coding | tolerated_low_confidence(0.06) | benign(0.007) | TCGA-A6-6781-01 | Colorectum | colon adenocarcinoma | Male | <65 | III/IV | Chemotherapy | oxaliplatin | SD |
| CCDC8 | SNV | Missense_Mutation | c.292N>A | p.Asp98Asn | p.D98N | Q9H0W5 | protein_coding | deleterious_low_confidence(0) | probably_damaging(0.997) | TCGA-AA-3510-01 | Colorectum | colon adenocarcinoma | Male | >=65 | I/II | Unknown | Unknown | SD | |
| CCDC8 | SNV | Missense_Mutation | c.960N>T | p.Arg320Ser | p.R320S | Q9H0W5 | protein_coding | deleterious_low_confidence(0.01) | benign(0.33) | TCGA-AA-3815-01 | Colorectum | colon adenocarcinoma | Female | >=65 | I/II | Unknown | Unknown | SD | |
| CCDC8 | SNV | Missense_Mutation | c.1577N>C | p.Arg526Thr | p.R526T | Q9H0W5 | protein_coding | deleterious_low_confidence(0) | possibly_damaging(0.719) | TCGA-AA-3819-01 | Colorectum | colon adenocarcinoma | Female | <65 | I/II | Unknown | Unknown | SD |
| Page: 1 2 3 4 5 6 7 |
Top |
Related drugs of malignant transformation related genes |
| Identification of chemicals and drugs interact with genes involved in malignant transfromation |
| (DGIdb 4.0) |
| Entrez ID | Symbol | Category | Interaction Types | Drug Claim Name | Drug Name | PMIDs |
| Page: 1 |

Copyright 2023-Present -The University of Texas Health Science Center at Houston |