
|
|||||
|
 | |
| |
| |
| |
| |
| |
|
Gene: ARHGAP4 |
Gene summary for ARHGAP4 |
| Gene information | Species | Human | Gene symbol | ARHGAP4 | Gene ID | 393 |
| Gene name | Rho GTPase activating protein 4 | |
| Gene Alias | C1 | |
| Cytomap | Xq28 | |
| Gene Type | protein-coding | GO ID | GO:0000902 | UniProtAcc | P98171 |
Top |
Malignant transformation analysis |
| Identification of the aberrant gene expression in precancerous and cancerous lesions by comparing the gene expression of stem-like cells in diseased tissues with normal stem cells |
| Entrez ID | Symbol | Replicates | Species | Organ | Tissue | Adj P-value | Log2FC | Malignancy |
| 393 | ARHGAP4 | HTA11_1938_2000001011 | Human | Colorectum | AD | 2.97e-12 | 4.57e-01 | -0.0811 |
| 393 | ARHGAP4 | HTA11_78_2000001011 | Human | Colorectum | AD | 2.40e-04 | 2.30e-01 | -0.1088 |
| 393 | ARHGAP4 | HTA11_83_2000001011 | Human | Colorectum | SER | 9.94e-10 | 4.44e-01 | -0.1526 |
| 393 | ARHGAP4 | HTA11_866_2000001011 | Human | Colorectum | AD | 2.61e-03 | 2.30e-01 | -0.1001 |
| 393 | ARHGAP4 | HTA11_1391_2000001011 | Human | Colorectum | AD | 7.63e-14 | 5.26e-01 | -0.059 |
| 393 | ARHGAP4 | HTA11_8622_2000001021 | Human | Colorectum | SER | 1.31e-05 | 3.88e-01 | 0.0528 |
| 393 | ARHGAP4 | HTA11_10711_2000001011 | Human | Colorectum | AD | 1.54e-05 | 2.96e-01 | 0.0338 |
| 393 | ARHGAP4 | HTA11_7696_3000711011 | Human | Colorectum | AD | 1.37e-25 | 5.93e-01 | 0.0674 |
| 393 | ARHGAP4 | HTA11_6818_2000001021 | Human | Colorectum | AD | 2.12e-10 | 4.67e-01 | 0.0588 |
| 393 | ARHGAP4 | HTA11_99999970781_79442 | Human | Colorectum | MSS | 9.27e-07 | 3.02e-01 | 0.294 |
| 393 | ARHGAP4 | HTA11_99999971662_82457 | Human | Colorectum | MSS | 2.50e-10 | 3.75e-01 | 0.3859 |
| 393 | ARHGAP4 | HCC1_Meng | Human | Liver | HCC | 4.84e-15 | 6.46e-02 | 0.0246 |
| 393 | ARHGAP4 | HCC2 | Human | Liver | HCC | 2.51e-10 | 2.37e+00 | 0.5341 |
| 393 | ARHGAP4 | HCC5 | Human | Liver | HCC | 4.17e-02 | 3.62e-01 | 0.4932 |
| 393 | ARHGAP4 | S014 | Human | Liver | HCC | 2.80e-18 | 5.28e-01 | 0.2254 |
| 393 | ARHGAP4 | S015 | Human | Liver | HCC | 6.27e-14 | 4.91e-01 | 0.2375 |
| 393 | ARHGAP4 | S016 | Human | Liver | HCC | 5.36e-25 | 5.66e-01 | 0.2243 |
| 393 | ARHGAP4 | S027 | Human | Liver | HCC | 3.49e-23 | 1.48e+00 | 0.2446 |
| 393 | ARHGAP4 | S028 | Human | Liver | HCC | 1.68e-44 | 1.39e+00 | 0.2503 |
| 393 | ARHGAP4 | S029 | Human | Liver | HCC | 4.94e-38 | 1.32e+00 | 0.2581 |
| Page: 1 2 |
| Tissue | Expression Dynamics | Abbreviation |
| Colorectum (GSE201348) |  | FAP: Familial adenomatous polyposis |
| CRC: Colorectal cancer | ||
| Colorectum (HTA11) |  | AD: Adenomas |
| SER: Sessile serrated lesions | ||
| MSI-H: Microsatellite-high colorectal cancer | ||
| MSS: Microsatellite stable colorectal cancer | ||
| Liver | 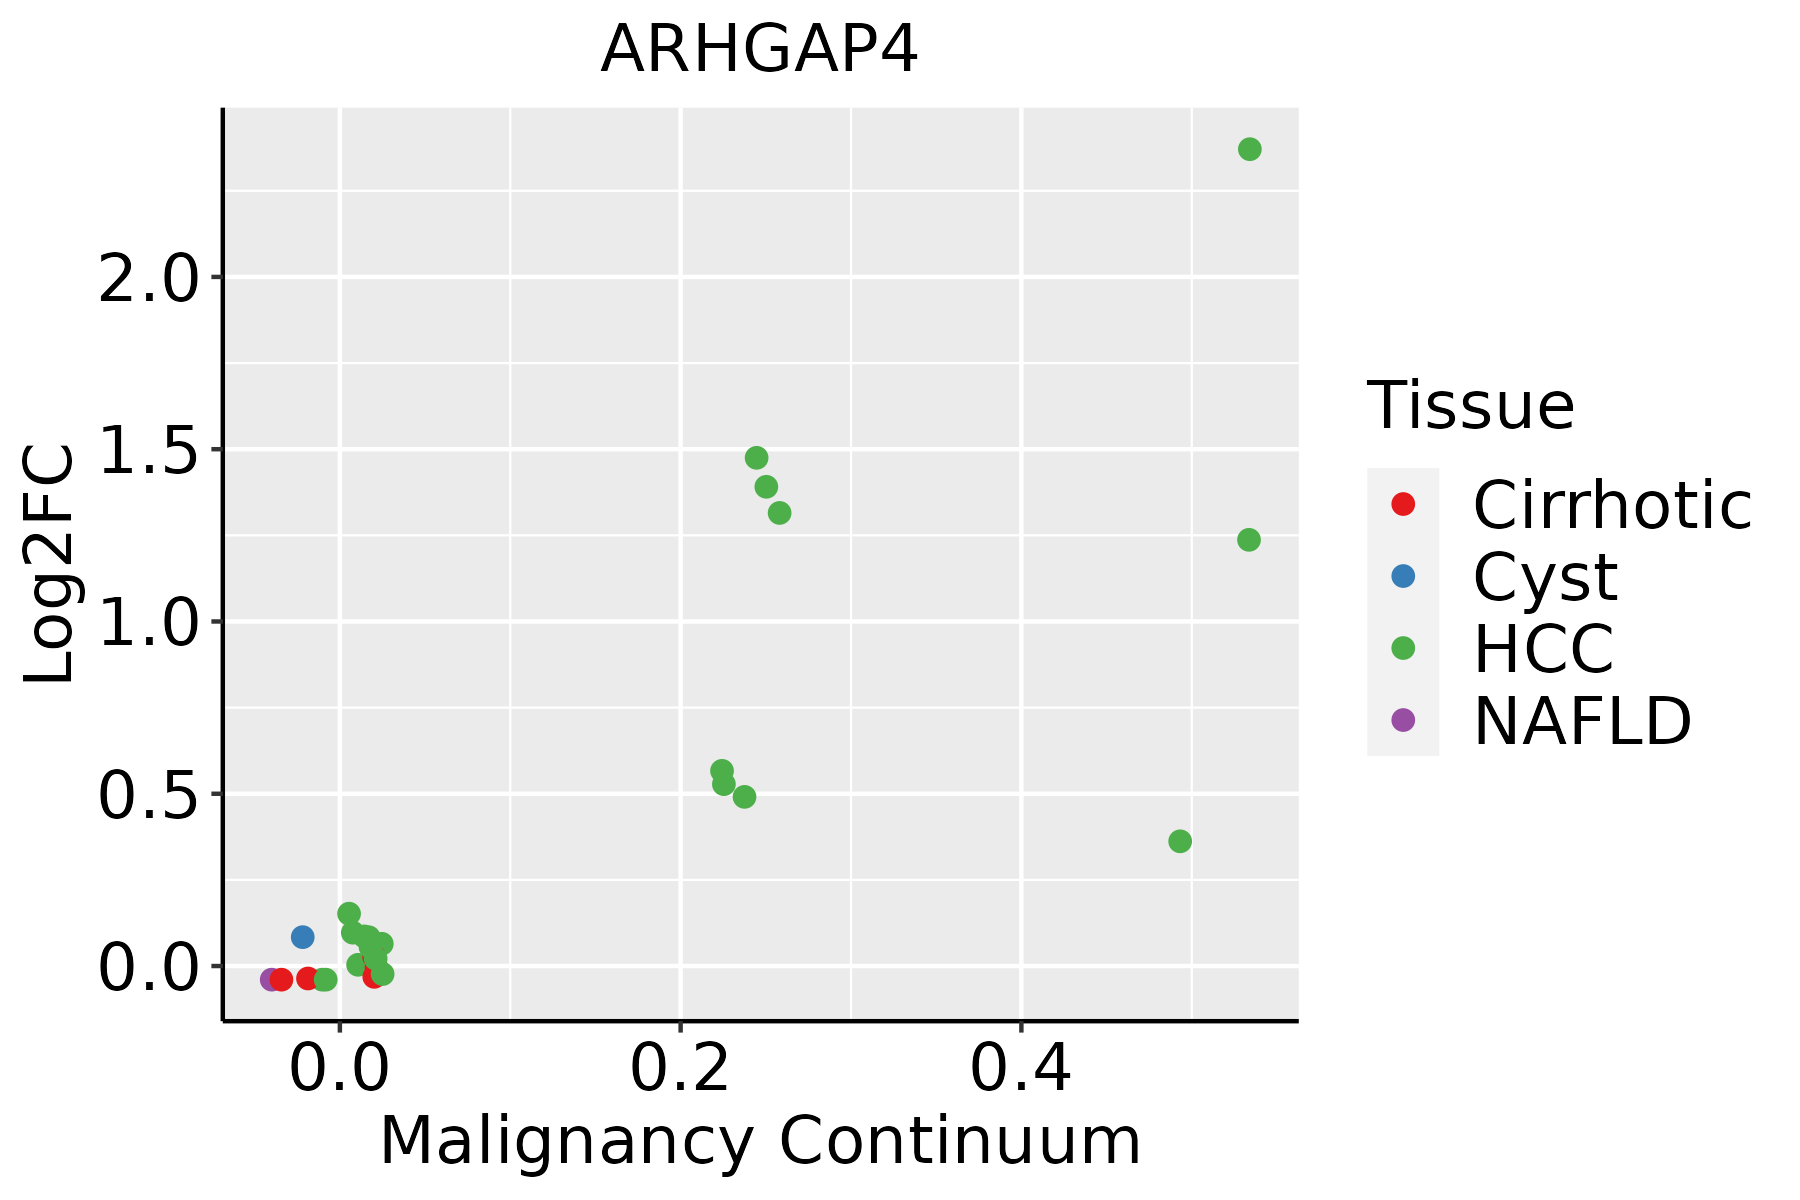 | HCC: Hepatocellular carcinoma |
| NAFLD: Non-alcoholic fatty liver disease | ||
| Oral Cavity | 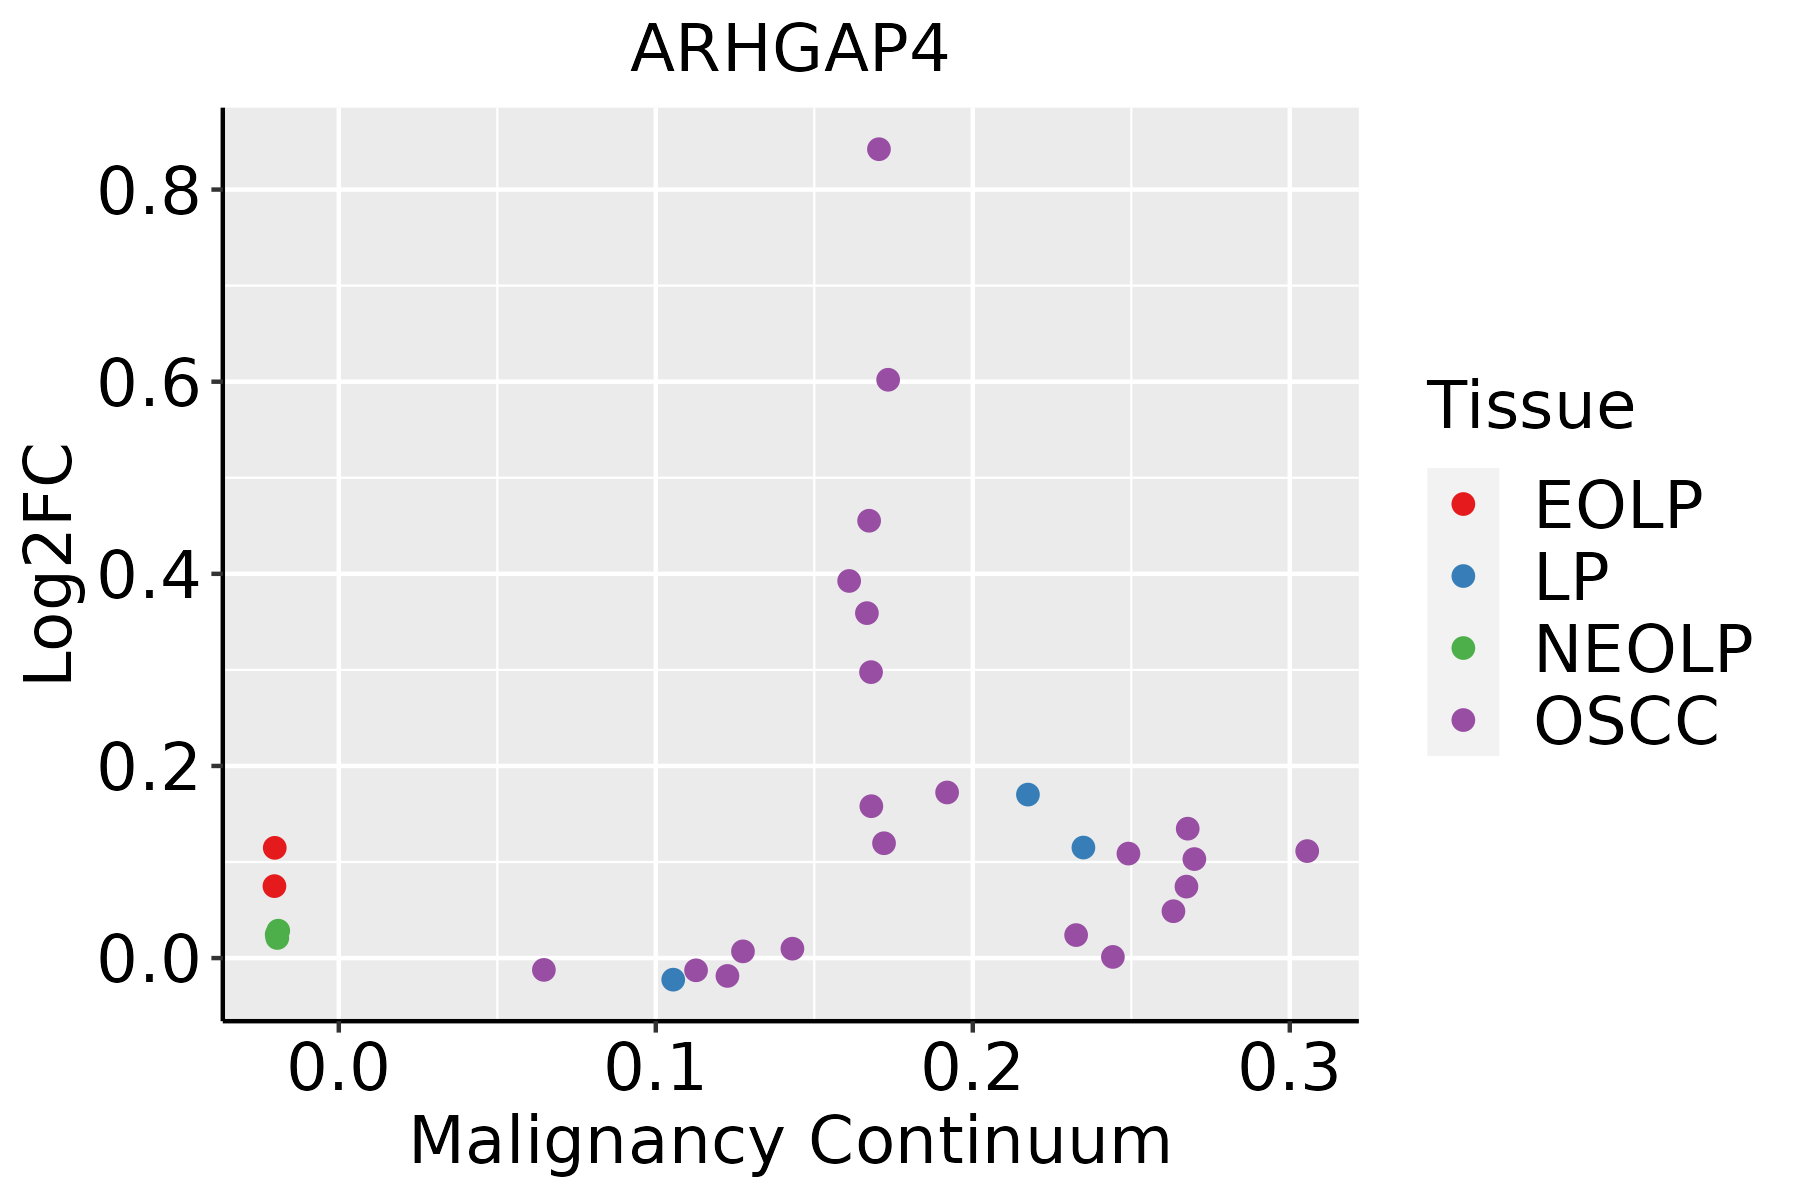 | EOLP: Erosive Oral lichen planus |
| LP: leukoplakia | ||
| NEOLP: Non-erosive oral lichen planus | ||
| OSCC: Oral squamous cell carcinoma |
| ∗log2FC in expression of this searched gene in stem-like cells from each diseased tissue sample relative to stem-like cells in normal samples in each tissue plotted against the malignancy continuum. Samples are colored based on if they are from different disease stage. |
Top |
Malignant transformation related pathway analysis |
| Find out the enriched GO biological processes and KEGG pathways involved in transition from healthy to precancer to cancer |
| Tissue | Disease Stage | Enriched GO biological Processes |
| Colorectum | AD |  |
| Colorectum | SER |  |
| Colorectum | MSS |  |
| Colorectum | MSI-H |  |
| Colorectum | FAP |  |
| ∗Top 15 enriched GO BP terms are showed in the bar plot of each disease state in each tissue. Each row represents a significant GO biological process which is colored according to the -log10(p.adjust). |
| Page: 1 2 3 4 5 6 7 8 9 |
| GO ID | Tissue | Disease Stage | Description | Gene Ratio | Bg Ratio | pvalue | p.adjust | Count |
| GO:006056011 | Liver | HCC | developmental growth involved in morphogenesis | 124/7958 | 234/18723 | 7.37e-04 | 4.47e-03 | 124 |
| GO:000726621 | Liver | HCC | Rho protein signal transduction | 76/7958 | 137/18723 | 1.46e-03 | 7.75e-03 | 76 |
| GO:001097511 | Liver | HCC | regulation of neuron projection development | 220/7958 | 445/18723 | 1.68e-03 | 8.78e-03 | 220 |
| GO:00459263 | Liver | HCC | negative regulation of growth | 129/7958 | 249/18723 | 1.81e-03 | 9.37e-03 | 129 |
| GO:004867511 | Liver | HCC | axon extension | 67/7958 | 120/18723 | 2.17e-03 | 1.09e-02 | 67 |
| GO:199013811 | Liver | HCC | neuron projection extension | 92/7958 | 172/18723 | 2.31e-03 | 1.14e-02 | 92 |
| GO:004657811 | Liver | HCC | regulation of Ras protein signal transduction | 100/7958 | 189/18723 | 2.42e-03 | 1.18e-02 | 100 |
| GO:004858811 | Liver | HCC | developmental cell growth | 121/7958 | 234/18723 | 2.68e-03 | 1.28e-02 | 121 |
| GO:0010762 | Liver | HCC | regulation of fibroblast migration | 24/7958 | 36/18723 | 2.95e-03 | 1.38e-02 | 24 |
| GO:00507674 | Liver | HCC | regulation of neurogenesis | 181/7958 | 364/18723 | 3.00e-03 | 1.40e-02 | 181 |
| GO:00350242 | Liver | HCC | negative regulation of Rho protein signal transduction | 16/7958 | 22/18723 | 4.03e-03 | 1.76e-02 | 16 |
| GO:00083614 | Liver | HCC | regulation of cell size | 95/7958 | 181/18723 | 4.15e-03 | 1.81e-02 | 95 |
| GO:0030308 | Liver | HCC | negative regulation of cell growth | 98/7958 | 188/18723 | 4.74e-03 | 2.02e-02 | 98 |
| GO:00305164 | Liver | HCC | regulation of axon extension | 52/7958 | 95/18723 | 1.07e-02 | 3.97e-02 | 52 |
| GO:000166721 | Liver | HCC | ameboidal-type cell migration | 226/7958 | 475/18723 | 1.35e-02 | 4.81e-02 | 226 |
| GO:00510565 | Lung | IAC | regulation of small GTPase mediated signal transduction | 70/2061 | 302/18723 | 9.44e-10 | 1.87e-07 | 70 |
| GO:00163586 | Lung | IAC | dendrite development | 55/2061 | 243/18723 | 1.35e-07 | 1.18e-05 | 55 |
| GO:00726598 | Lung | IAC | protein localization to plasma membrane | 60/2061 | 284/18723 | 4.74e-07 | 3.10e-05 | 60 |
| GO:00329708 | Lung | IAC | regulation of actin filament-based process | 77/2061 | 397/18723 | 4.85e-07 | 3.10e-05 | 77 |
| GO:00329568 | Lung | IAC | regulation of actin cytoskeleton organization | 70/2061 | 358/18723 | 1.17e-06 | 6.20e-05 | 70 |
| Page: 1 2 3 4 5 6 7 8 9 10 11 12 13 14 15 16 17 18 19 20 21 22 |
| Pathway ID | Tissue | Disease Stage | Description | Gene Ratio | Bg Ratio | pvalue | p.adjust | qvalue | Count |
| Page: 1 |
Top |
Cell-cell communication analysis |
| Identification of potential cell-cell interactions between two cell types and their ligand-receptor pairs for different disease states |
| Ligand | Receptor | LRpair | Pathway | Tissue | Disease Stage |
| Page: 1 |
Top |
Single-cell gene regulatory network inference analysis |
| Find out the significant the regulons (TFs) and the target genes of each regulon across cell types for different disease states |
| TF | Cell Type | Tissue | Disease Stage | Target Gene | RSS | Regulon Activity |
| ∗The dot plots of a searched regulon are shown for all cell subpopulations in each disease state of each tissue based on the regulon specific score inferred using pySCENIC and by calculating the average expression. |
| Page: 1 |
Top |
Somatic mutation of malignant transformation related genes |
| Annotation of somatic variants for genes involved in malignant transformation |
| Hugo Symbol | Variant Class | Variant Classification | dbSNP RS | HGVSc | HGVSp | HGVSp Short | SWISSPROT | BIOTYPE | SIFT | PolyPhen | Tumor Sample Barcode | Tissue | Histology | Sex | Age | Stage | Therapy Types | Drugs | Outcome |
| ARHGAP4 | SNV | Missense_Mutation | novel | c.2188C>A | p.Gln730Lys | p.Q730K | P98171 | protein_coding | deleterious(0.03) | benign(0.069) | TCGA-AC-A2FM-01 | Breast | breast invasive carcinoma | Female | >=65 | I/II | Unknown | Unknown | PD |
| ARHGAP4 | SNV | Missense_Mutation | c.884N>T | p.Ala295Val | p.A295V | P98171 | protein_coding | deleterious(0) | possibly_damaging(0.632) | TCGA-BH-A18G-01 | Breast | breast invasive carcinoma | Female | >=65 | I/II | Unknown | Unknown | SD | |
| ARHGAP4 | SNV | Missense_Mutation | novel | c.2551N>T | p.Val851Leu | p.V851L | P98171 | protein_coding | tolerated(0.43) | benign(0.039) | TCGA-E9-A1RC-01 | Breast | breast invasive carcinoma | Female | <65 | III/IV | Hormone Therapy | tamoxiphen | SD |
| ARHGAP4 | insertion | In_Frame_Ins | novel | c.820_821insTAC | p.Glu274delinsValGln | p.E274delinsVQ | P98171 | protein_coding | TCGA-AO-A0J5-01 | Breast | breast invasive carcinoma | Female | <65 | III/IV | Other, specify in notesBisphosphonate | zoledronic | PD | ||
| ARHGAP4 | insertion | Nonsense_Mutation | novel | c.819_820insCGTGGCTAAGATTT | p.Glu274ArgfsTer3 | p.E274Rfs*3 | P98171 | protein_coding | TCGA-AO-A0J5-01 | Breast | breast invasive carcinoma | Female | <65 | III/IV | Other, specify in notesBisphosphonate | zoledronic | PD | ||
| ARHGAP4 | SNV | Missense_Mutation | c.1121N>A | p.Arg374His | p.R374H | P98171 | protein_coding | deleterious(0) | probably_damaging(0.98) | TCGA-2W-A8YY-01 | Cervix | cervical & endocervical cancer | Female | <65 | I/II | Chemotherapy | cisplatin | CR | |
| ARHGAP4 | SNV | Missense_Mutation | novel | c.567N>T | p.Glu189Asp | p.E189D | P98171 | protein_coding | deleterious(0) | benign(0.345) | TCGA-2W-A8YY-01 | Cervix | cervical & endocervical cancer | Female | <65 | I/II | Chemotherapy | cisplatin | CR |
| ARHGAP4 | SNV | Missense_Mutation | novel | c.1145N>A | p.Gly382Glu | p.G382E | P98171 | protein_coding | deleterious(0.01) | probably_damaging(0.961) | TCGA-C5-A1M5-01 | Cervix | cervical & endocervical cancer | Female | <65 | I/II | Unknown | Unknown | PD |
| ARHGAP4 | SNV | Missense_Mutation | novel | c.1091N>C | p.Val364Ala | p.V364A | P98171 | protein_coding | tolerated(0.37) | benign(0.003) | TCGA-C5-A1ME-01 | Cervix | cervical & endocervical cancer | Female | <65 | I/II | Unknown | Unknown | SD |
| ARHGAP4 | SNV | Missense_Mutation | novel | c.787N>T | p.Pro263Ser | p.P263S | P98171 | protein_coding | tolerated_low_confidence(0.79) | benign(0.025) | TCGA-EA-A3HS-01 | Cervix | cervical & endocervical cancer | Female | <65 | I/II | Unknown | Unknown | SD |
| Page: 1 2 3 4 5 6 7 8 9 10 11 |
Top |
Related drugs of malignant transformation related genes |
| Identification of chemicals and drugs interact with genes involved in malignant transfromation |
| (DGIdb 4.0) |
| Entrez ID | Symbol | Category | Interaction Types | Drug Claim Name | Drug Name | PMIDs |
| Page: 1 |

Copyright 2023-Present -The University of Texas Health Science Center at Houston |