Schematic overview of the cellular and molecular mechanisms involved in the cancer progression, including the proposed cellular and molecular mechanisms in cancer cells trajectory. AT1: alveolar type 1 cells; AT2: alveolar type 2 cells; AAH: atypical adenomatous hyperplasia; AIS: adenocarcinoma in situ; MIA: minimally invasive adenocarcinoma; IA: invasive adenocarcinoma; EMT: epithelial-mesenchymal transition

Home

Download

Statistics

Help

Contact

Center for Computational Systems Medicine
leaf

Gene summary

leaf

Malignant transformation analysis

leaf

Malignant transformation related pathway analysis

leaf

Cell-cell communication analysis

leaf

Single-cell gene regulatory network inference analysis

leaf

Somatic mutation of malignant transformation related genes

leaf

Related drugs of malignant transformation related genes

Gene: ANP32B

Gene summary for ANP32B

check button Gene summary.

Gene informationSpeciesHuman
Gene symbol

ANP32B

Gene ID

10541

Gene nameacidic nuclear phosphoprotein 32 family member B
Gene AliasAPRIL
Cytomap9q22.33
Gene Typeprotein-coding
GO ID

GO:0001944

UniProtAcc

Q92688


Top

Malignant transformation analysis

check button Identification of the aberrant gene expression in precancerous and cancerous lesions by comparing the gene expression of stem-like cells in diseased tissues with normal stem cells
check button Malignant transformation involving gene list.
Entrez IDSymbolReplicatesSpeciesOrganTissueAdj P-valueLog2FCMalignancy
10541ANP32BGSM4909281HumanBreastIDC9.69e-286.26e-010.21
10541ANP32BGSM4909282HumanBreastIDC6.53e-195.03e-01-0.0288
10541ANP32BGSM4909285HumanBreastIDC3.38e-457.78e-010.21
10541ANP32BGSM4909286HumanBreastIDC1.80e-093.38e-010.1081
10541ANP32BGSM4909288HumanBreastIDC8.94e-092.96e-010.0988
10541ANP32BGSM4909294HumanBreastIDC4.28e-05-1.80e-010.2022
10541ANP32BGSM4909296HumanBreastIDC4.70e-11-9.31e-020.1524
10541ANP32BGSM4909297HumanBreastIDC1.36e-17-1.79e-010.1517
10541ANP32BGSM4909301HumanBreastIDC1.43e-02-1.43e-010.1577
10541ANP32BGSM4909311HumanBreastIDC2.04e-30-3.63e-010.1534
10541ANP32BGSM4909312HumanBreastIDC1.17e-11-6.52e-020.1552
10541ANP32BGSM4909319HumanBreastIDC1.54e-44-4.20e-010.1563
10541ANP32BGSM4909320HumanBreastIDC1.64e-05-4.35e-010.1575
10541ANP32BGSM4909321HumanBreastIDC2.72e-15-2.80e-010.1559
10541ANP32BM1HumanBreastIDC2.59e-033.39e-010.1577
10541ANP32BM2HumanBreastIDC1.67e-136.17e-010.21
10541ANP32BNCCBC14HumanBreastDCIS1.74e-101.38e-010.2021
10541ANP32BNCCBC2HumanBreastDCIS1.66e-04-1.73e-010.1554
10541ANP32BNCCBC3HumanBreastDCIS1.13e-092.44e-010.1198
10541ANP32BNCCBC5HumanBreastDCIS2.05e-181.20e-010.2046
Page: 1 2 3 4 5 6 7 8 9 10 11 12 13 

check button Transcriptomic changes along malignancy continuum.
TissueExpression DynamicsAbbreviation
BreastThe image shows the transcriptomic changes along malignancy continuum.log2FC in expression of this searched gene in stem-like cells from each diseased tissue sample relative to stem-like cells in normal samples in each tissue plotted against the malignancy continuum. Samples are colored based on if they are from different disease stage.
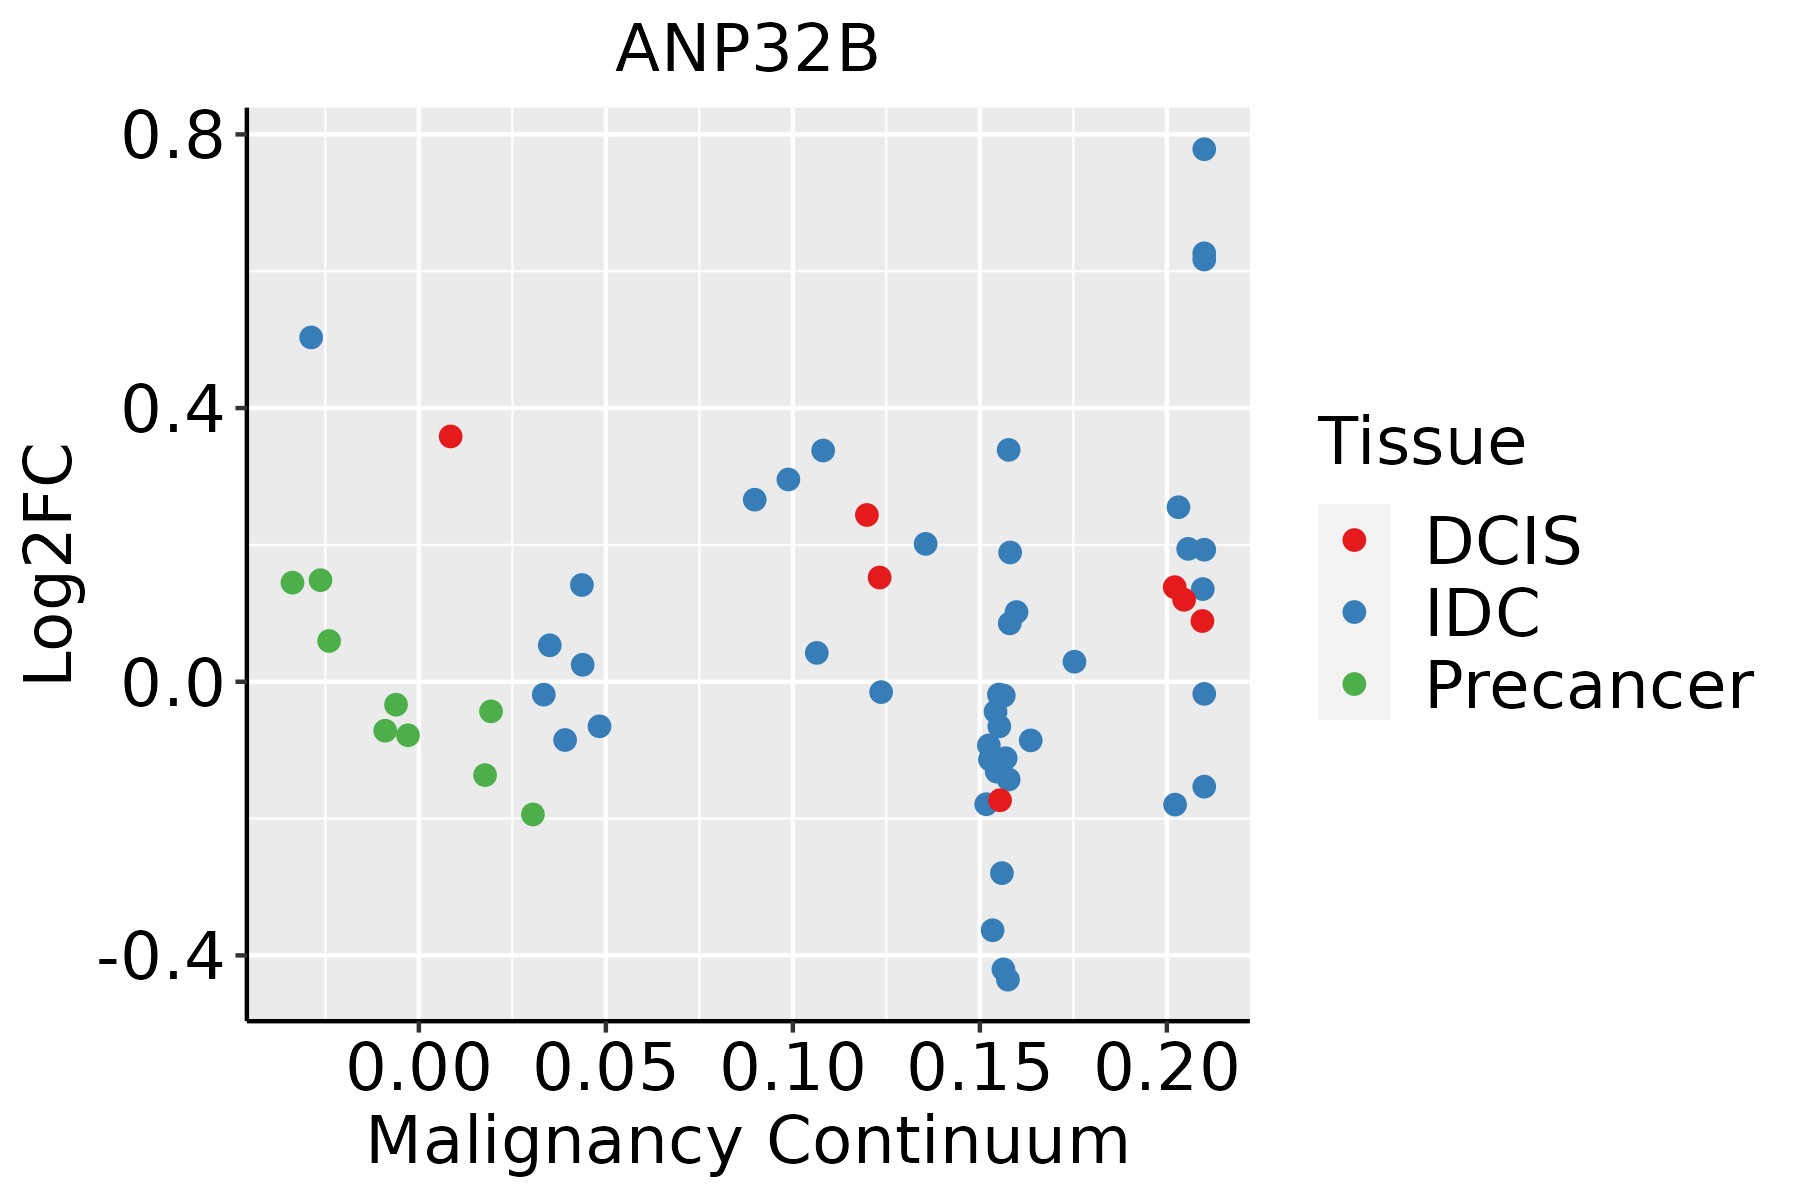
IDC: Invasive ductal carcinoma
DCIS: Ductal carcinoma in situ
Precancer(BRCA1-mut): Precancerous lesion from BRCA1 mutation carriers
Colorectum (GSE201348)The image shows the transcriptomic changes along malignancy continuum.log2FC in expression of this searched gene in stem-like cells from each diseased tissue sample relative to stem-like cells in normal samples in each tissue plotted against the malignancy continuum. Samples are colored based on if they are from different disease stage.
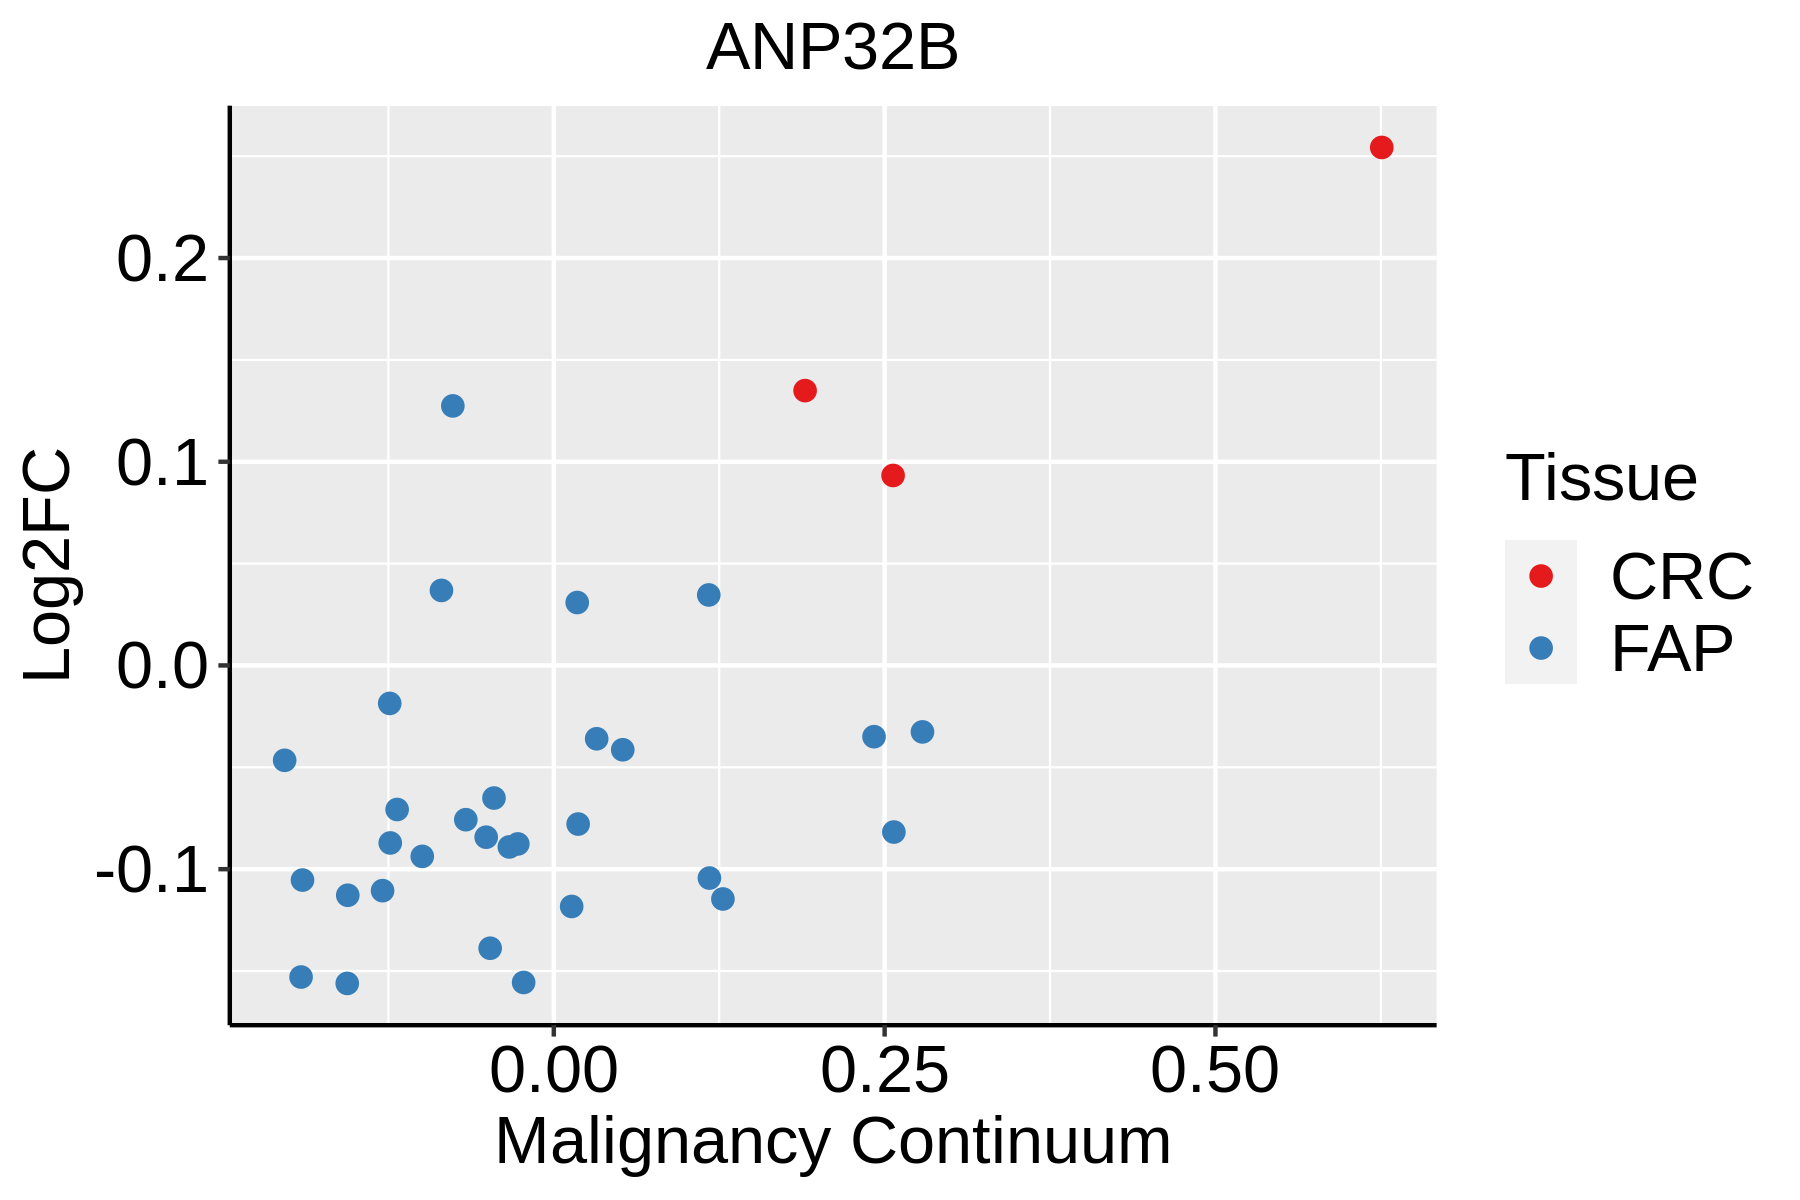
FAP: Familial adenomatous polyposis
CRC: Colorectal cancer
Colorectum (HTA11)The image shows the transcriptomic changes along malignancy continuum.log2FC in expression of this searched gene in stem-like cells from each diseased tissue sample relative to stem-like cells in normal samples in each tissue plotted against the malignancy continuum. Samples are colored based on if they are from different disease stage.AD: Adenomas
SER: Sessile serrated lesions
MSI-H: Microsatellite-high colorectal cancer
MSS: Microsatellite stable colorectal cancer
EndometriumThe image shows the transcriptomic changes along malignancy continuum.log2FC in expression of this searched gene in stem-like cells from each diseased tissue sample relative to stem-like cells in normal samples in each tissue plotted against the malignancy continuum. Samples are colored based on if they are from different disease stage.AEH: Atypical endometrial hyperplasia
EEC: Endometrioid Cancer
EsophagusThe image shows the transcriptomic changes along malignancy continuum.log2FC in expression of this searched gene in stem-like cells from each diseased tissue sample relative to stem-like cells in normal samples in each tissue plotted against the malignancy continuum. Samples are colored based on if they are from different disease stage.ESCC: Esophageal squamous cell carcinoma
HGIN: High-grade intraepithelial neoplasias
LGIN: Low-grade intraepithelial neoplasias
LiverThe image shows the transcriptomic changes along malignancy continuum.log2FC in expression of this searched gene in stem-like cells from each diseased tissue sample relative to stem-like cells in normal samples in each tissue plotted against the malignancy continuum. Samples are colored based on if they are from different disease stage.
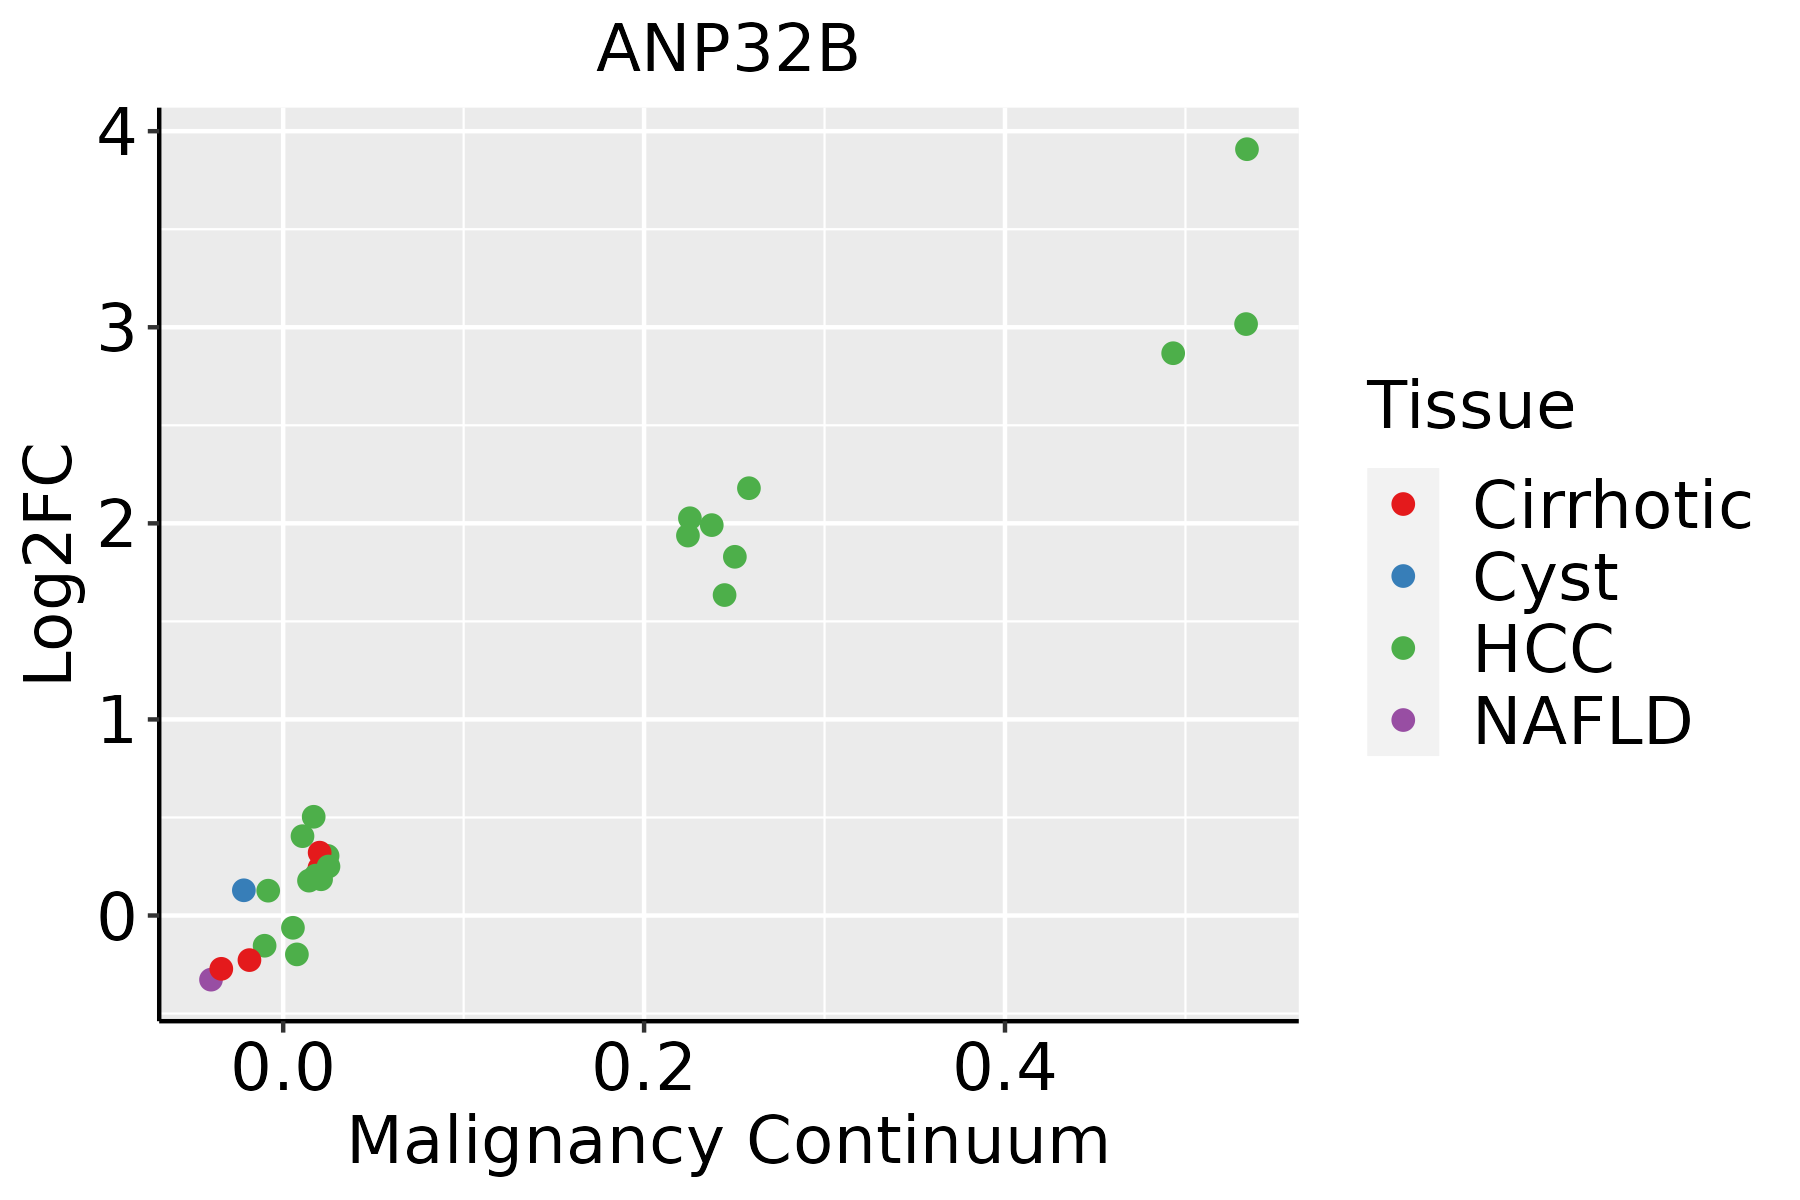
HCC: Hepatocellular carcinoma
NAFLD: Non-alcoholic fatty liver disease
Oral CavityThe image shows the transcriptomic changes along malignancy continuum.log2FC in expression of this searched gene in stem-like cells from each diseased tissue sample relative to stem-like cells in normal samples in each tissue plotted against the malignancy continuum. Samples are colored based on if they are from different disease stage.
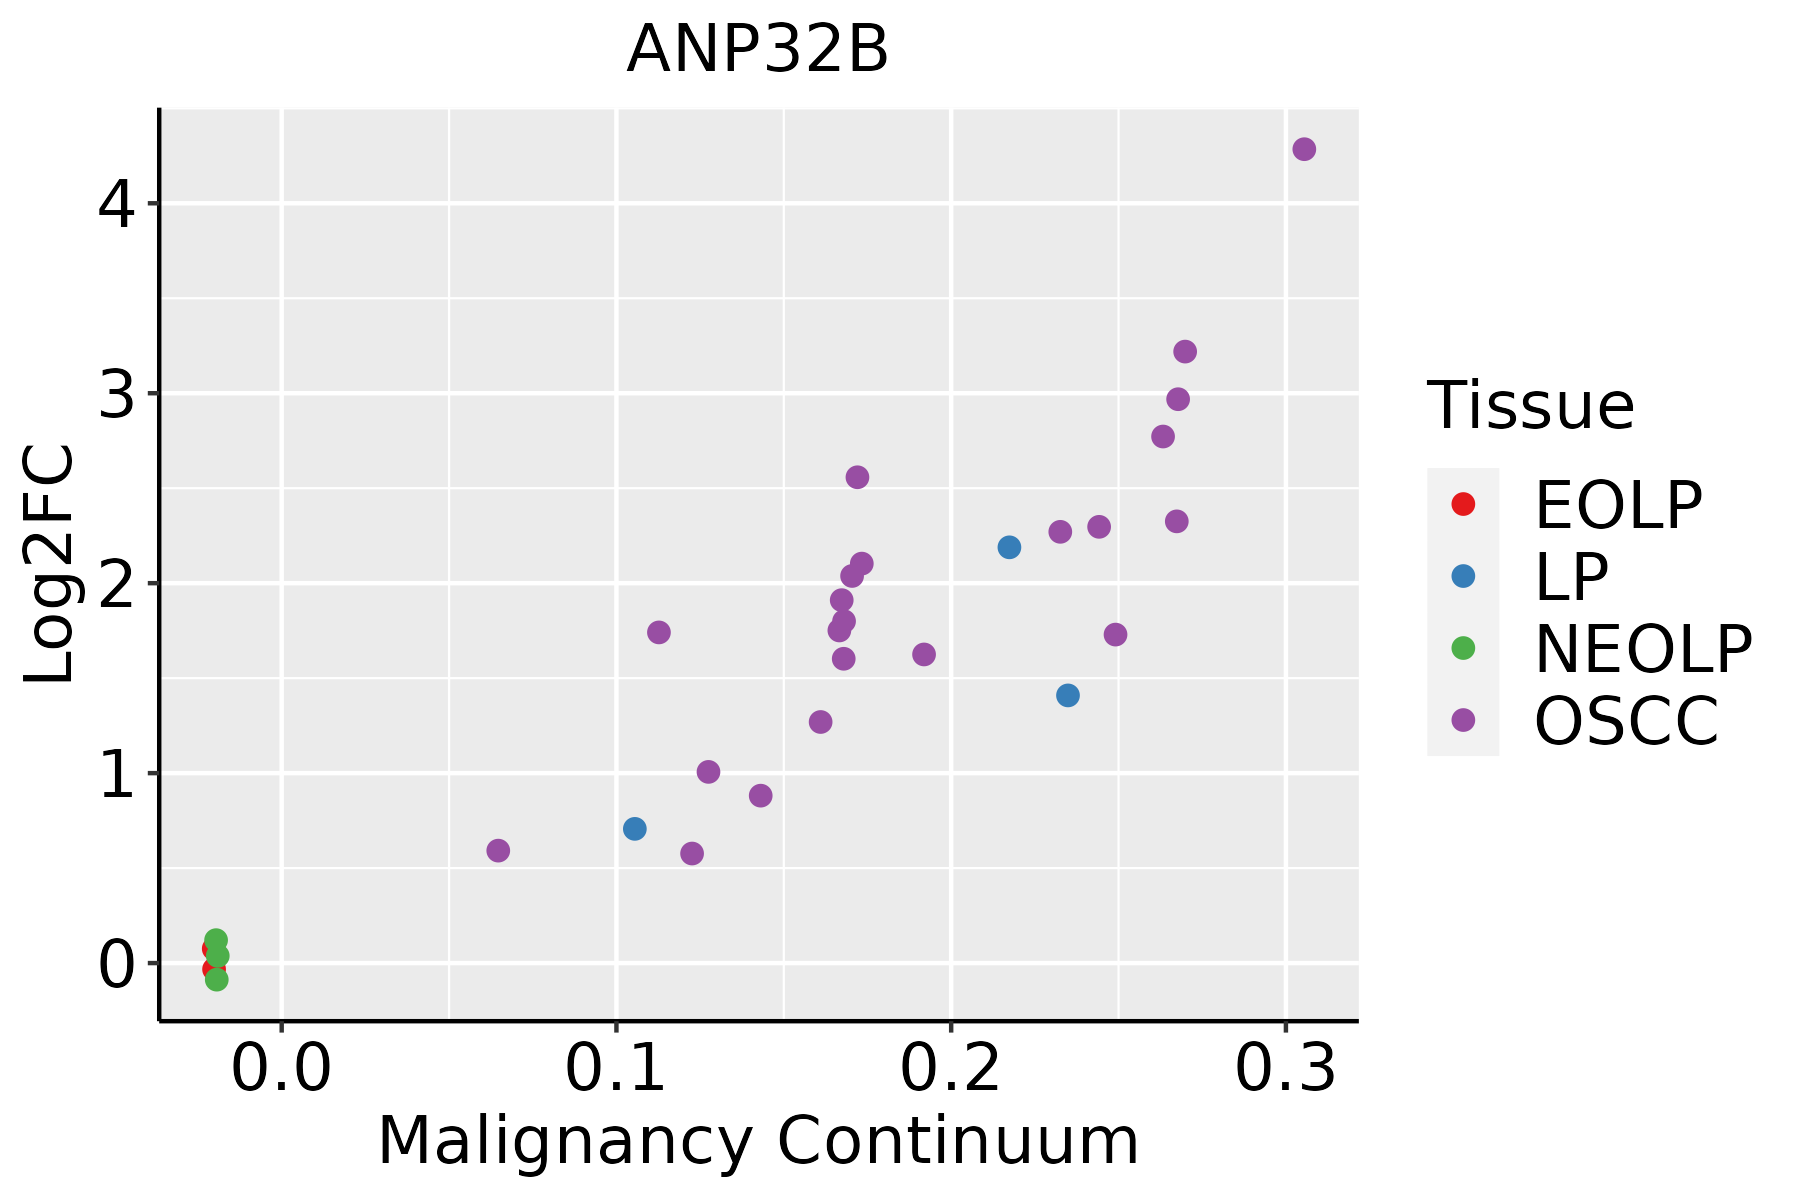
EOLP: Erosive Oral lichen planus
LP: leukoplakia
NEOLP: Non-erosive oral lichen planus
OSCC: Oral squamous cell carcinoma
ProstateThe image shows the transcriptomic changes along malignancy continuum.log2FC in expression of this searched gene in stem-like cells from each diseased tissue sample relative to stem-like cells in normal samples in each tissue plotted against the malignancy continuum. Samples are colored based on if they are from different disease stage.
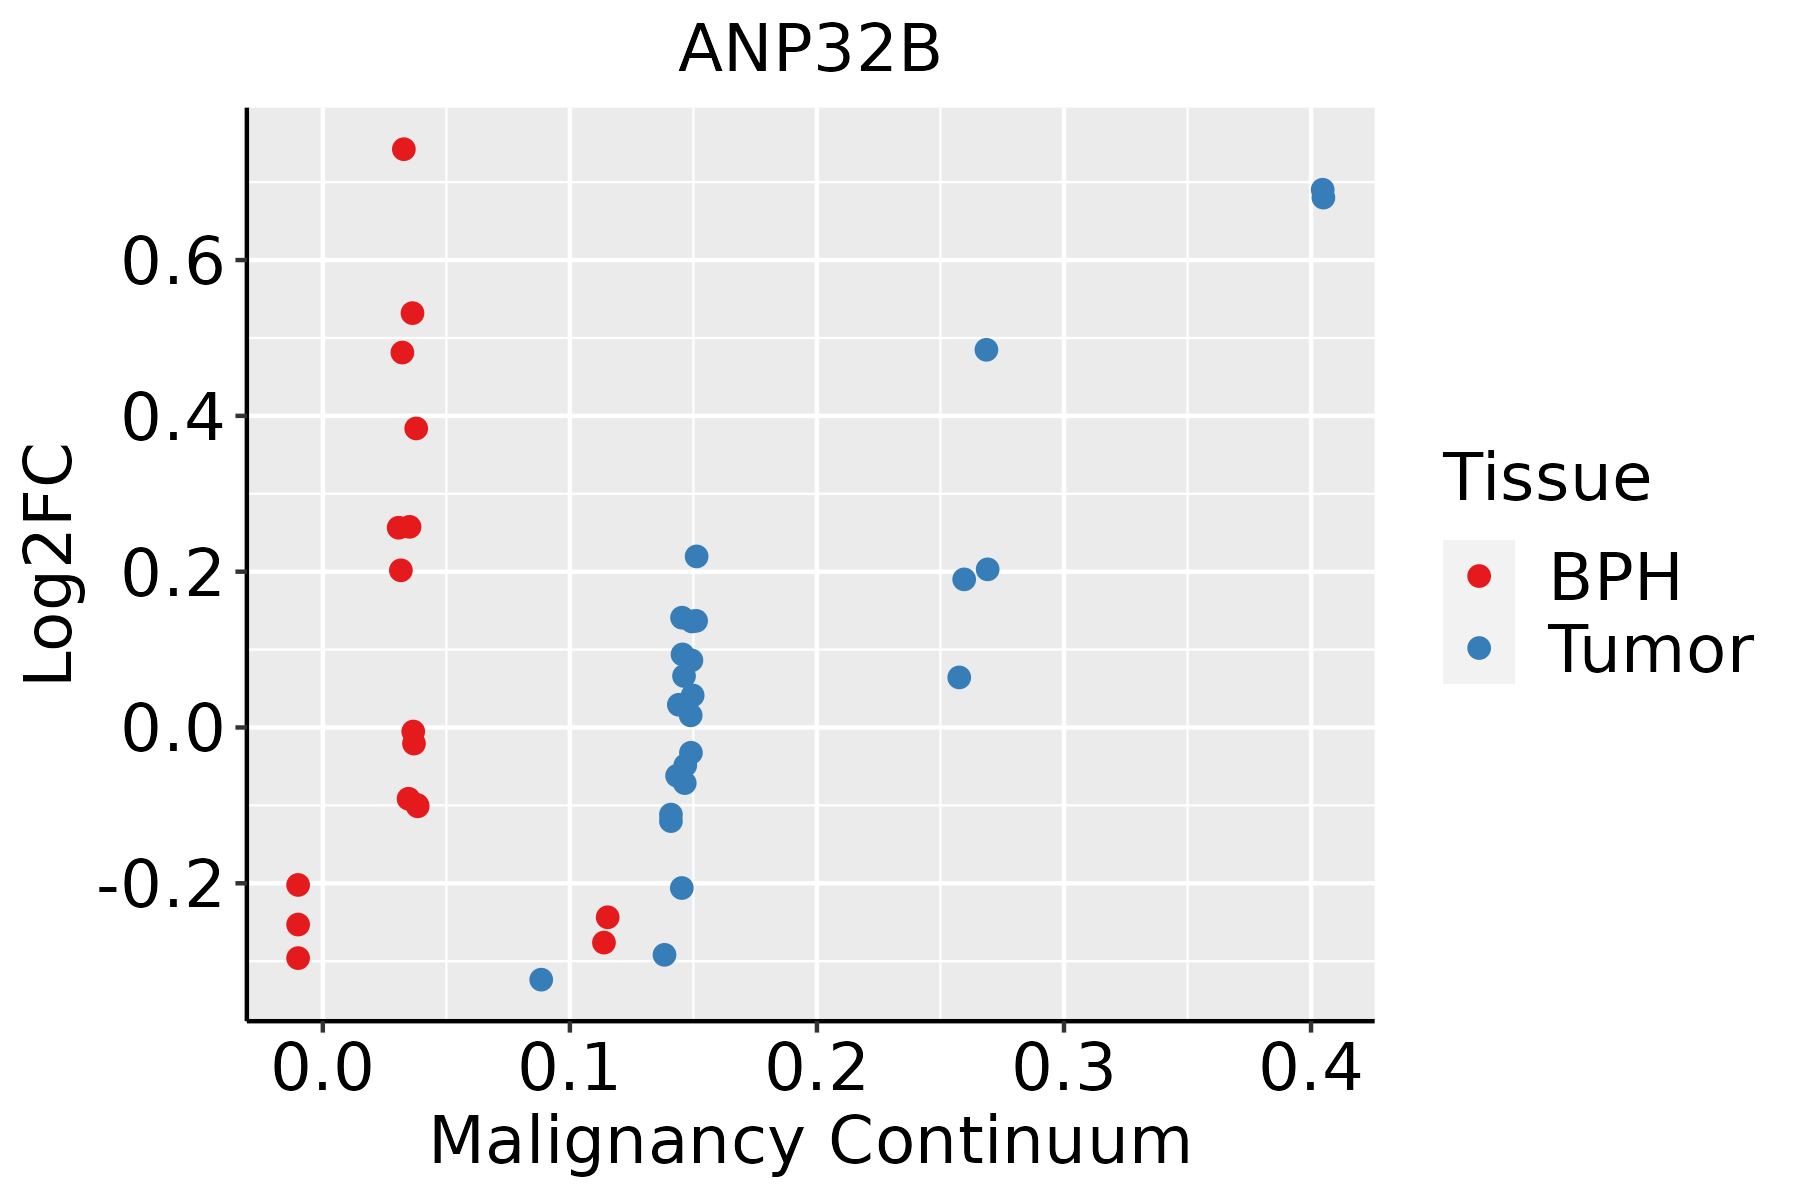
BPH: Benign Prostatic Hyperplasia
SkinThe image shows the transcriptomic changes along malignancy continuum.log2FC in expression of this searched gene in stem-like cells from each diseased tissue sample relative to stem-like cells in normal samples in each tissue plotted against the malignancy continuum. Samples are colored based on if they are from different disease stage.
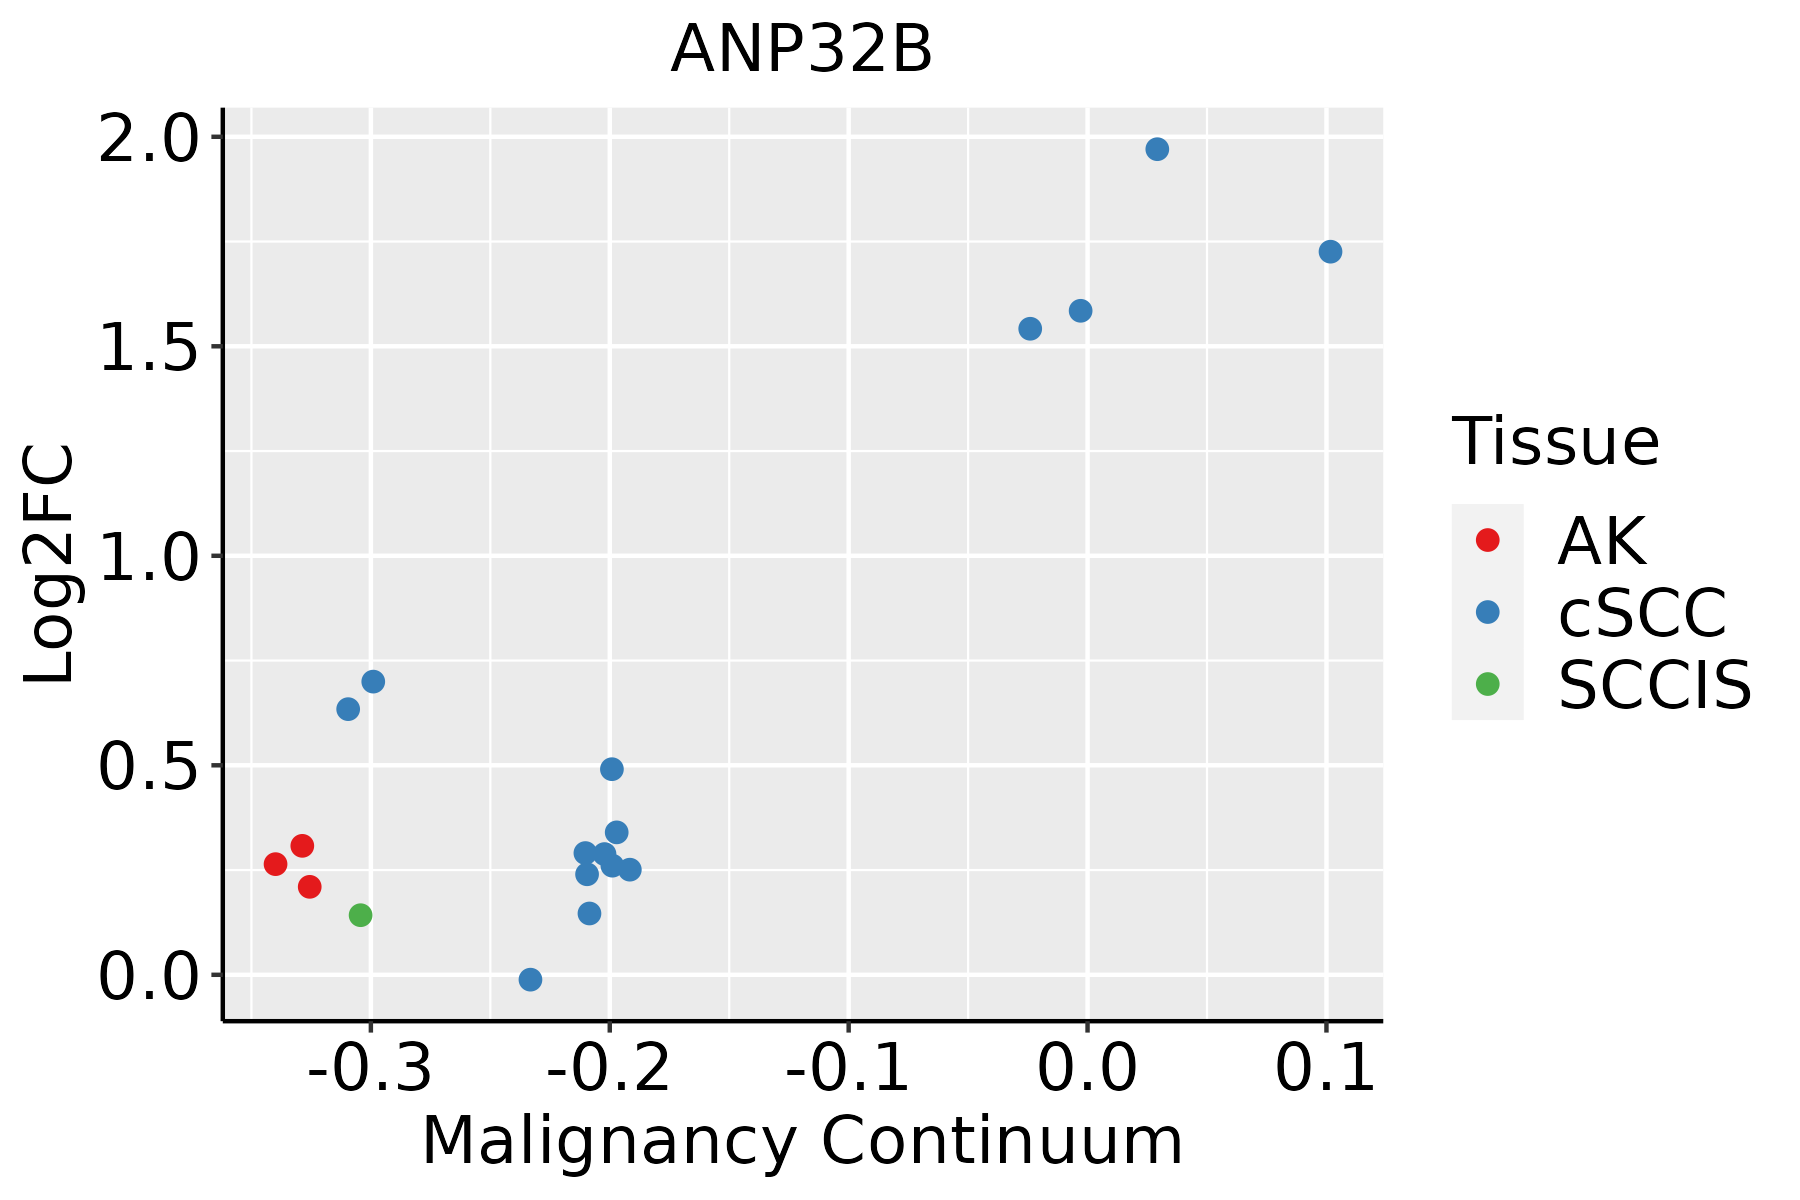
AK: Actinic keratosis
cSCC: Cutaneous squamous cell carcinoma
SCCIS:squamous cell carcinoma in situ
ThyroidThe image shows the transcriptomic changes along malignancy continuum.log2FC in expression of this searched gene in stem-like cells from each diseased tissue sample relative to stem-like cells in normal samples in each tissue plotted against the malignancy continuum. Samples are colored based on if they are from different disease stage.
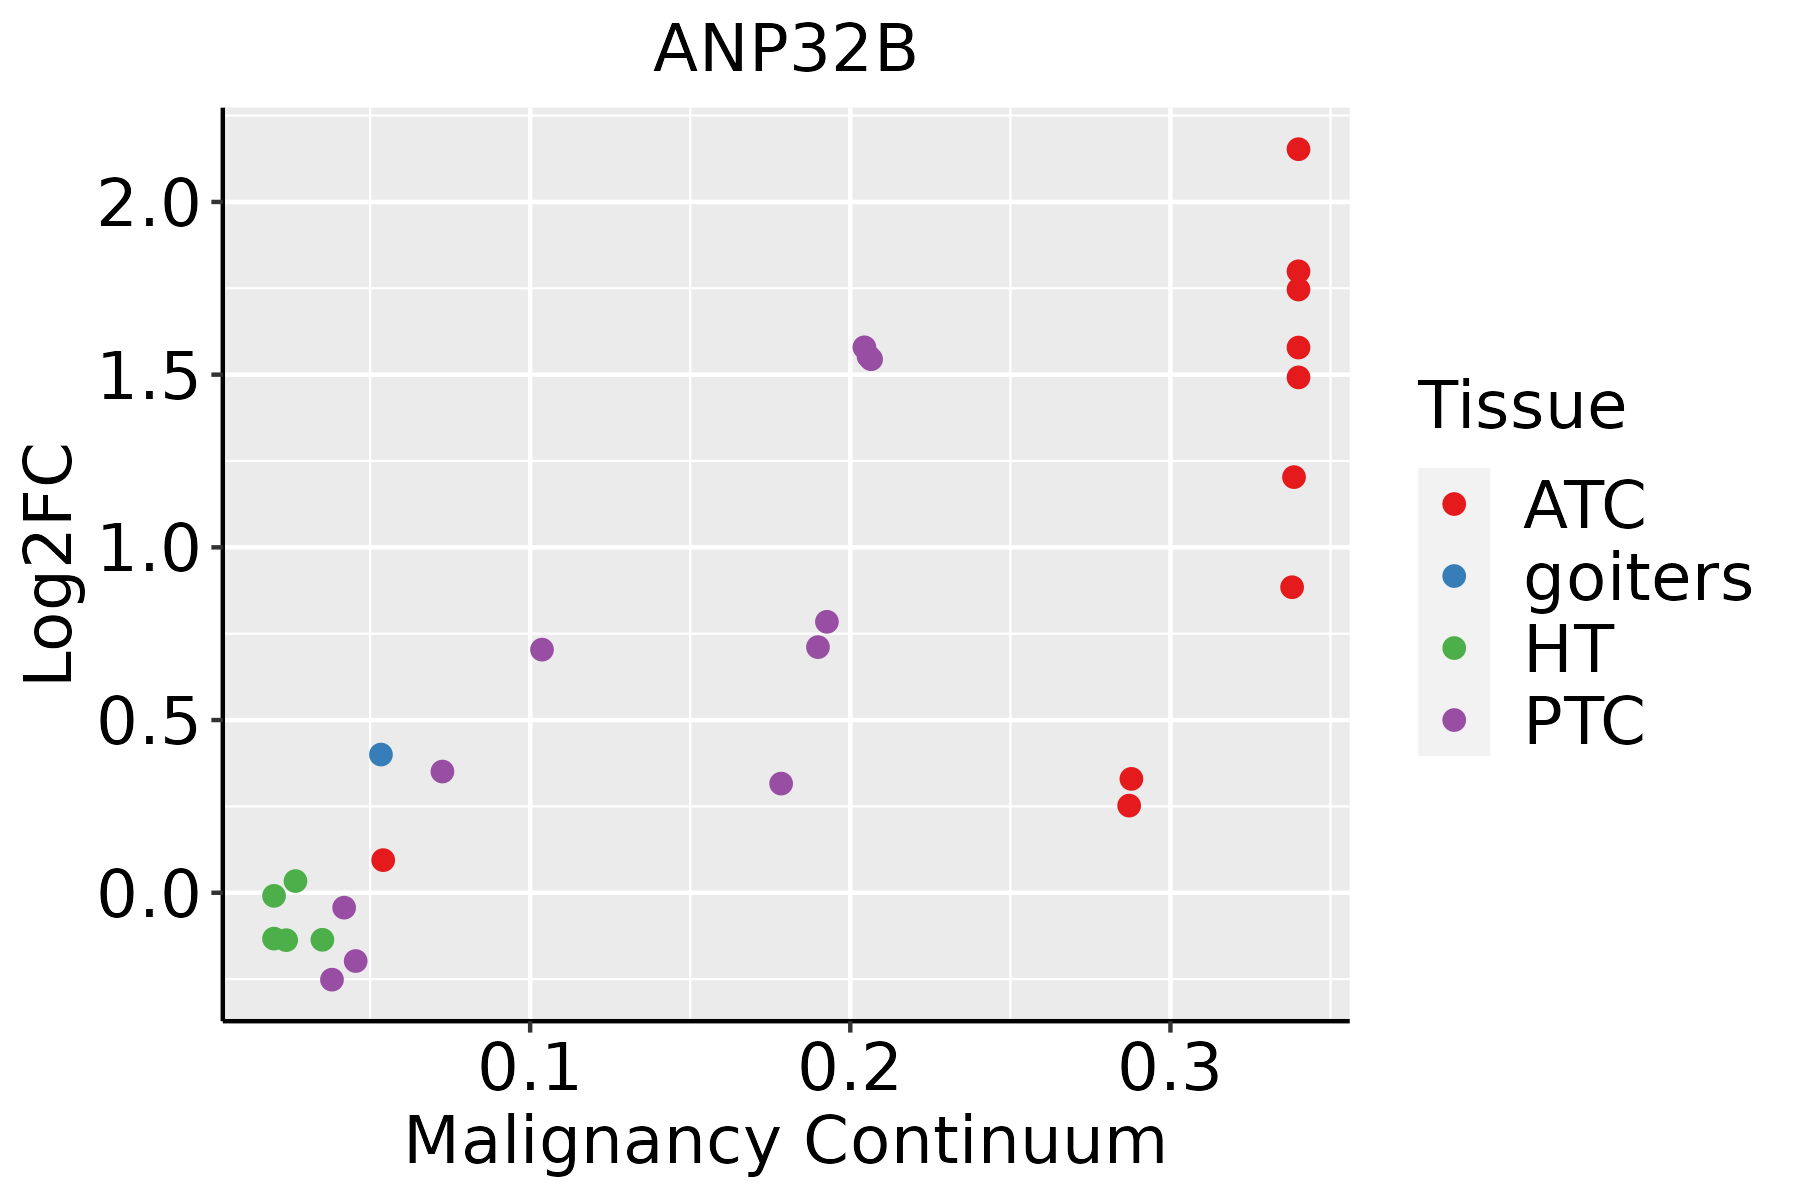
ATC: Anaplastic thyroid cancer
HT: Hashimoto's thyroiditis
PTC: Papillary thyroid cancer
∗log2FC in expression of this searched gene in stem-like cells from each diseased tissue sample relative to stem-like cells in normal samples in each tissue plotted against the malignancy continuum. Samples are colored based on if they are from different disease stage.

Top

Malignant transformation related pathway analysis

check buttonFind out the enriched GO biological processes and KEGG pathways involved in transition from healthy to precancer to cancer
check button Figure of enriched GO biological processes.
TissueDisease StageEnriched GO biological Processes
ColorectumADGO analysis - Figure of enriched GO biological processes: Top 15 enriched GO BP terms are showed in the bar plot of each disease state in each tissue. Each row represents a significant GO biological process which is colored according to the -log10(p.adjust).
ColorectumSERGO analysis - Figure of enriched GO biological processes: Top 15 enriched GO BP terms are showed in the bar plot of each disease state in each tissue. Each row represents a significant GO biological process which is colored according to the -log10(p.adjust).
ColorectumMSSGO analysis - Figure of enriched GO biological processes: Top 15 enriched GO BP terms are showed in the bar plot of each disease state in each tissue. Each row represents a significant GO biological process which is colored according to the -log10(p.adjust).
ColorectumMSI-HGO analysis - Figure of enriched GO biological processes: Top 15 enriched GO BP terms are showed in the bar plot of each disease state in each tissue. Each row represents a significant GO biological process which is colored according to the -log10(p.adjust).
ColorectumFAPGO analysis - Figure of enriched GO biological processes: Top 15 enriched GO BP terms are showed in the bar plot of each disease state in each tissue. Each row represents a significant GO biological process which is colored according to the -log10(p.adjust).
∗Top 15 enriched GO BP terms are showed in the bar plot of each disease state in each tissue. Each row represents a significant GO biological process which is colored according to the -log10(p.adjust).
Page: 1 2 3 4 5 6 7 8 9 

check button Enriched GO biological processes.
GO IDTissueDisease StageDescriptionGene RatioBg Ratiopvaluep.adjustCount
GO:005254812LiverCirrhoticregulation of endopeptidase activity172/4634432/187232.12e-121.58e-10172
GO:190495112LiverCirrhoticpositive regulation of establishment of protein localization135/4634319/187233.20e-122.28e-10135
GO:005122212LiverCirrhoticpositive regulation of protein transport126/4634303/187236.85e-113.77e-09126
GO:003238811LiverCirrhoticpositive regulation of intracellular transport92/4634202/187238.60e-114.66e-0992
GO:009031611LiverCirrhoticpositive regulation of intracellular protein transport77/4634160/187231.17e-106.21e-0977
GO:00432817LiverCirrhoticregulation of cysteine-type endopeptidase activity involved in apoptotic process91/4634209/187231.91e-097.98e-0891
GO:20001167LiverCirrhoticregulation of cysteine-type endopeptidase activity97/4634235/187231.61e-085.99e-0797
GO:000691312LiverCirrhoticnucleocytoplasmic transport118/4634301/187231.71e-086.27e-07118
GO:005116912LiverCirrhoticnuclear transport118/4634301/187231.71e-086.27e-07118
GO:004682211LiverCirrhoticregulation of nucleocytoplasmic transport51/4634106/187231.54e-074.12e-0651
GO:005116812LiverCirrhoticnuclear export67/4634154/187232.57e-076.41e-0667
GO:00109527LiverCirrhoticpositive regulation of peptidase activity81/4634197/187232.89e-077.03e-0681
GO:00109507LiverCirrhoticpositive regulation of endopeptidase activity70/4634179/187231.42e-051.97e-0470
GO:00468246LiverCirrhoticpositive regulation of nucleocytoplasmic transport29/463462/187231.34e-041.31e-0329
GO:00432806LiverCirrhoticpositive regulation of cysteine-type endopeptidase activity involved in apoptotic process51/4634129/187231.42e-041.38e-0351
GO:00066114LiverCirrhoticprotein export from nucleus27/463457/187231.74e-041.63e-0327
GO:00468256LiverCirrhoticregulation of protein export from nucleus17/463430/187231.87e-041.74e-0317
GO:20010566LiverCirrhoticpositive regulation of cysteine-type endopeptidase activity55/4634148/187235.12e-044.06e-0355
GO:00069191LiverCirrhoticactivation of cysteine-type endopeptidase activity involved in apoptotic process31/463478/187232.43e-031.46e-0231
GO:003238621LiverHCCregulation of intracellular transport231/7958337/187231.99e-223.40e-20231
Page: 1 2 3 4 5 6 7 8 9 10 11 12 13 14 15 16 17 18 19 20 21 22 23 24 25 26 27 28 

check button Enriched KEGG pathways.
Pathway IDTissueDisease StageDescriptionGene RatioBg Ratiopvaluep.adjustqvalueCount
Page: 1 

Top

Cell-cell communication analysis

check buttonIdentification of potential cell-cell interactions between two cell types and their ligand-receptor pairs for different disease states
LigandReceptorLRpairPathwayTissueDisease Stage
Page: 1 

Top

Single-cell gene regulatory network inference analysis

check buttonFind out the significant the regulons (TFs) and the target genes of each regulon across cell types for different disease states
TFCell TypeTissueDisease StageTarget GeneRSSRegulon Activity
∗The dot plots of a searched regulon are shown for all cell subpopulations in each disease state of each tissue based on the regulon specific score inferred using pySCENIC and by calculating the average expression.
Page: 1 

Top

Somatic mutation of malignant transformation related genes

check buttonAnnotation of somatic variants for genes involved in malignant transformation
Hugo SymbolVariant ClassVariant ClassificationdbSNP RSHGVScHGVSpHGVSp ShortSWISSPROTBIOTYPESIFTPolyPhenTumor Sample BarcodeTissueHistologySexAgeStageTherapy TypesDrugsOutcome
ANP32BSNVMissense_Mutationnovelc.185A>Tp.Lys62Metp.K62MQ92688protein_codingdeleterious(0)probably_damaging(0.931)TCGA-A2-A4S3-01Breastbreast invasive carcinomaFemale<65I/IIUnknownUnknownSD
ANP32BSNVMissense_Mutationnovelc.178N>Ap.Leu60Ilep.L60IQ92688protein_codingdeleterious(0.03)possibly_damaging(0.818)TCGA-AN-A046-01Breastbreast invasive carcinomaFemale>=65I/IIUnknownUnknownSD
ANP32BSNVMissense_Mutationc.616G>Ap.Asp206Asnp.D206NQ92688protein_codingtolerated(0.16)benign(0.011)TCGA-AN-A0AK-01Breastbreast invasive carcinomaFemale>=65I/IIUnknownUnknownSD
ANP32BSNVMissense_Mutationc.697N>Cp.Glu233Glnp.E233QQ92688protein_codingtolerated(0.1)benign(0.259)TCGA-IR-A3LH-01Cervixcervical & endocervical cancerFemale<65I/IIChemotherapycisplatinCR
ANP32BSNVMissense_Mutationc.241G>Cp.Asp81Hisp.D81HQ92688protein_codingdeleterious(0.02)possibly_damaging(0.869)TCGA-MY-A5BD-01Cervixcervical & endocervical cancerFemale<65I/IIChemotherapycisplatinCR
ANP32BSNVMissense_Mutationc.623N>Gp.Glu208Glyp.E208GQ92688protein_codingtolerated(0.17)probably_damaging(0.932)TCGA-AD-6895-01Colorectumcolon adenocarcinomaMale>=65III/IVUnknownUnknownSD
ANP32BSNVMissense_Mutationc.179N>Gp.Leu60Argp.L60RQ92688protein_codingdeleterious(0)probably_damaging(0.999)TCGA-AZ-5403-01Colorectumcolon adenocarcinomaMale<65I/IIUnknownUnknownPD
ANP32BSNVMissense_Mutationrs761031783c.619N>Ap.Asp207Asnp.D207NQ92688protein_codingtolerated(0.23)benign(0.142)TCGA-AP-A059-01Endometriumuterine corpus endometrioid carcinomaFemale>=65I/IIUnknownUnknownSD
ANP32BSNVMissense_Mutationc.753N>Gp.Asp251Glup.D251EQ92688protein_codingdeleterious_low_confidence(0)benign(0.225)TCGA-AP-A1DV-01Endometriumuterine corpus endometrioid carcinomaFemale<65I/IIUnknownUnknownSD
ANP32BSNVMissense_Mutationnovelc.598N>Ap.Val200Ilep.V200IQ92688protein_codingtolerated(0.42)benign(0.001)TCGA-AX-A06F-01Endometriumuterine corpus endometrioid carcinomaFemale<65III/IVChemotherapycarboplatinSD
Page: 1 2 3 

Top

Related drugs of malignant transformation related genes

check buttonIdentification of chemicals and drugs interact with genes involved in malignant transfromation
(DGIdb 4.0)
Entrez IDSymbolCategoryInteraction TypesDrug Claim NameDrug NamePMIDs
Page: 1