
|
|||||
|
 | |
| |
| |
| |
| |
| |
|
Gene: ACLY |
Gene summary for ACLY |
| Gene information | Species | Human | Gene symbol | ACLY | Gene ID | 47 |
| Gene name | ATP citrate lyase | |
| Gene Alias | ACL | |
| Cytomap | 17q21.2 | |
| Gene Type | protein-coding | GO ID | GO:0006066 | UniProtAcc | A0A024R1T9 |
Top |
Malignant transformation analysis |
| Identification of the aberrant gene expression in precancerous and cancerous lesions by comparing the gene expression of stem-like cells in diseased tissues with normal stem cells |
| Entrez ID | Symbol | Replicates | Species | Organ | Tissue | Adj P-value | Log2FC | Malignancy |
| 47 | ACLY | LZE2T | Human | Esophagus | ESCC | 5.40e-05 | 4.67e-01 | 0.082 |
| 47 | ACLY | LZE4T | Human | Esophagus | ESCC | 4.34e-06 | 2.76e-01 | 0.0811 |
| 47 | ACLY | LZE5T | Human | Esophagus | ESCC | 2.62e-02 | 9.73e-02 | 0.0514 |
| 47 | ACLY | LZE7T | Human | Esophagus | ESCC | 2.41e-07 | 5.77e-01 | 0.0667 |
| 47 | ACLY | LZE8T | Human | Esophagus | ESCC | 2.02e-08 | 1.16e-01 | 0.067 |
| 47 | ACLY | LZE20T | Human | Esophagus | ESCC | 2.62e-02 | 2.39e-02 | 0.0662 |
| 47 | ACLY | LZE24T | Human | Esophagus | ESCC | 7.83e-15 | 4.71e-01 | 0.0596 |
| 47 | ACLY | LZE21T | Human | Esophagus | ESCC | 1.19e-05 | 3.33e-01 | 0.0655 |
| 47 | ACLY | LZE6T | Human | Esophagus | ESCC | 2.94e-02 | 2.16e-01 | 0.0845 |
| 47 | ACLY | P1T-E | Human | Esophagus | ESCC | 8.34e-12 | 3.20e-01 | 0.0875 |
| 47 | ACLY | P2T-E | Human | Esophagus | ESCC | 4.39e-20 | 1.94e-01 | 0.1177 |
| 47 | ACLY | P4T-E | Human | Esophagus | ESCC | 9.28e-16 | 4.33e-01 | 0.1323 |
| 47 | ACLY | P5T-E | Human | Esophagus | ESCC | 1.89e-20 | 5.12e-01 | 0.1327 |
| 47 | ACLY | P8T-E | Human | Esophagus | ESCC | 8.36e-27 | 2.94e-01 | 0.0889 |
| 47 | ACLY | P9T-E | Human | Esophagus | ESCC | 6.92e-10 | 1.76e-01 | 0.1131 |
| 47 | ACLY | P10T-E | Human | Esophagus | ESCC | 3.31e-17 | 2.25e-01 | 0.116 |
| 47 | ACLY | P11T-E | Human | Esophagus | ESCC | 1.75e-13 | 6.10e-01 | 0.1426 |
| 47 | ACLY | P12T-E | Human | Esophagus | ESCC | 4.54e-22 | 3.82e-01 | 0.1122 |
| 47 | ACLY | P15T-E | Human | Esophagus | ESCC | 2.63e-20 | 5.30e-01 | 0.1149 |
| 47 | ACLY | P16T-E | Human | Esophagus | ESCC | 9.66e-10 | 2.69e-01 | 0.1153 |
| Page: 1 2 3 4 5 6 |
| Tissue | Expression Dynamics | Abbreviation |
| Esophagus | 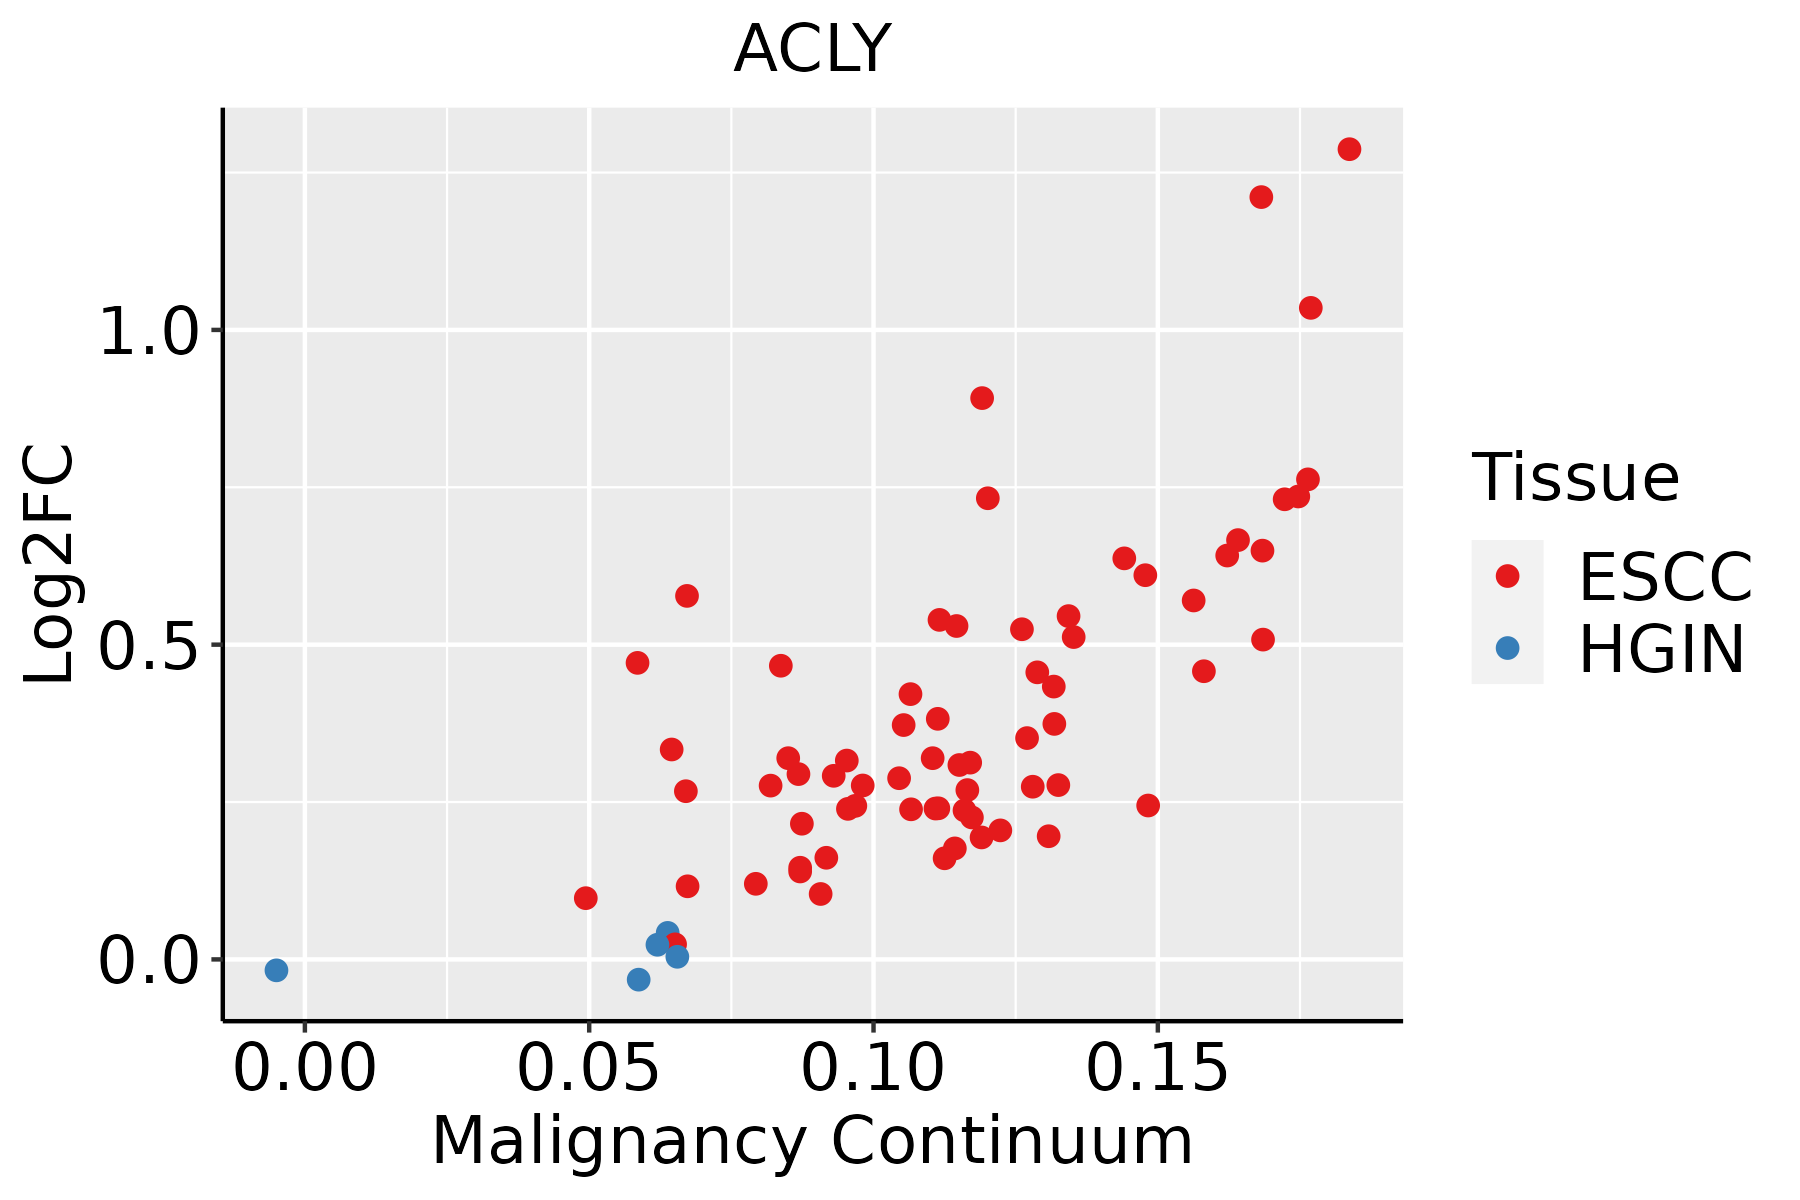 | ESCC: Esophageal squamous cell carcinoma |
| HGIN: High-grade intraepithelial neoplasias | ||
| LGIN: Low-grade intraepithelial neoplasias | ||
| Liver |  | HCC: Hepatocellular carcinoma |
| NAFLD: Non-alcoholic fatty liver disease | ||
| Oral Cavity | 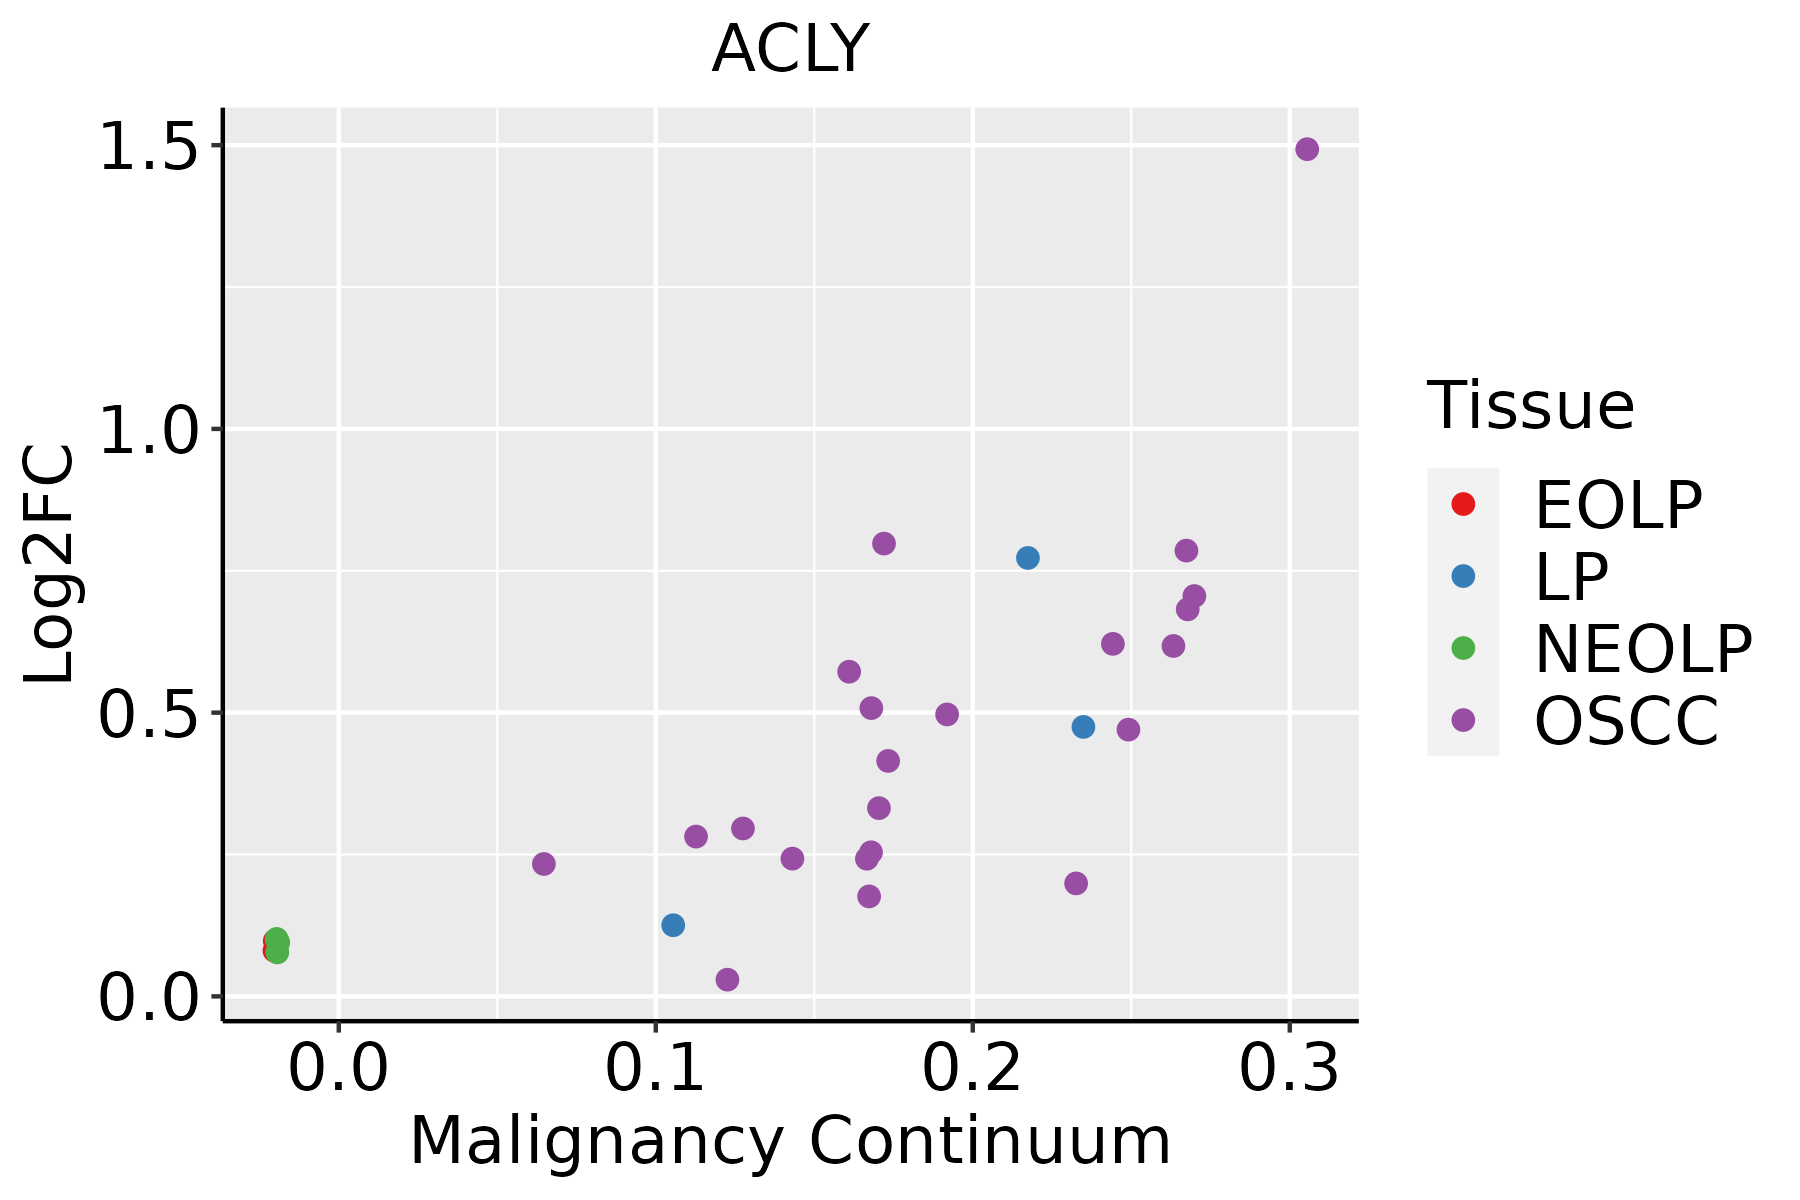 | EOLP: Erosive Oral lichen planus |
| LP: leukoplakia | ||
| NEOLP: Non-erosive oral lichen planus | ||
| OSCC: Oral squamous cell carcinoma | ||
| Prostate | 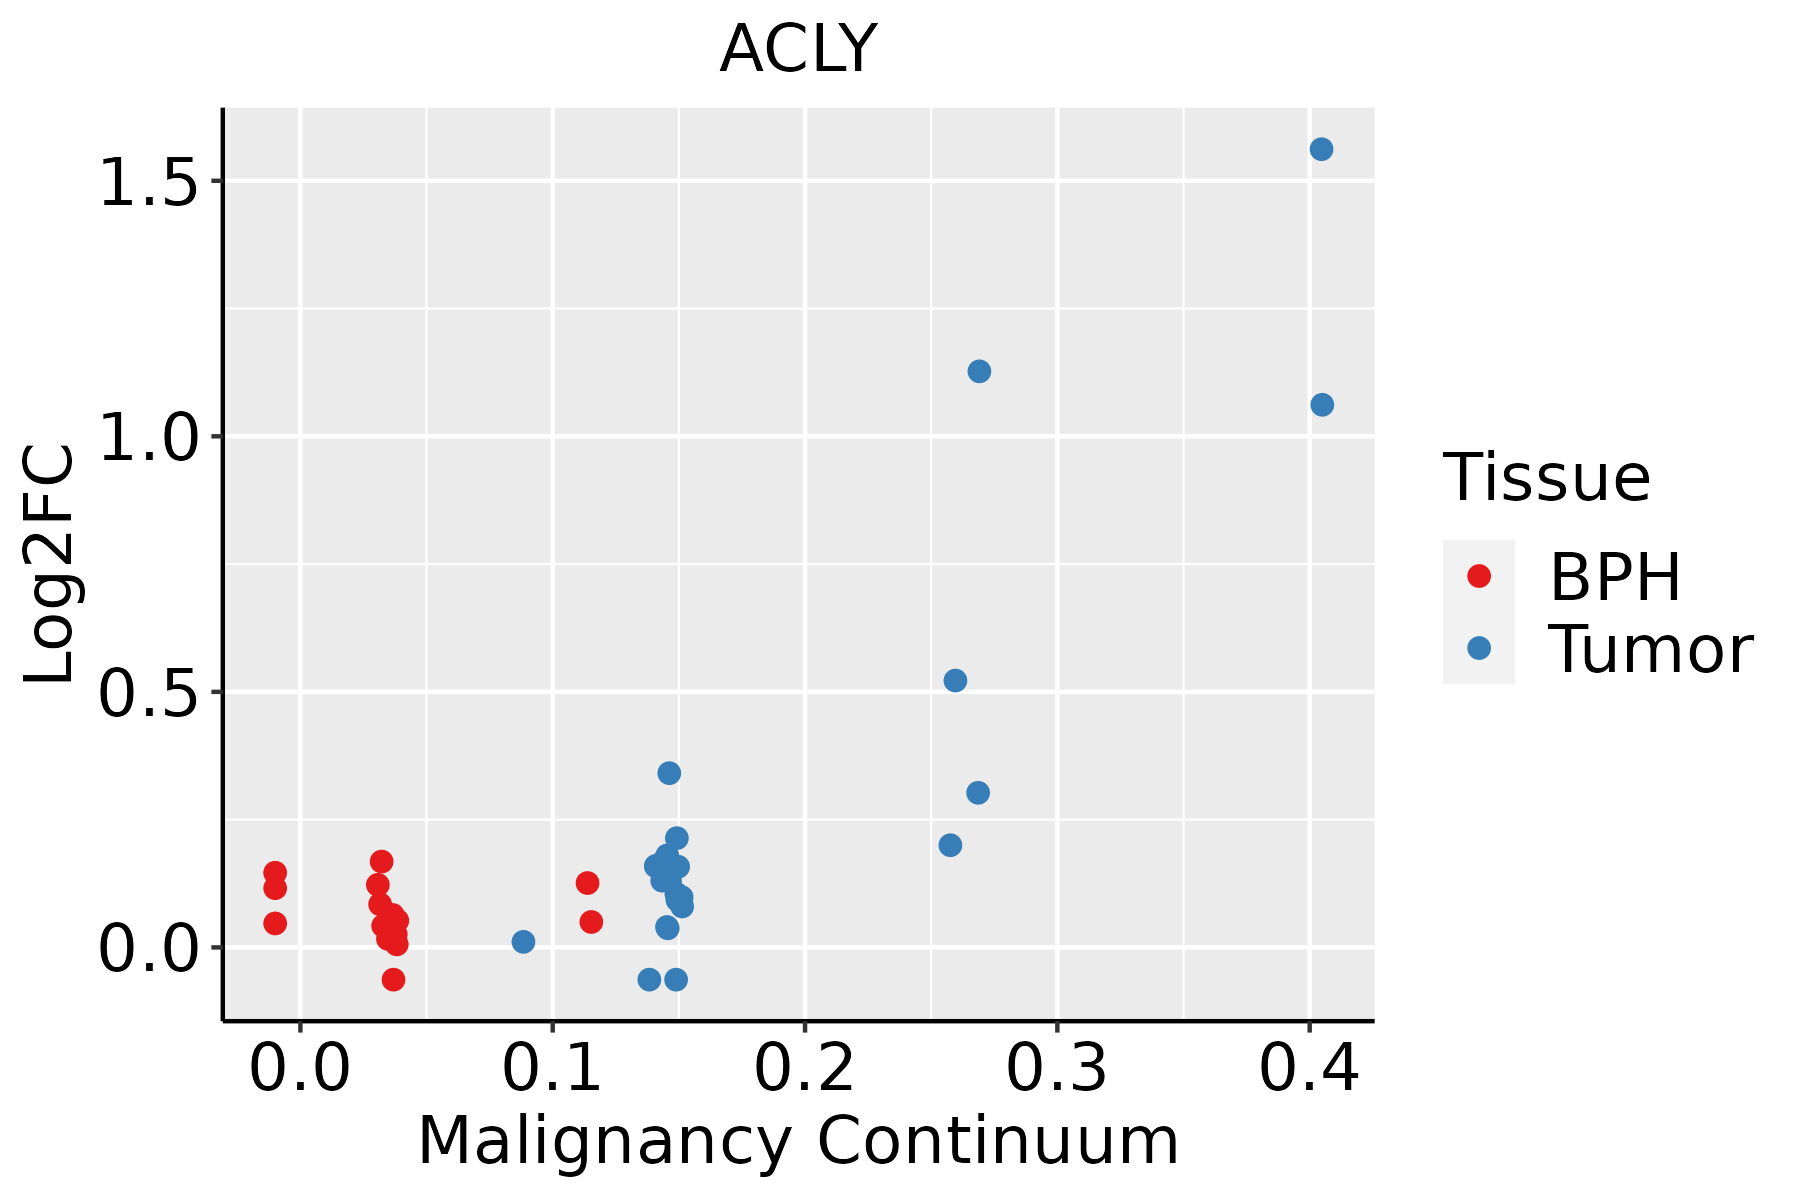 | BPH: Benign Prostatic Hyperplasia |
| Skin | 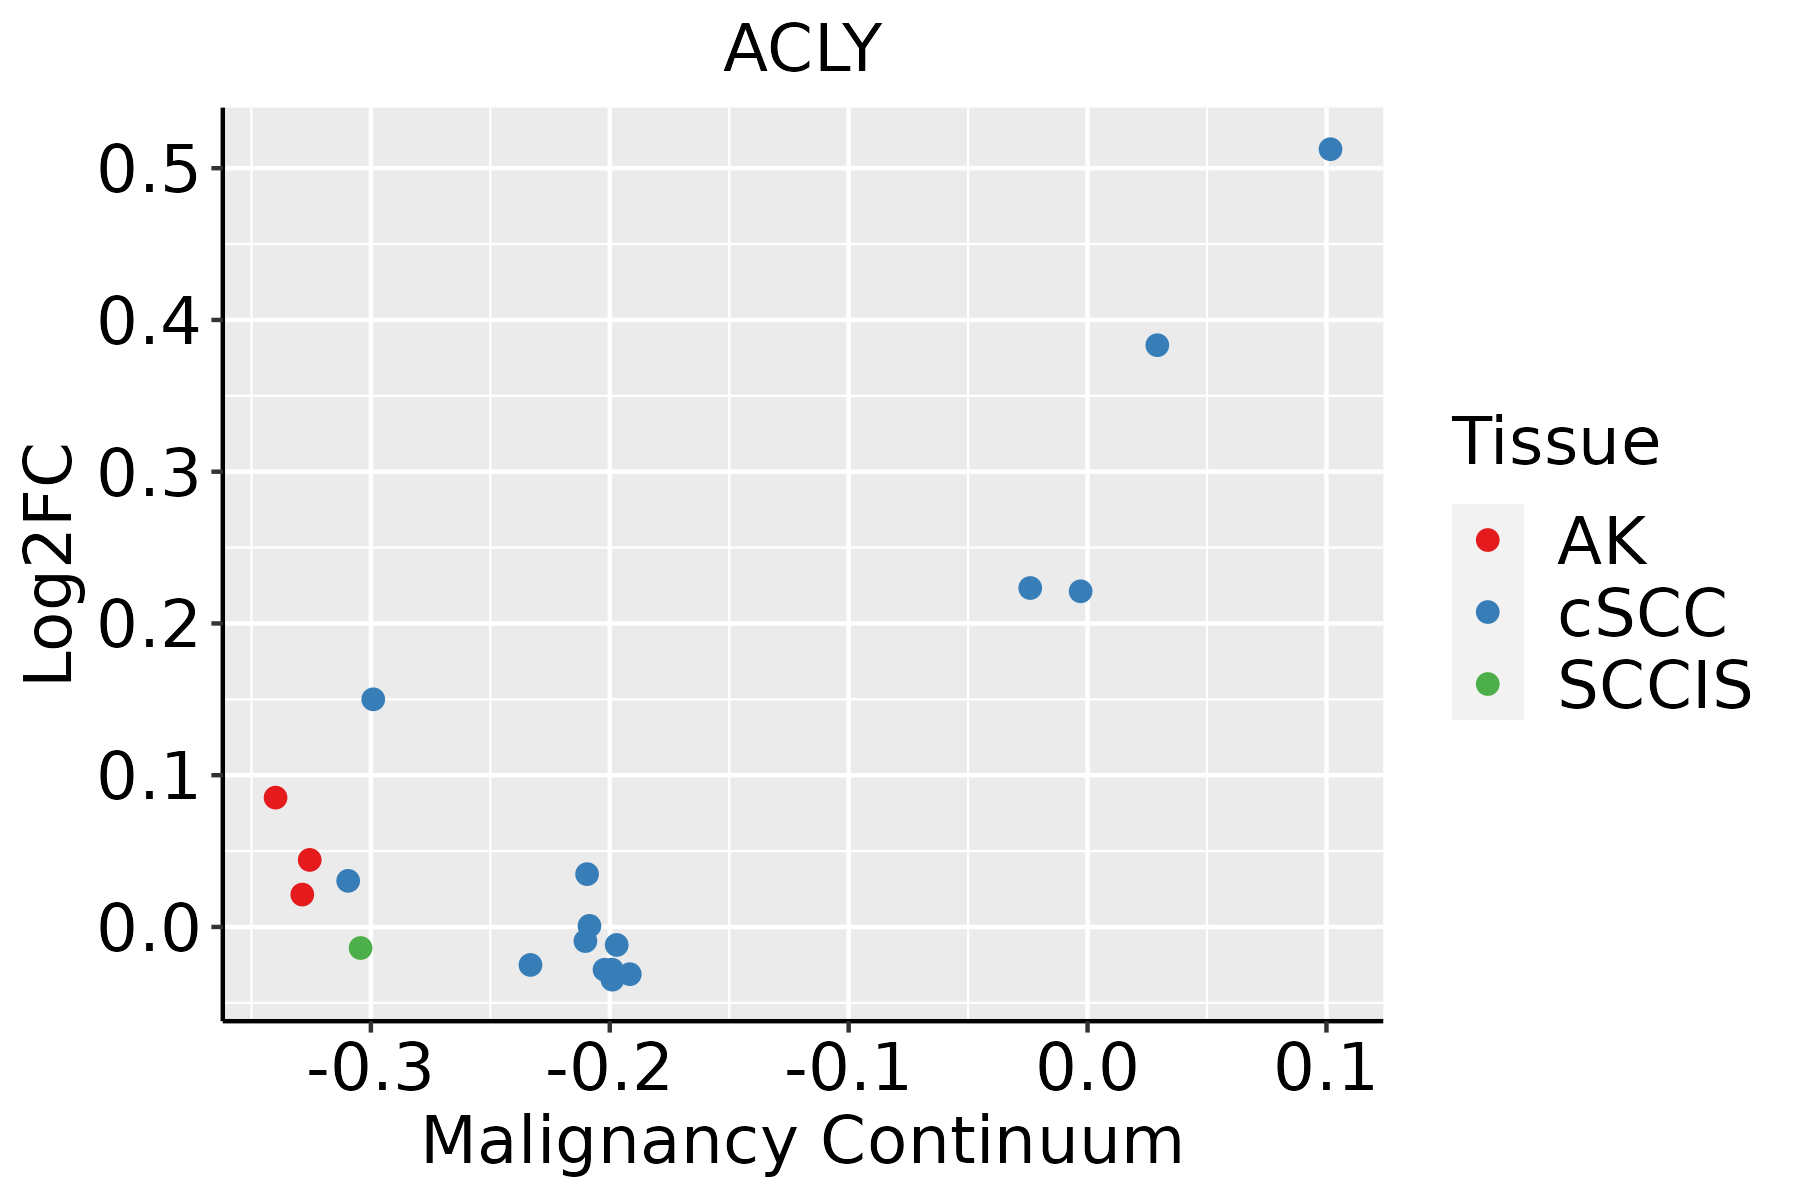 | AK: Actinic keratosis |
| cSCC: Cutaneous squamous cell carcinoma | ||
| SCCIS:squamous cell carcinoma in situ | ||
| Thyroid | 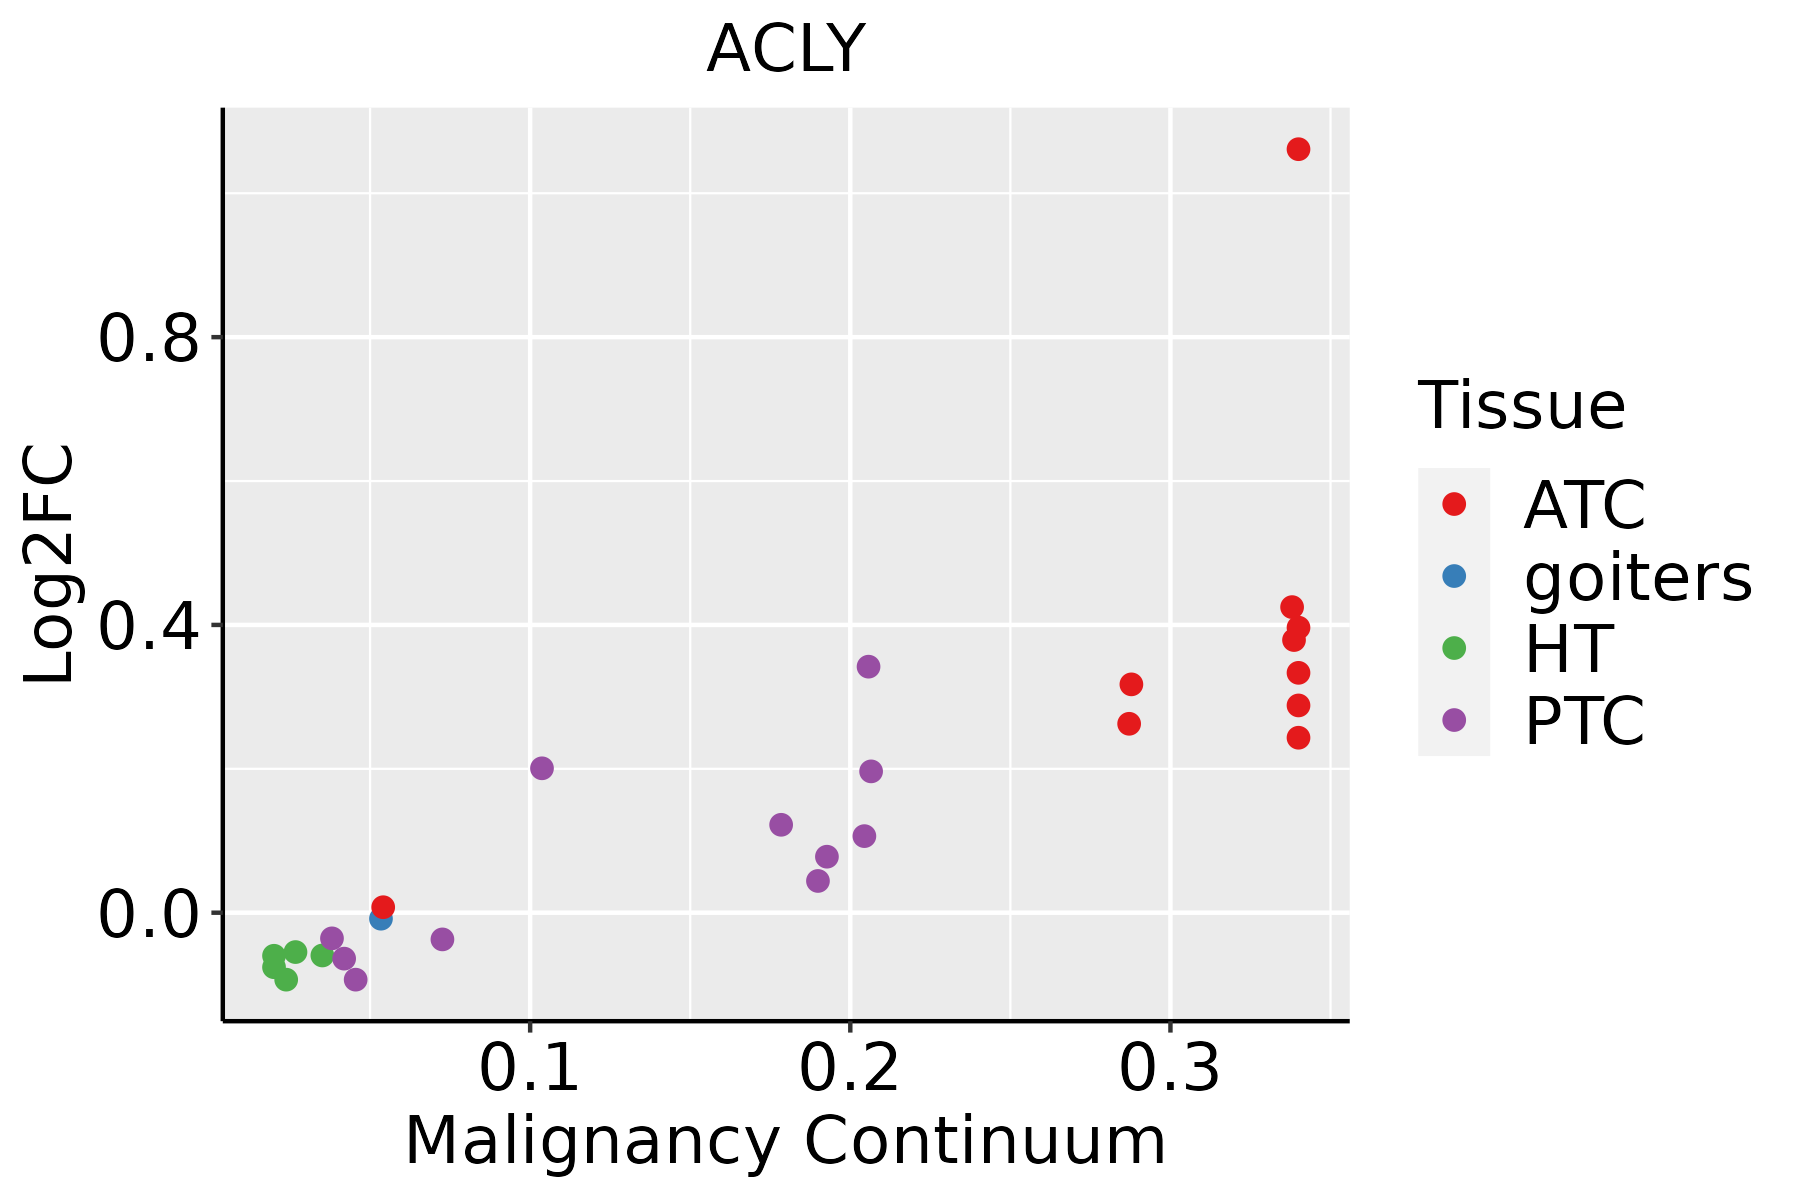 | ATC: Anaplastic thyroid cancer |
| HT: Hashimoto's thyroiditis | ||
| PTC: Papillary thyroid cancer |
| ∗log2FC in expression of this searched gene in stem-like cells from each diseased tissue sample relative to stem-like cells in normal samples in each tissue plotted against the malignancy continuum. Samples are colored based on if they are from different disease stage. |
Top |
Malignant transformation related pathway analysis |
| Find out the enriched GO biological processes and KEGG pathways involved in transition from healthy to precancer to cancer |
| Tissue | Disease Stage | Enriched GO biological Processes |
| Colorectum | AD |  |
| Colorectum | SER |  |
| Colorectum | MSS |  |
| Colorectum | MSI-H |  |
| Colorectum | FAP |  |
| ∗Top 15 enriched GO BP terms are showed in the bar plot of each disease state in each tissue. Each row represents a significant GO biological process which is colored according to the -log10(p.adjust). |
| Page: 1 2 3 4 5 6 7 8 9 |
| GO ID | Tissue | Disease Stage | Description | Gene Ratio | Bg Ratio | pvalue | p.adjust | Count |
| GO:00060844 | Skin | cSCC | acetyl-CoA metabolic process | 16/4864 | 35/18723 | 9.09e-03 | 4.16e-02 | 16 |
| GO:001969327 | Thyroid | PTC | ribose phosphate metabolic process | 176/5968 | 396/18723 | 8.28e-08 | 1.70e-06 | 176 |
| GO:000915028 | Thyroid | PTC | purine ribonucleotide metabolic process | 165/5968 | 368/18723 | 1.03e-07 | 2.05e-06 | 165 |
| GO:007252127 | Thyroid | PTC | purine-containing compound metabolic process | 182/5968 | 416/18723 | 1.92e-07 | 3.51e-06 | 182 |
| GO:000925927 | Thyroid | PTC | ribonucleotide metabolic process | 170/5968 | 385/18723 | 2.32e-07 | 4.08e-06 | 170 |
| GO:000616327 | Thyroid | PTC | purine nucleotide metabolic process | 170/5968 | 396/18723 | 2.02e-06 | 2.75e-05 | 170 |
| GO:000675325 | Thyroid | PTC | nucleoside phosphate metabolic process | 205/5968 | 497/18723 | 5.24e-06 | 6.35e-05 | 205 |
| GO:000911725 | Thyroid | PTC | nucleotide metabolic process | 202/5968 | 489/18723 | 5.46e-06 | 6.60e-05 | 202 |
| GO:000915224 | Thyroid | PTC | purine ribonucleotide biosynthetic process | 78/5968 | 169/18723 | 6.88e-05 | 6.01e-04 | 78 |
| GO:004639024 | Thyroid | PTC | ribose phosphate biosynthetic process | 85/5968 | 190/18723 | 1.30e-04 | 1.03e-03 | 85 |
| GO:000926024 | Thyroid | PTC | ribonucleotide biosynthetic process | 81/5968 | 182/18723 | 2.27e-04 | 1.65e-03 | 81 |
| GO:00723505 | Thyroid | PTC | tricarboxylic acid metabolic process | 11/5968 | 14/18723 | 4.45e-04 | 2.95e-03 | 11 |
| GO:007252219 | Thyroid | PTC | purine-containing compound biosynthetic process | 86/5968 | 200/18723 | 5.85e-04 | 3.72e-03 | 86 |
| GO:000616419 | Thyroid | PTC | purine nucleotide biosynthetic process | 81/5968 | 191/18723 | 1.35e-03 | 7.65e-03 | 81 |
| GO:00442726 | Thyroid | PTC | sulfur compound biosynthetic process | 63/5968 | 148/18723 | 3.91e-03 | 1.87e-02 | 63 |
| GO:001969328 | Thyroid | ATC | ribose phosphate metabolic process | 184/6293 | 396/18723 | 5.87e-08 | 1.05e-06 | 184 |
| GO:000915029 | Thyroid | ATC | purine ribonucleotide metabolic process | 172/6293 | 368/18723 | 9.58e-08 | 1.64e-06 | 172 |
| GO:000925928 | Thyroid | ATC | ribonucleotide metabolic process | 178/6293 | 385/18723 | 1.47e-07 | 2.39e-06 | 178 |
| GO:007252128 | Thyroid | ATC | purine-containing compound metabolic process | 189/6293 | 416/18723 | 2.83e-07 | 4.29e-06 | 189 |
| GO:0006753111 | Thyroid | ATC | nucleoside phosphate metabolic process | 219/6293 | 497/18723 | 5.92e-07 | 8.29e-06 | 219 |
| Page: 1 2 3 4 5 6 7 8 9 10 11 12 13 14 15 |
| Pathway ID | Tissue | Disease Stage | Description | Gene Ratio | Bg Ratio | pvalue | p.adjust | qvalue | Count |
| hsa0002010 | Liver | Cirrhotic | Citrate cycle (TCA cycle) | 21/2530 | 30/8465 | 6.56e-06 | 6.24e-05 | 3.84e-05 | 21 |
| hsa0002011 | Liver | Cirrhotic | Citrate cycle (TCA cycle) | 21/2530 | 30/8465 | 6.56e-06 | 6.24e-05 | 3.84e-05 | 21 |
| hsa0002021 | Liver | HCC | Citrate cycle (TCA cycle) | 28/4020 | 30/8465 | 1.08e-07 | 1.44e-06 | 8.02e-07 | 28 |
| hsa0002031 | Liver | HCC | Citrate cycle (TCA cycle) | 28/4020 | 30/8465 | 1.08e-07 | 1.44e-06 | 8.02e-07 | 28 |
| Page: 1 |
Top |
Cell-cell communication analysis |
| Identification of potential cell-cell interactions between two cell types and their ligand-receptor pairs for different disease states |
| Ligand | Receptor | LRpair | Pathway | Tissue | Disease Stage |
| Page: 1 |
Top |
Single-cell gene regulatory network inference analysis |
| Find out the significant the regulons (TFs) and the target genes of each regulon across cell types for different disease states |
| TF | Cell Type | Tissue | Disease Stage | Target Gene | RSS | Regulon Activity |
| ∗The dot plots of a searched regulon are shown for all cell subpopulations in each disease state of each tissue based on the regulon specific score inferred using pySCENIC and by calculating the average expression. |
| Page: 1 |
Top |
Somatic mutation of malignant transformation related genes |
| Annotation of somatic variants for genes involved in malignant transformation |
| Hugo Symbol | Variant Class | Variant Classification | dbSNP RS | HGVSc | HGVSp | HGVSp Short | SWISSPROT | BIOTYPE | SIFT | PolyPhen | Tumor Sample Barcode | Tissue | Histology | Sex | Age | Stage | Therapy Types | Drugs | Outcome |
| ACLY | SNV | Missense_Mutation | c.2996C>T | p.Pro999Leu | p.P999L | P53396 | protein_coding | deleterious(0) | possibly_damaging(0.691) | TCGA-A2-A0SU-01 | Breast | breast invasive carcinoma | Female | >=65 | I/II | Hormone Therapy | arimidex | SD | |
| ACLY | SNV | Missense_Mutation | c.2543G>A | p.Arg848Gln | p.R848Q | P53396 | protein_coding | deleterious(0) | probably_damaging(0.978) | TCGA-A2-A0SV-01 | Breast | breast invasive carcinoma | Female | <65 | III/IV | Other, specify in notesBisphosphonate therapy | zometa | PD | |
| ACLY | SNV | Missense_Mutation | novel | c.1285N>A | p.Pro429Thr | p.P429T | P53396 | protein_coding | tolerated(0.12) | benign(0.399) | TCGA-A7-A4SB-01 | Breast | breast invasive carcinoma | Female | <65 | III/IV | Chemotherapy | docetaxel | CR |
| ACLY | SNV | Missense_Mutation | novel | c.2798A>G | p.Asp933Gly | p.D933G | P53396 | protein_coding | deleterious(0.04) | possibly_damaging(0.735) | TCGA-AC-A8OP-01 | Breast | breast invasive carcinoma | Female | >=65 | I/II | Unknown | Unknown | SD |
| ACLY | SNV | Missense_Mutation | c.604N>T | p.Ile202Phe | p.I202F | P53396 | protein_coding | deleterious(0.01) | probably_damaging(0.998) | TCGA-E2-A1B0-01 | Breast | breast invasive carcinoma | Female | <65 | III/IV | Chemotherapy | cytoxan | SD | |
| ACLY | insertion | Frame_Shift_Ins | novel | c.1181_1182insGGCAGCGAGA | p.Gly395AlafsTer67 | p.G395Afs*67 | P53396 | protein_coding | TCGA-A7-A0CJ-01 | Breast | breast invasive carcinoma | Female | <65 | I/II | Chemotherapy | cytoxan | SD | ||
| ACLY | SNV | Missense_Mutation | c.22N>C | p.Glu8Gln | p.E8Q | P53396 | protein_coding | deleterious(0) | probably_damaging(0.991) | TCGA-C5-A1M7-01 | Cervix | cervical & endocervical cancer | Female | <65 | I/II | Unknown | Unknown | SD | |
| ACLY | SNV | Missense_Mutation | novel | c.940C>A | p.Gln314Lys | p.Q314K | P53396 | protein_coding | tolerated(0.85) | benign(0.007) | TCGA-C5-A902-01 | Cervix | cervical & endocervical cancer | Female | <65 | I/II | Chemotherapy | cisplatin | SD |
| ACLY | SNV | Missense_Mutation | rs782078720 | c.1384N>A | p.Asp462Asn | p.D462N | P53396 | protein_coding | tolerated(0.52) | benign(0) | TCGA-DR-A0ZM-01 | Cervix | cervical & endocervical cancer | Female | <65 | III/IV | Unspecific | Cisplatin | SD |
| ACLY | SNV | Missense_Mutation | rs387907386 | c.1484N>A | p.Arg495His | p.R495H | P53396 | protein_coding | tolerated(0.07) | benign(0.3) | TCGA-EA-A410-01 | Cervix | cervical & endocervical cancer | Female | <65 | I/II | Unknown | Unknown | SD |
| Page: 1 2 3 4 5 6 7 8 9 10 |
Top |
Related drugs of malignant transformation related genes |
| Identification of chemicals and drugs interact with genes involved in malignant transfromation |
| (DGIdb 4.0) |
| Entrez ID | Symbol | Category | Interaction Types | Drug Claim Name | Drug Name | PMIDs |
| 47 | ACLY | ENZYME, DRUGGABLE GENOME | ETC-1002 | BEMPEDOIC ACID | ||
| 47 | ACLY | ENZYME, DRUGGABLE GENOME | GLUCAGON | GLUCAGON | 489538 |
| Page: 1 |

Copyright 2023-Present -The University of Texas Health Science Center at Houston |