
|
|||||
|
 | |
| |
| |
| |
| |
| |
|
Gene: BCL2 |
Gene summary for BCL2 |
| Gene information | Species | Human | Gene symbol | BCL2 | Gene ID | 596 |
| Gene name | BCL2 apoptosis regulator | |
| Gene Alias | Bcl-2 | |
| Cytomap | 18q21.33 | |
| Gene Type | protein-coding | GO ID | GO:0000003 | UniProtAcc | A0A024R2B3 |
Top |
Malignant transformation analysis |
| Identification of the aberrant gene expression in precancerous and cancerous lesions by comparing the gene expression of stem-like cells in diseased tissues with normal stem cells |
| Entrez ID | Symbol | Replicates | Species | Organ | Tissue | Adj P-value | Log2FC | Malignancy |
| 596 | BCL2 | HTA11_3410_2000001011 | Human | Colorectum | AD | 1.24e-07 | -5.25e-01 | 0.0155 |
| 596 | BCL2 | HTA11_2487_2000001011 | Human | Colorectum | SER | 3.41e-09 | -7.41e-01 | -0.1808 |
| 596 | BCL2 | HTA11_2951_2000001011 | Human | Colorectum | AD | 1.48e-02 | -6.56e-01 | 0.0216 |
| 596 | BCL2 | HTA11_1938_2000001011 | Human | Colorectum | AD | 1.86e-04 | -6.46e-01 | -0.0811 |
| 596 | BCL2 | HTA11_78_2000001011 | Human | Colorectum | AD | 3.32e-02 | -4.93e-01 | -0.1088 |
| 596 | BCL2 | HTA11_411_2000001011 | Human | Colorectum | SER | 6.06e-03 | -8.87e-01 | -0.2602 |
| 596 | BCL2 | HTA11_2112_2000001011 | Human | Colorectum | SER | 8.98e-03 | -8.81e-01 | -0.2196 |
| 596 | BCL2 | HTA11_3361_2000001011 | Human | Colorectum | AD | 1.34e-07 | -7.25e-01 | -0.1207 |
| 596 | BCL2 | HTA11_696_2000001011 | Human | Colorectum | AD | 2.75e-08 | -5.41e-01 | -0.1464 |
| 596 | BCL2 | HTA11_1391_2000001011 | Human | Colorectum | AD | 3.53e-04 | -4.55e-01 | -0.059 |
| 596 | BCL2 | HTA11_2992_2000001011 | Human | Colorectum | SER | 8.75e-04 | -7.74e-01 | -0.1706 |
| 596 | BCL2 | HTA11_5212_2000001011 | Human | Colorectum | AD | 1.99e-06 | -9.38e-01 | -0.2061 |
| 596 | BCL2 | HTA11_866_3004761011 | Human | Colorectum | AD | 6.02e-05 | -5.37e-01 | 0.096 |
| 596 | BCL2 | HTA11_10711_2000001011 | Human | Colorectum | AD | 7.29e-04 | -5.45e-01 | 0.0338 |
| 596 | BCL2 | HTA11_7696_3000711011 | Human | Colorectum | AD | 5.22e-11 | -5.46e-01 | 0.0674 |
| 596 | BCL2 | HTA11_6818_2000001021 | Human | Colorectum | AD | 5.07e-06 | -6.80e-01 | 0.0588 |
| 596 | BCL2 | HTA11_99999970781_79442 | Human | Colorectum | MSS | 3.45e-28 | -7.48e-01 | 0.294 |
| 596 | BCL2 | HTA11_99999965104_69814 | Human | Colorectum | MSS | 1.07e-02 | -5.71e-01 | 0.281 |
| 596 | BCL2 | HTA11_99999971662_82457 | Human | Colorectum | MSS | 2.36e-54 | -1.13e+00 | 0.3859 |
| 596 | BCL2 | HTA11_99999973899_84307 | Human | Colorectum | MSS | 1.30e-05 | -6.55e-01 | 0.2585 |
| Page: 1 2 3 4 5 6 7 |
| Tissue | Expression Dynamics | Abbreviation |
| Colorectum (GSE201348) | 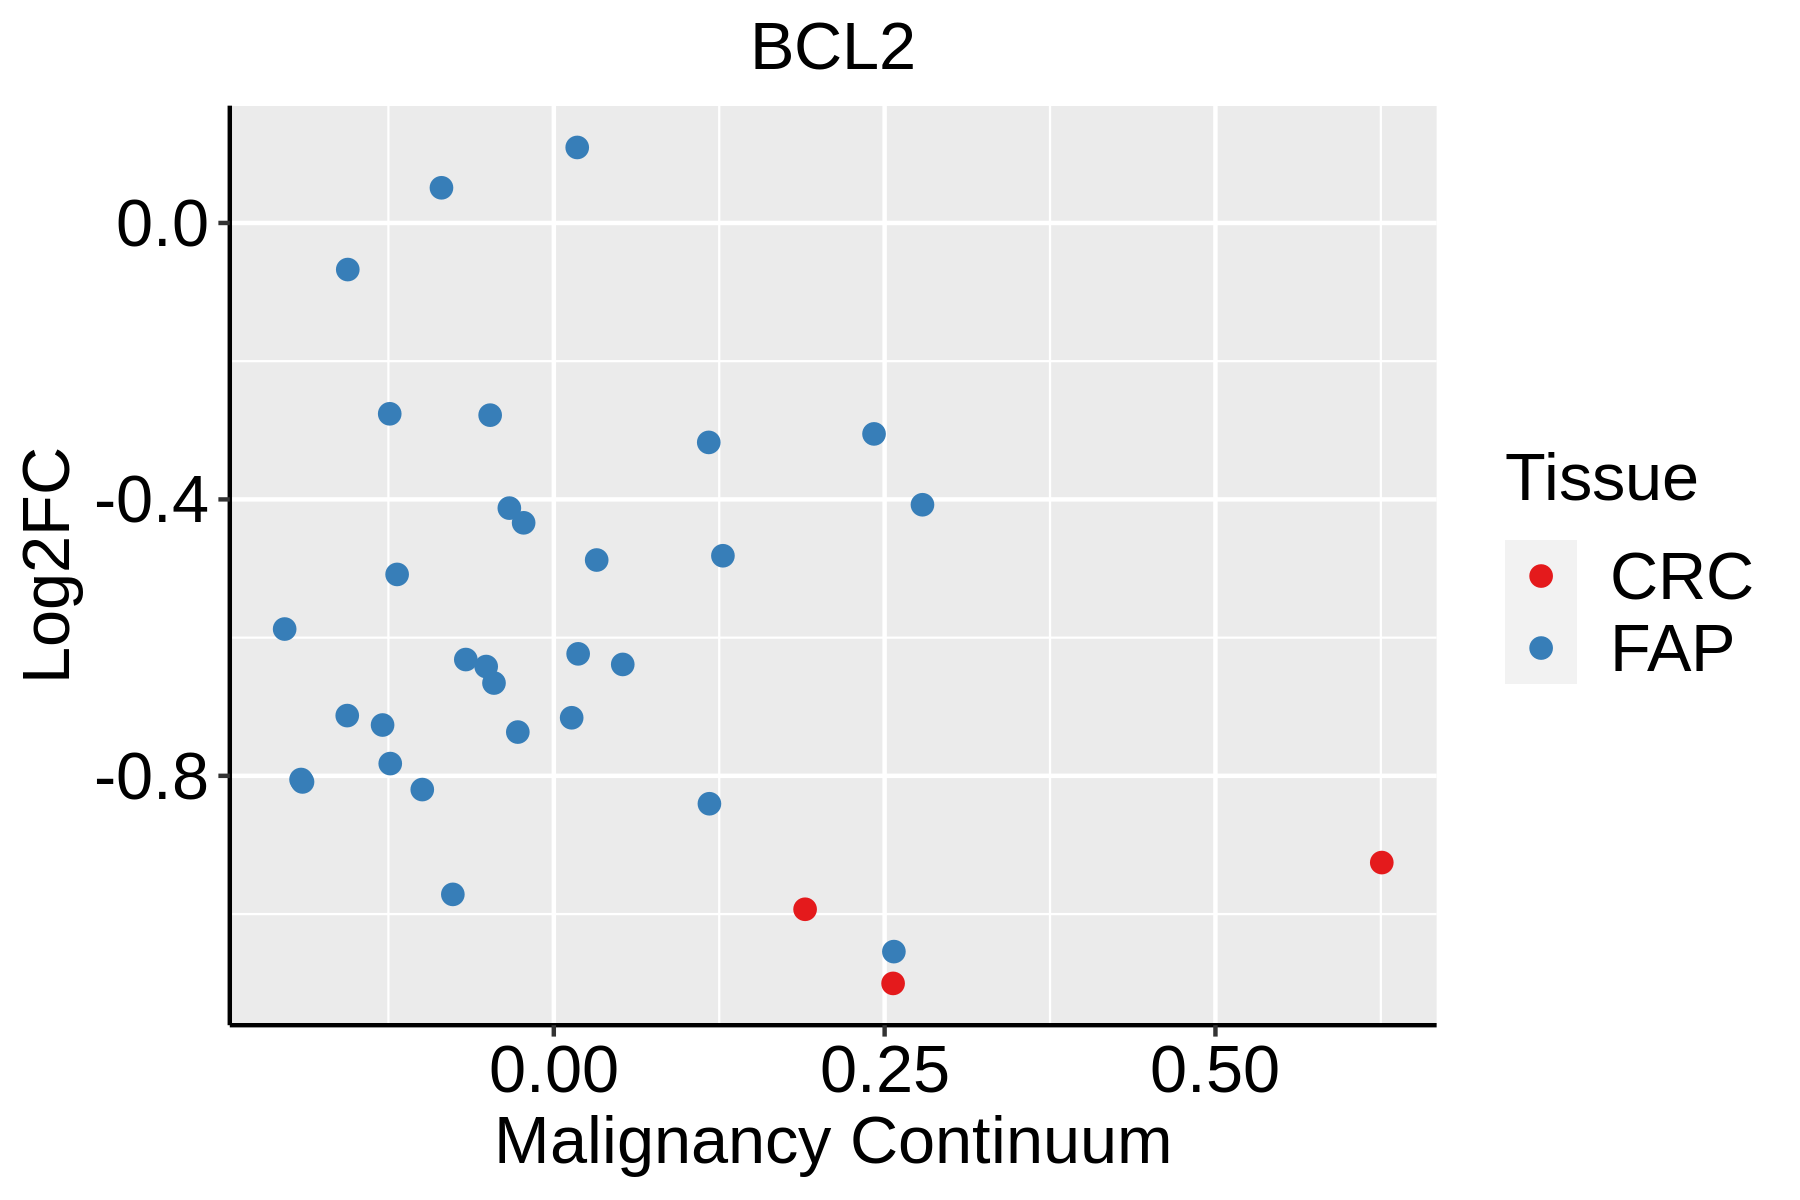 | FAP: Familial adenomatous polyposis |
| CRC: Colorectal cancer | ||
| Colorectum (HTA11) |  | AD: Adenomas |
| SER: Sessile serrated lesions | ||
| MSI-H: Microsatellite-high colorectal cancer | ||
| MSS: Microsatellite stable colorectal cancer | ||
| Endometrium | 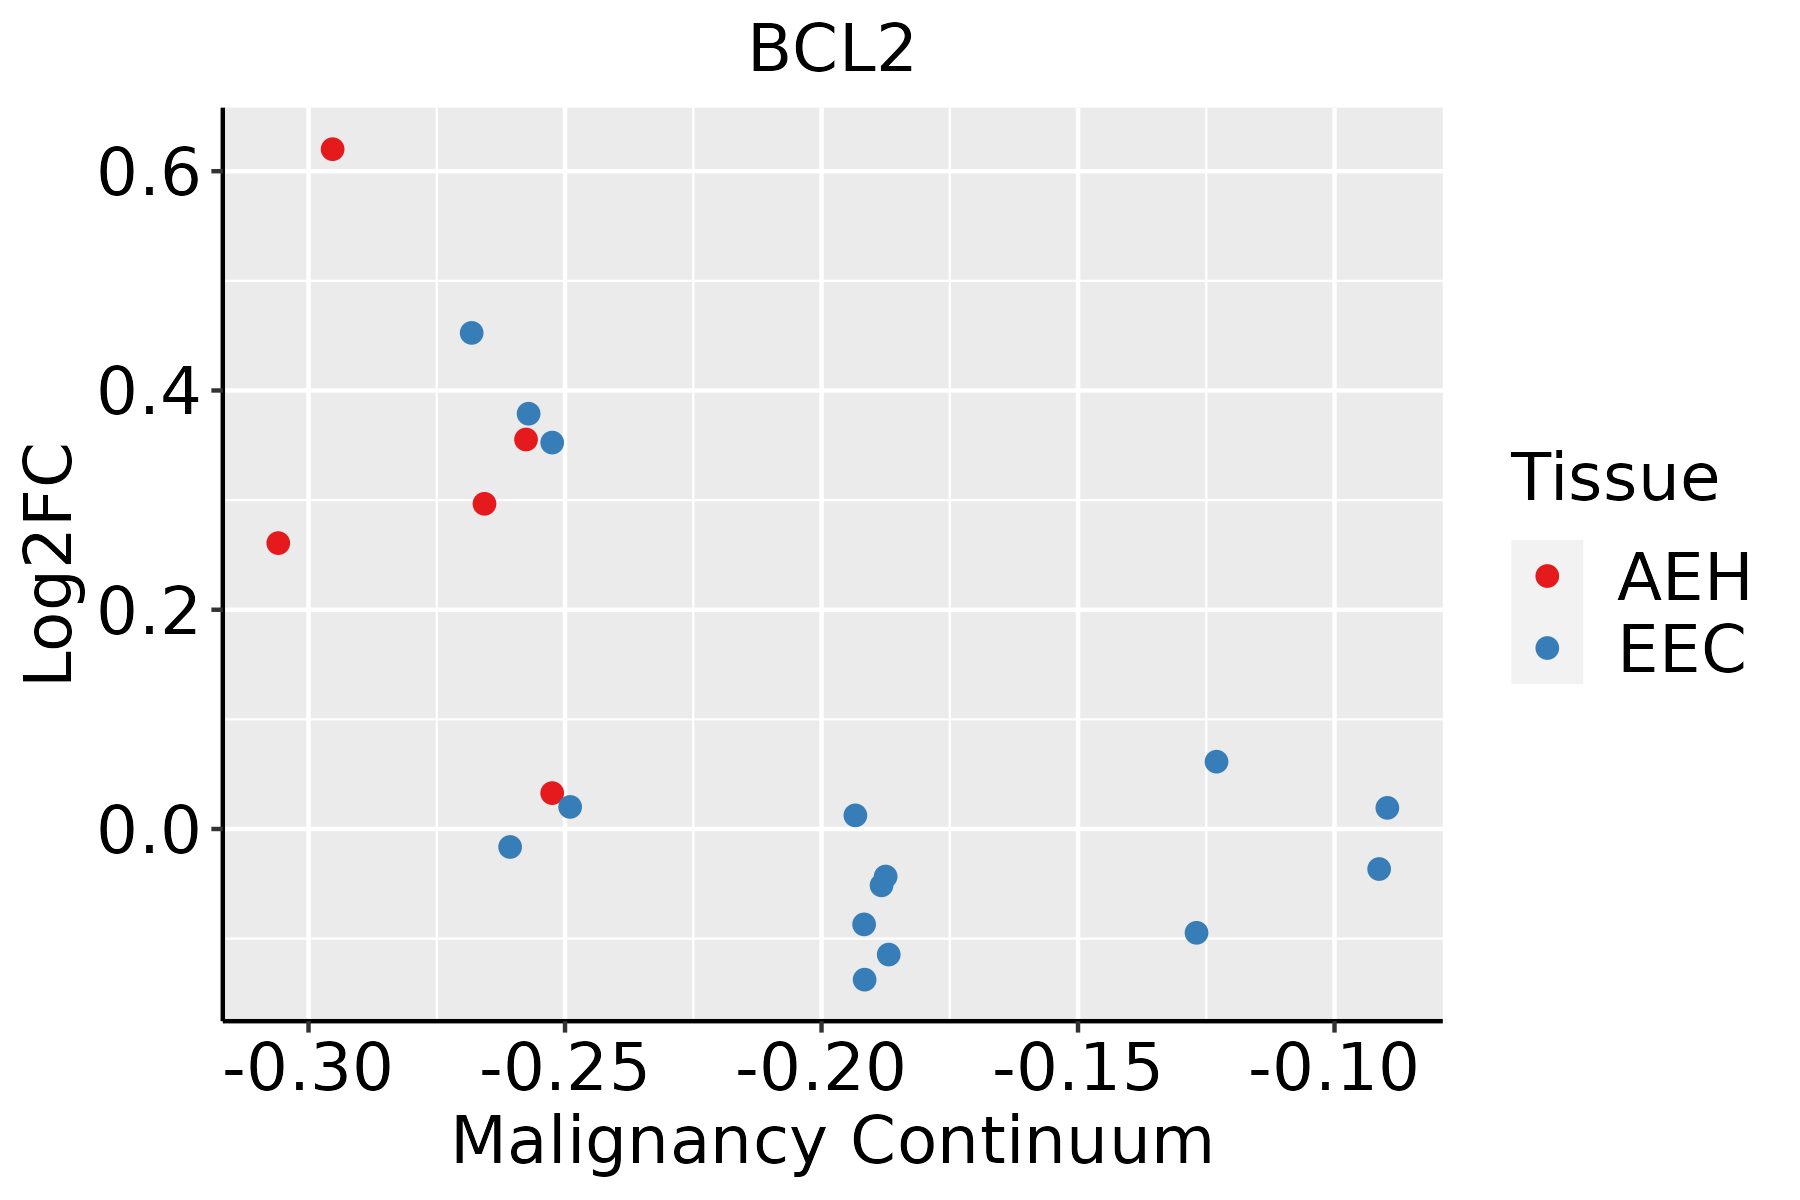 | AEH: Atypical endometrial hyperplasia |
| EEC: Endometrioid Cancer | ||
| Esophagus | 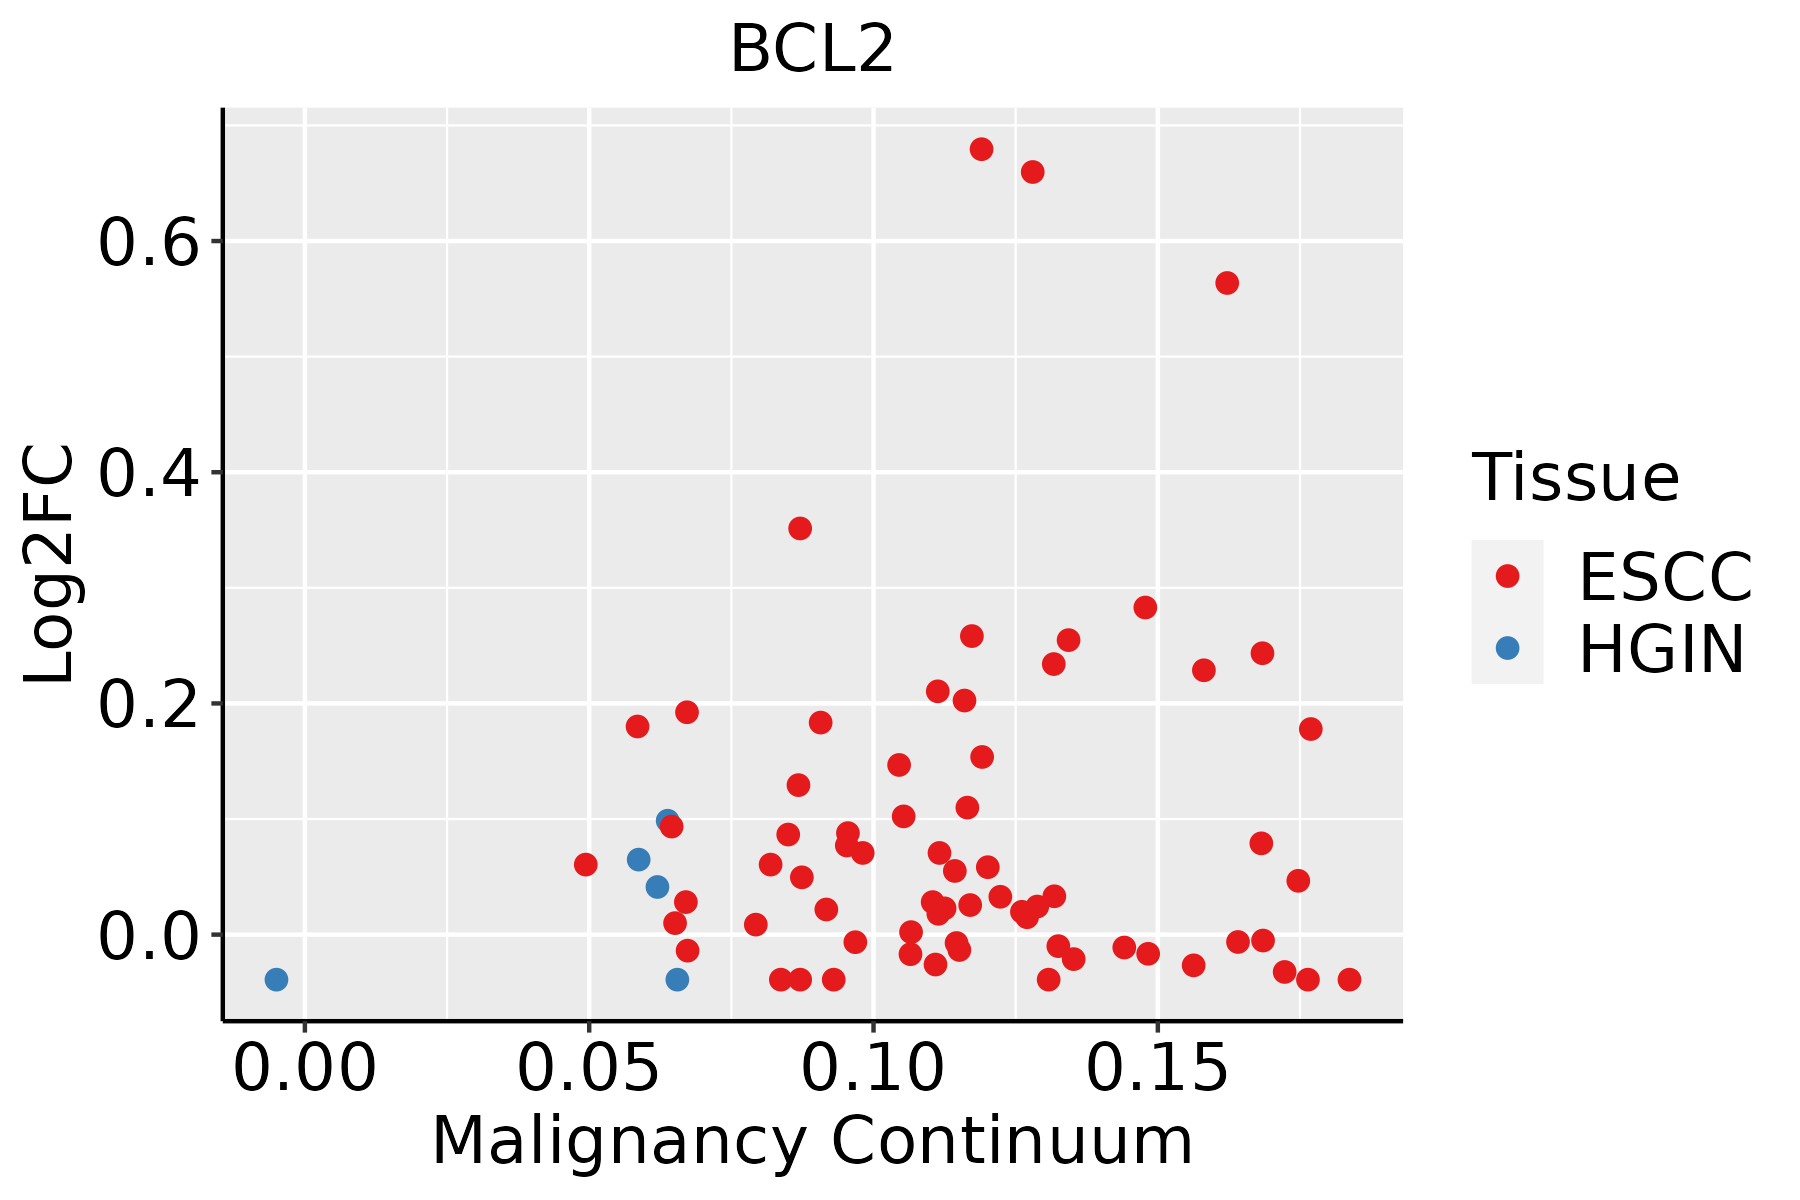 | ESCC: Esophageal squamous cell carcinoma |
| HGIN: High-grade intraepithelial neoplasias | ||
| LGIN: Low-grade intraepithelial neoplasias | ||
| Oral Cavity |  | EOLP: Erosive Oral lichen planus |
| LP: leukoplakia | ||
| NEOLP: Non-erosive oral lichen planus | ||
| OSCC: Oral squamous cell carcinoma | ||
| Prostate |  | BPH: Benign Prostatic Hyperplasia |
| Thyroid | 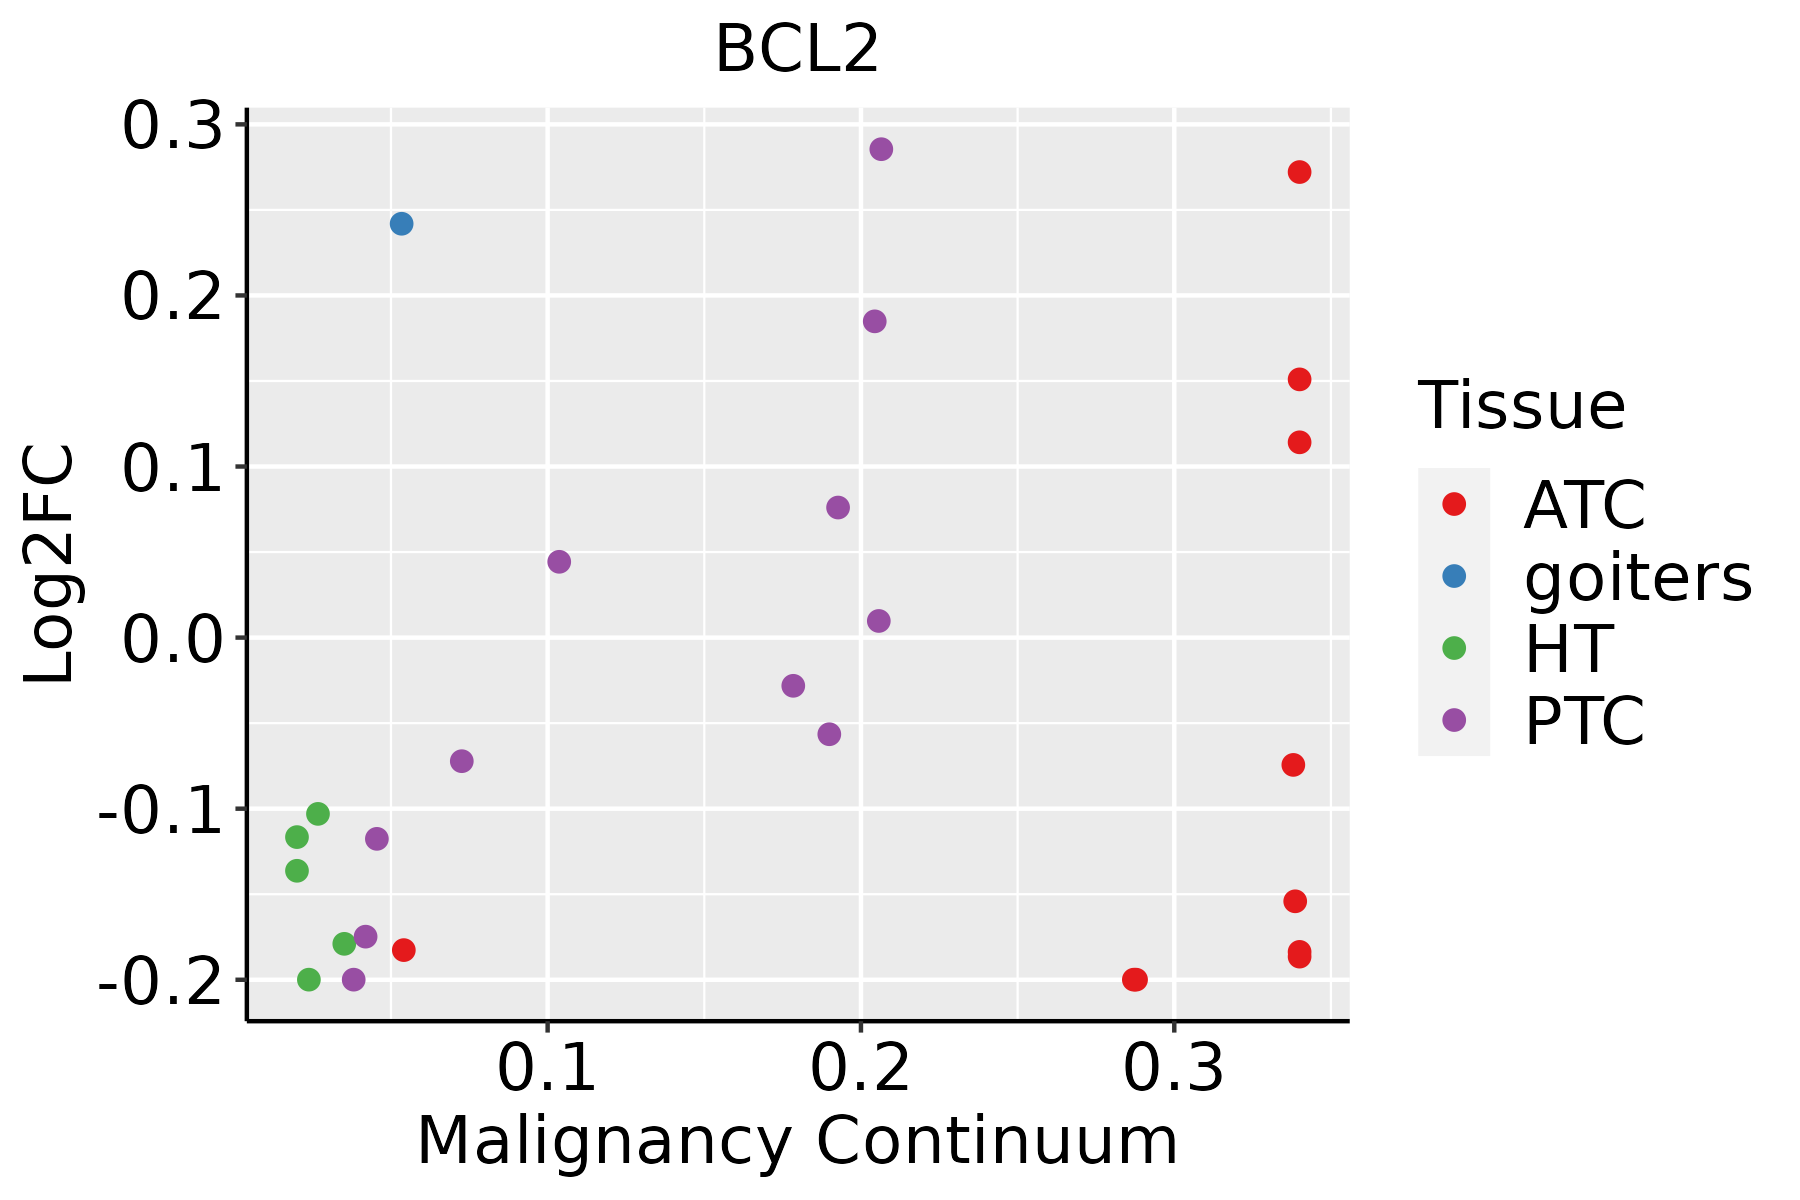 | ATC: Anaplastic thyroid cancer |
| HT: Hashimoto's thyroiditis | ||
| PTC: Papillary thyroid cancer |
| ∗log2FC in expression of this searched gene in stem-like cells from each diseased tissue sample relative to stem-like cells in normal samples in each tissue plotted against the malignancy continuum. Samples are colored based on if they are from different disease stage. |
Top |
Malignant transformation related pathway analysis |
| Find out the enriched GO biological processes and KEGG pathways involved in transition from healthy to precancer to cancer |
| Tissue | Disease Stage | Enriched GO biological Processes |
| Colorectum | AD |  |
| Colorectum | SER |  |
| Colorectum | MSS |  |
| Colorectum | MSI-H |  |
| Colorectum | FAP |  |
| ∗Top 15 enriched GO BP terms are showed in the bar plot of each disease state in each tissue. Each row represents a significant GO biological process which is colored according to the -log10(p.adjust). |
| Page: 1 2 3 4 5 6 7 8 9 |
| GO ID | Tissue | Disease Stage | Description | Gene Ratio | Bg Ratio | pvalue | p.adjust | Count |
| GO:190280711 | Prostate | Tumor | negative regulation of cell cycle G1/S phase transition | 28/3246 | 93/18723 | 1.70e-03 | 1.01e-02 | 28 |
| GO:190222915 | Prostate | Tumor | regulation of intrinsic apoptotic signaling pathway in response to DNA damage | 14/3246 | 36/18723 | 1.79e-03 | 1.05e-02 | 14 |
| GO:003009811 | Prostate | Tumor | lymphocyte differentiation | 87/3246 | 374/18723 | 1.93e-03 | 1.12e-02 | 87 |
| GO:00423031 | Prostate | Tumor | molting cycle | 31/3246 | 107/18723 | 1.97e-03 | 1.14e-02 | 31 |
| GO:00426331 | Prostate | Tumor | hair cycle | 31/3246 | 107/18723 | 1.97e-03 | 1.14e-02 | 31 |
| GO:200037715 | Prostate | Tumor | regulation of reactive oxygen species metabolic process | 42/3246 | 157/18723 | 2.02e-03 | 1.16e-02 | 42 |
| GO:000189416 | Prostate | Tumor | tissue homeostasis | 65/3246 | 268/18723 | 2.39e-03 | 1.35e-02 | 65 |
| GO:003803411 | Prostate | Tumor | signal transduction in absence of ligand | 21/3246 | 65/18723 | 2.40e-03 | 1.35e-02 | 21 |
| GO:009719211 | Prostate | Tumor | extrinsic apoptotic signaling pathway in absence of ligand | 21/3246 | 65/18723 | 2.40e-03 | 1.35e-02 | 21 |
| GO:004853811 | Prostate | Tumor | thymus development | 16/3246 | 45/18723 | 2.59e-03 | 1.43e-02 | 16 |
| GO:007200913 | Prostate | Tumor | nephron epithelium development | 31/3246 | 109/18723 | 2.70e-03 | 1.48e-02 | 31 |
| GO:190216516 | Prostate | Tumor | regulation of intrinsic apoptotic signaling pathway in response to DNA damage by p53 class mediator | 8/3246 | 16/18723 | 2.78e-03 | 1.51e-02 | 8 |
| GO:006024915 | Prostate | Tumor | anatomical structure homeostasis | 74/3246 | 314/18723 | 2.82e-03 | 1.54e-02 | 74 |
| GO:003526412 | Prostate | Tumor | multicellular organism growth | 36/3246 | 132/18723 | 2.85e-03 | 1.55e-02 | 36 |
| GO:004352315 | Prostate | Tumor | regulation of neuron apoptotic process | 53/3246 | 212/18723 | 2.92e-03 | 1.58e-02 | 53 |
| GO:004875411 | Prostate | Tumor | branching morphogenesis of an epithelial tube | 40/3246 | 151/18723 | 3.07e-03 | 1.63e-02 | 40 |
| GO:00148121 | Prostate | Tumor | muscle cell migration | 31/3246 | 110/18723 | 3.15e-03 | 1.65e-02 | 31 |
| GO:004663111 | Prostate | Tumor | alpha-beta T cell activation | 41/3246 | 156/18723 | 3.21e-03 | 1.68e-02 | 41 |
| GO:003027811 | Prostate | Tumor | regulation of ossification | 32/3246 | 115/18723 | 3.39e-03 | 1.75e-02 | 32 |
| GO:003368811 | Prostate | Tumor | regulation of osteoblast proliferation | 11/3246 | 27/18723 | 3.57e-03 | 1.84e-02 | 11 |
| Page: 1 2 3 4 5 6 7 8 9 10 11 12 13 14 15 16 17 18 19 20 21 22 23 24 25 26 27 28 29 30 31 32 33 34 35 36 37 38 39 40 41 42 43 44 45 46 47 48 49 50 51 52 53 54 55 56 57 58 59 60 61 62 63 64 65 66 67 68 69 70 71 72 73 74 75 76 77 78 79 80 81 82 83 84 85 86 87 88 89 90 91 92 93 94 95 96 97 98 99 100 101 102 103 104 105 106 107 108 109 110 111 112 113 114 115 116 117 118 119 120 121 122 123 124 125 126 127 128 129 130 131 132 133 134 135 136 137 138 139 140 141 142 143 144 145 146 147 148 149 150 151 152 153 154 155 156 157 158 159 160 161 162 163 164 165 166 167 168 169 170 |
| Pathway ID | Tissue | Disease Stage | Description | Gene Ratio | Bg Ratio | pvalue | p.adjust | qvalue | Count |
| hsa05014 | Colorectum | AD | Amyotrophic lateral sclerosis | 164/2092 | 364/8465 | 4.28e-18 | 1.27e-16 | 8.09e-17 | 164 |
| hsa05022 | Colorectum | AD | Pathways of neurodegeneration - multiple diseases | 201/2092 | 476/8465 | 4.54e-18 | 1.27e-16 | 8.09e-17 | 201 |
| hsa05131 | Colorectum | AD | Shigellosis | 109/2092 | 247/8465 | 1.09e-11 | 2.44e-10 | 1.55e-10 | 109 |
| hsa04141 | Colorectum | AD | Protein processing in endoplasmic reticulum | 80/2092 | 174/8465 | 5.96e-10 | 1.25e-08 | 7.96e-09 | 80 |
| hsa05132 | Colorectum | AD | Salmonella infection | 102/2092 | 249/8465 | 7.65e-09 | 1.28e-07 | 8.17e-08 | 102 |
| hsa04066 | Colorectum | AD | HIF-1 signaling pathway | 48/2092 | 109/8465 | 7.25e-06 | 7.84e-05 | 5.00e-05 | 48 |
| hsa04722 | Colorectum | AD | Neurotrophin signaling pathway | 50/2092 | 119/8465 | 2.28e-05 | 2.24e-04 | 1.43e-04 | 50 |
| hsa05418 | Colorectum | AD | Fluid shear stress and atherosclerosis | 54/2092 | 139/8465 | 1.41e-04 | 1.16e-03 | 7.37e-04 | 54 |
| hsa05210 | Colorectum | AD | Colorectal cancer | 35/2092 | 86/8465 | 7.54e-04 | 5.49e-03 | 3.50e-03 | 35 |
| hsa05417 | Colorectum | AD | Lipid and atherosclerosis | 73/2092 | 215/8465 | 1.31e-03 | 8.27e-03 | 5.27e-03 | 73 |
| hsa05170 | Colorectum | AD | Human immunodeficiency virus 1 infection | 72/2092 | 212/8465 | 1.40e-03 | 8.46e-03 | 5.39e-03 | 72 |
| hsa04510 | Colorectum | AD | Focal adhesion | 67/2092 | 203/8465 | 4.40e-03 | 2.17e-02 | 1.38e-02 | 67 |
| hsa04140 | Colorectum | AD | Autophagy - animal | 49/2092 | 141/8465 | 4.58e-03 | 2.20e-02 | 1.40e-02 | 49 |
| hsa04071 | Colorectum | AD | Sphingolipid signaling pathway | 43/2092 | 121/8465 | 4.83e-03 | 2.28e-02 | 1.45e-02 | 43 |
| hsa04928 | Colorectum | AD | Parathyroid hormone synthesis, secretion and action | 38/2092 | 106/8465 | 6.60e-03 | 2.77e-02 | 1.76e-02 | 38 |
| hsa01521 | Colorectum | AD | EGFR tyrosine kinase inhibitor resistance | 29/2092 | 79/8465 | 1.15e-02 | 4.24e-02 | 2.71e-02 | 29 |
| hsa050141 | Colorectum | AD | Amyotrophic lateral sclerosis | 164/2092 | 364/8465 | 4.28e-18 | 1.27e-16 | 8.09e-17 | 164 |
| hsa050221 | Colorectum | AD | Pathways of neurodegeneration - multiple diseases | 201/2092 | 476/8465 | 4.54e-18 | 1.27e-16 | 8.09e-17 | 201 |
| hsa051311 | Colorectum | AD | Shigellosis | 109/2092 | 247/8465 | 1.09e-11 | 2.44e-10 | 1.55e-10 | 109 |
| hsa041411 | Colorectum | AD | Protein processing in endoplasmic reticulum | 80/2092 | 174/8465 | 5.96e-10 | 1.25e-08 | 7.96e-09 | 80 |
| Page: 1 2 3 4 5 6 7 8 9 10 11 12 13 14 15 16 17 18 19 20 21 22 23 24 25 26 27 |
Top |
Cell-cell communication analysis |
| Identification of potential cell-cell interactions between two cell types and their ligand-receptor pairs for different disease states |
| Ligand | Receptor | LRpair | Pathway | Tissue | Disease Stage |
| Page: 1 |
Top |
Single-cell gene regulatory network inference analysis |
| Find out the significant the regulons (TFs) and the target genes of each regulon across cell types for different disease states |
| TF | Cell Type | Tissue | Disease Stage | Target Gene | RSS | Regulon Activity |
| ∗The dot plots of a searched regulon are shown for all cell subpopulations in each disease state of each tissue based on the regulon specific score inferred using pySCENIC and by calculating the average expression. |
| Page: 1 |
Top |
Somatic mutation of malignant transformation related genes |
| Annotation of somatic variants for genes involved in malignant transformation |
| Hugo Symbol | Variant Class | Variant Classification | dbSNP RS | HGVSc | HGVSp | HGVSp Short | SWISSPROT | BIOTYPE | SIFT | PolyPhen | Tumor Sample Barcode | Tissue | Histology | Sex | Age | Stage | Therapy Types | Drugs | Outcome |
| BCL2 | SNV | Missense_Mutation | novel | c.533N>A | p.Thr178Asn | p.T178N | P10415 | protein_coding | deleterious(0) | probably_damaging(0.997) | TCGA-2W-A8YY-01 | Cervix | cervical & endocervical cancer | Female | <65 | I/II | Chemotherapy | cisplatin | CR |
| BCL2 | SNV | Missense_Mutation | novel | c.5C>T | p.Ala2Val | p.A2V | P10415 | protein_coding | deleterious_low_confidence(0) | probably_damaging(0.986) | TCGA-AA-3949-01 | Colorectum | colon adenocarcinoma | Female | >=65 | III/IV | Unknown | Unknown | SD |
| BCL2 | SNV | Missense_Mutation | c.82N>C | p.Tyr28His | p.Y28H | P10415 | protein_coding | tolerated(0.12) | probably_damaging(0.995) | TCGA-EI-6882-01 | Colorectum | rectum adenocarcinoma | Male | <65 | I/II | Unknown | Unknown | SD | |
| BCL2 | SNV | Missense_Mutation | c.91G>A | p.Asp31Asn | p.D31N | P10415 | protein_coding | tolerated(0.16) | possibly_damaging(0.491) | TCGA-AX-A2HC-01 | Endometrium | uterine corpus endometrioid carcinoma | Female | <65 | III/IV | Chemotherapy | paclitaxel | PD | |
| BCL2 | SNV | Missense_Mutation | novel | c.622N>T | p.Pro208Ser | p.P208S | P10415 | protein_coding | tolerated(0.75) | benign(0.1) | TCGA-EY-A1GK-01 | Endometrium | uterine corpus endometrioid carcinoma | Female | >=65 | I/II | Unknown | Unknown | SD |
| BCL2 | SNV | Missense_Mutation | novel | c.101A>G | p.Asp34Gly | p.D34G | P10415 | protein_coding | tolerated(0.09) | benign(0.001) | TCGA-FI-A2D5-01 | Endometrium | uterine corpus endometrioid carcinoma | Female | <65 | III/IV | Chemotherapy | carboplatinum | PD |
| BCL2 | SNV | Missense_Mutation | c.50A>T | p.Lys17Met | p.K17M | P10415 | protein_coding | deleterious(0) | probably_damaging(0.992) | TCGA-44-7670-01 | Lung | lung adenocarcinoma | Female | <65 | I/II | Chemotherapy | docetaxel | SD | |
| BCL2 | SNV | Missense_Mutation | c.345N>A | p.Met115Ile | p.M115I | P10415 | protein_coding | tolerated(0.05) | benign(0.442) | TCGA-55-6969-01 | Lung | lung adenocarcinoma | Male | <65 | I/II | Unknown | Unknown | SD | |
| BCL2 | SNV | Missense_Mutation | c.10G>C | p.Ala4Pro | p.A4P | P10415 | protein_coding | tolerated(0.47) | benign(0.013) | TCGA-67-3774-01 | Lung | lung adenocarcinoma | Female | >=65 | I/II | Unknown | Unknown | SD | |
| BCL2 | SNV | Missense_Mutation | c.642N>T | p.Trp214Cys | p.W214C | P10415 | protein_coding | deleterious(0) | probably_damaging(0.921) | TCGA-91-A4BC-01 | Lung | lung adenocarcinoma | Male | <65 | I/II | Unknown | Unknown | SD |
| Page: 1 2 |
Top |
Related drugs of malignant transformation related genes |
| Identification of chemicals and drugs interact with genes involved in malignant transfromation |
| (DGIdb 4.0) |
| Entrez ID | Symbol | Category | Interaction Types | Drug Claim Name | Drug Name | PMIDs |
| 596 | BCL2 | CLINICALLY ACTIONABLE, DRUGGABLE GENOME, DRUG RESISTANCE | HYDROQUINONE | HYDROQUINONE | 10220568 | |
| 596 | BCL2 | CLINICALLY ACTIONABLE, DRUGGABLE GENOME, DRUG RESISTANCE | PENTOXIFYLLINE | PENTOXIFYLLINE | 11836847 | |
| 596 | BCL2 | CLINICALLY ACTIONABLE, DRUGGABLE GENOME, DRUG RESISTANCE | ENDOTHELIN RECEPTOR ANTAGONIST | 16741044 | ||
| 596 | BCL2 | CLINICALLY ACTIONABLE, DRUGGABLE GENOME, DRUG RESISTANCE | FAS LIGAND | 10432288 | ||
| 596 | BCL2 | CLINICALLY ACTIONABLE, DRUGGABLE GENOME, DRUG RESISTANCE | Indole-based analog 3 | |||
| 596 | BCL2 | CLINICALLY ACTIONABLE, DRUGGABLE GENOME, DRUG RESISTANCE | SELENIUM | 12168721,15485790 | ||
| 596 | BCL2 | CLINICALLY ACTIONABLE, DRUGGABLE GENOME, DRUG RESISTANCE | ERYTHROMYCIN | ERYTHROMYCIN | 17007374 | |
| 596 | BCL2 | CLINICALLY ACTIONABLE, DRUGGABLE GENOME, DRUG RESISTANCE | DES | DIETHYLSTILBESTROL | 15545218 | |
| 596 | BCL2 | CLINICALLY ACTIONABLE, DRUGGABLE GENOME, DRUG RESISTANCE | TAZAROTENE | TAZAROTENE | 16109552 | |
| 596 | BCL2 | CLINICALLY ACTIONABLE, DRUGGABLE GENOME, DRUG RESISTANCE | DOLASTATIN 10 | 9615758 |
| Page: 1 2 3 4 5 6 7 8 9 10 11 12 |

Copyright 2023-Present -The University of Texas Health Science Center at Houston |