
|
|||||
|
 | |
| |
| |
| |
| |
| |
|
Gene: ZWINT |
Gene summary for ZWINT |
| Gene information | Species | Human | Gene symbol | ZWINT | Gene ID | 11130 |
| Gene name | ZW10 interacting kinetochore protein | |
| Gene Alias | HZwint-1 | |
| Cytomap | 10q21.1 | |
| Gene Type | protein-coding | GO ID | GO:0000070 | UniProtAcc | O95229 |
Top |
Malignant transformation analysis |
| Identification of the aberrant gene expression in precancerous and cancerous lesions by comparing the gene expression of stem-like cells in diseased tissues with normal stem cells |
| Entrez ID | Symbol | Replicates | Species | Organ | Tissue | Adj P-value | Log2FC | Malignancy |
| 11130 | ZWINT | LZE5T | Human | Esophagus | ESCC | 1.57e-02 | 3.52e-01 | 0.0514 |
| 11130 | ZWINT | LZE7T | Human | Esophagus | ESCC | 1.02e-03 | 2.73e-01 | 0.0667 |
| 11130 | ZWINT | LZE21T | Human | Esophagus | ESCC | 1.16e-05 | 2.66e-01 | 0.0655 |
| 11130 | ZWINT | LZE6T | Human | Esophagus | ESCC | 5.35e-04 | 2.56e-01 | 0.0845 |
| 11130 | ZWINT | P1T-E | Human | Esophagus | ESCC | 4.62e-03 | 2.49e-01 | 0.0875 |
| 11130 | ZWINT | P2T-E | Human | Esophagus | ESCC | 3.73e-18 | 5.64e-01 | 0.1177 |
| 11130 | ZWINT | P4T-E | Human | Esophagus | ESCC | 4.13e-17 | 4.16e-01 | 0.1323 |
| 11130 | ZWINT | P5T-E | Human | Esophagus | ESCC | 1.81e-22 | 6.06e-01 | 0.1327 |
| 11130 | ZWINT | P8T-E | Human | Esophagus | ESCC | 7.33e-10 | 4.32e-01 | 0.0889 |
| 11130 | ZWINT | P9T-E | Human | Esophagus | ESCC | 4.01e-04 | 1.78e-01 | 0.1131 |
| 11130 | ZWINT | P10T-E | Human | Esophagus | ESCC | 1.14e-05 | 2.74e-01 | 0.116 |
| 11130 | ZWINT | P11T-E | Human | Esophagus | ESCC | 9.07e-04 | 2.70e-01 | 0.1426 |
| 11130 | ZWINT | P15T-E | Human | Esophagus | ESCC | 5.37e-05 | 2.09e-01 | 0.1149 |
| 11130 | ZWINT | P16T-E | Human | Esophagus | ESCC | 7.38e-11 | 4.36e-01 | 0.1153 |
| 11130 | ZWINT | P17T-E | Human | Esophagus | ESCC | 2.60e-06 | 3.04e-01 | 0.1278 |
| 11130 | ZWINT | P21T-E | Human | Esophagus | ESCC | 6.36e-12 | 5.68e-01 | 0.1617 |
| 11130 | ZWINT | P24T-E | Human | Esophagus | ESCC | 4.42e-13 | 3.16e-01 | 0.1287 |
| 11130 | ZWINT | P26T-E | Human | Esophagus | ESCC | 6.70e-08 | 4.08e-01 | 0.1276 |
| 11130 | ZWINT | P27T-E | Human | Esophagus | ESCC | 1.34e-11 | 3.80e-01 | 0.1055 |
| 11130 | ZWINT | P28T-E | Human | Esophagus | ESCC | 3.08e-07 | 2.17e-01 | 0.1149 |
| Page: 1 2 3 4 5 |
| Tissue | Expression Dynamics | Abbreviation |
| Esophagus |  | ESCC: Esophageal squamous cell carcinoma |
| HGIN: High-grade intraepithelial neoplasias | ||
| LGIN: Low-grade intraepithelial neoplasias | ||
| Liver | 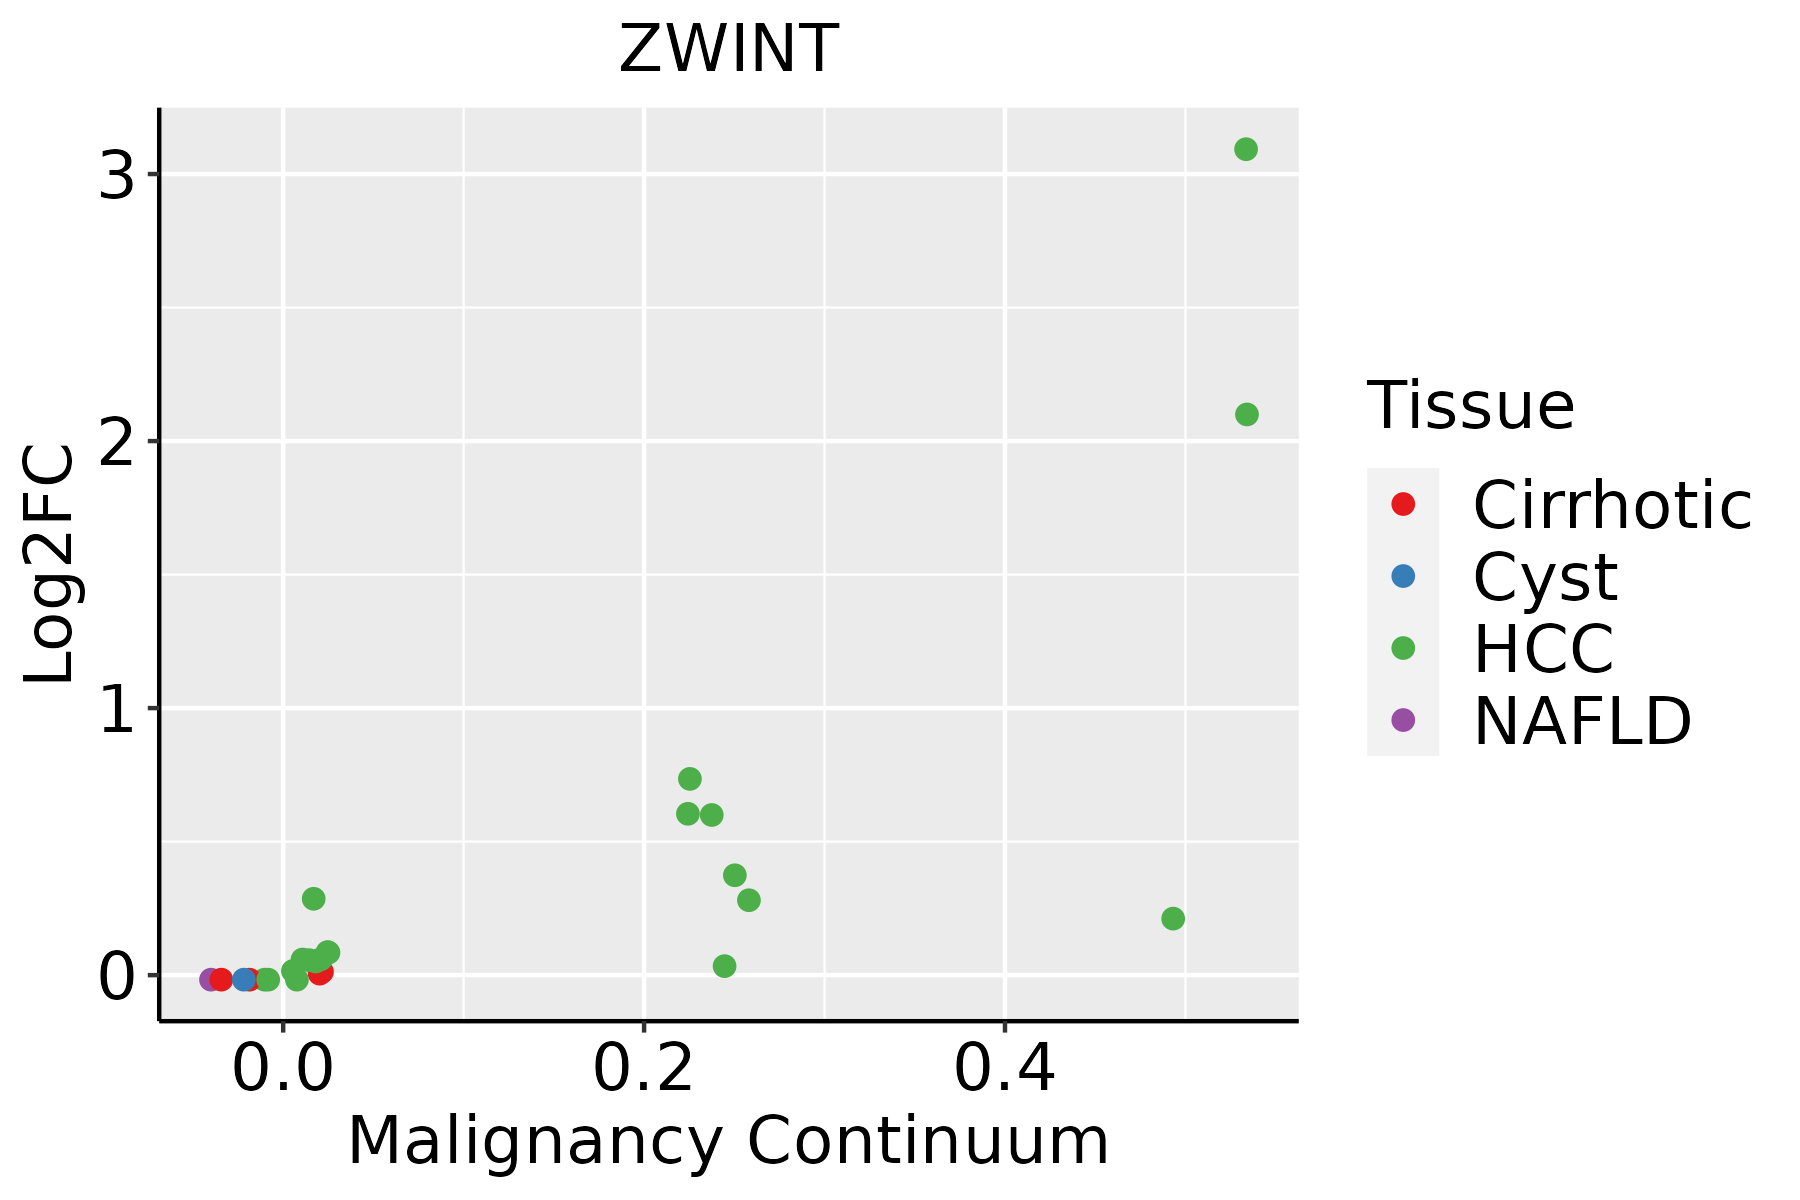 | HCC: Hepatocellular carcinoma |
| NAFLD: Non-alcoholic fatty liver disease | ||
| Oral Cavity |  | EOLP: Erosive Oral lichen planus |
| LP: leukoplakia | ||
| NEOLP: Non-erosive oral lichen planus | ||
| OSCC: Oral squamous cell carcinoma | ||
| Skin | 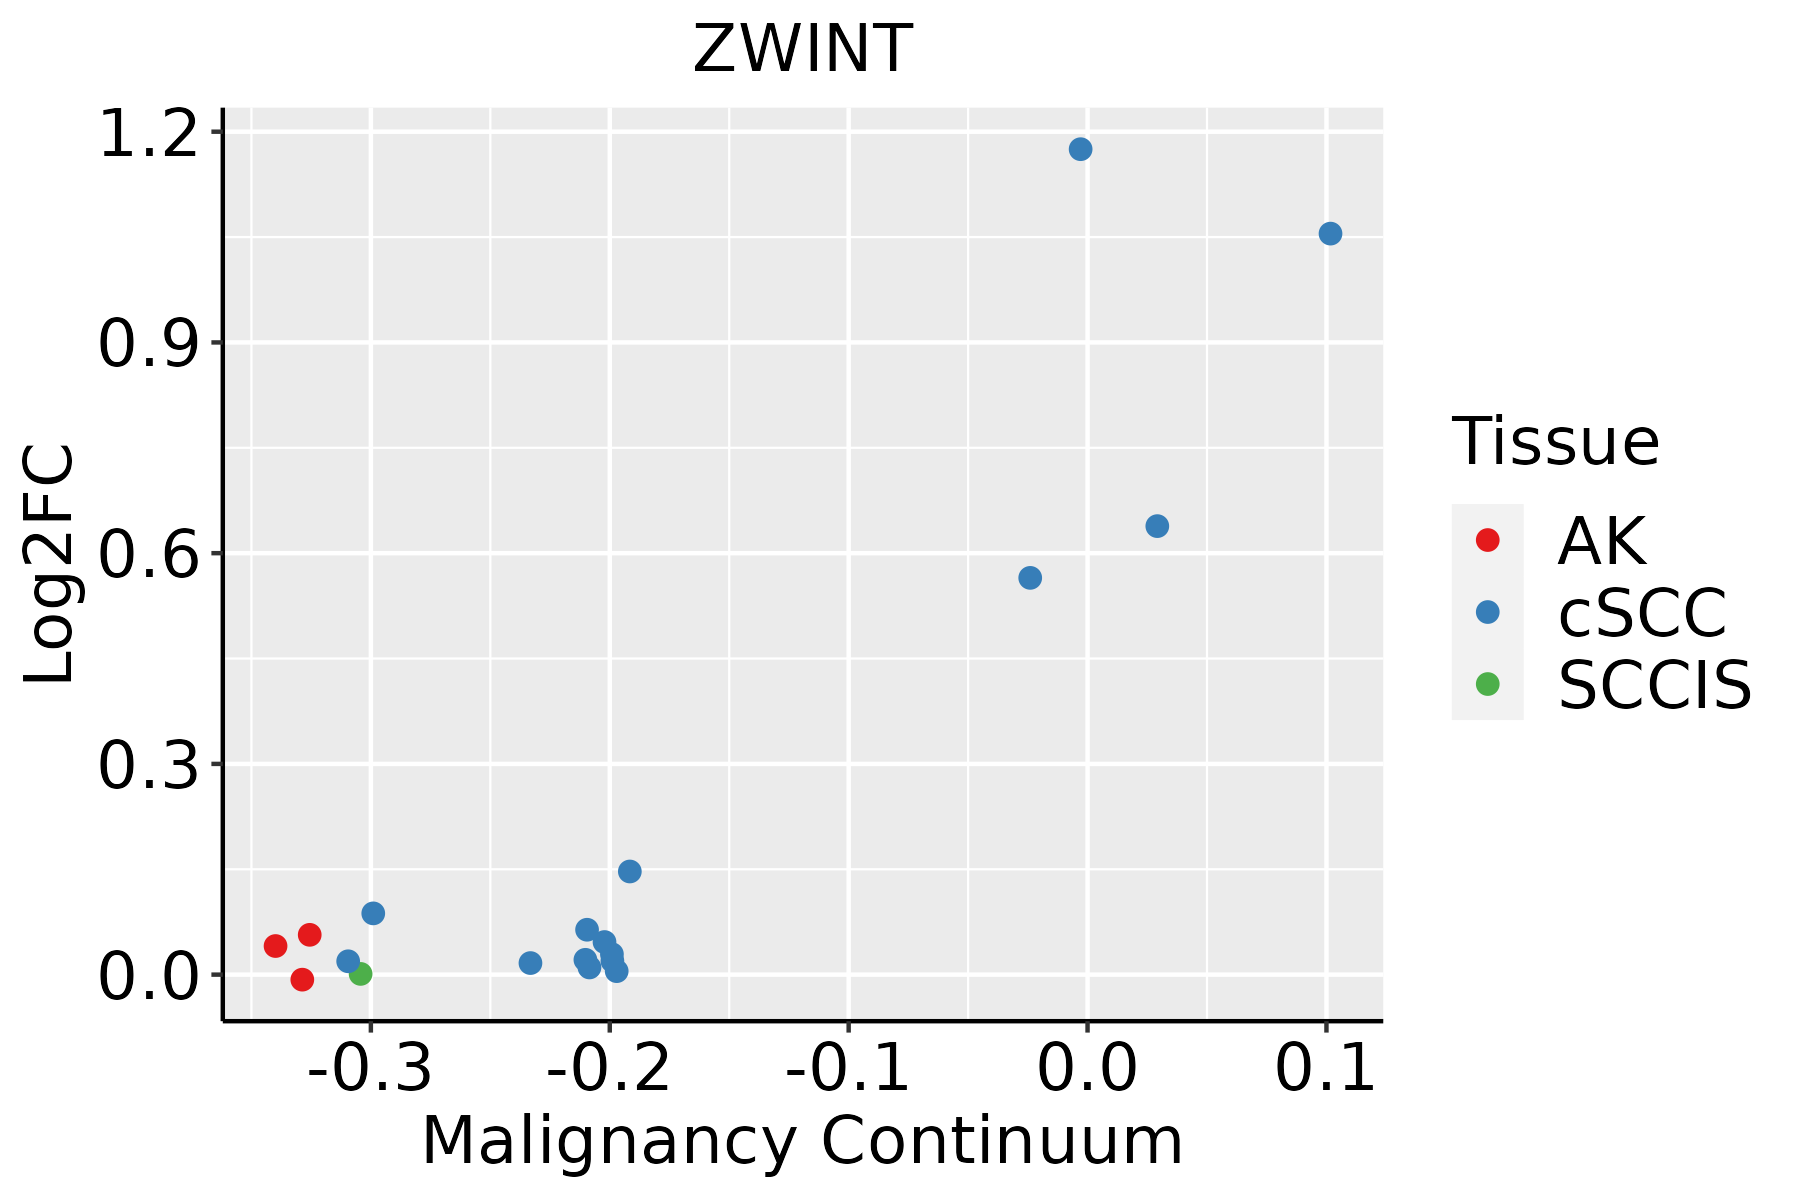 | AK: Actinic keratosis |
| cSCC: Cutaneous squamous cell carcinoma | ||
| SCCIS:squamous cell carcinoma in situ | ||
| Thyroid |  | ATC: Anaplastic thyroid cancer |
| HT: Hashimoto's thyroiditis | ||
| PTC: Papillary thyroid cancer |
| ∗log2FC in expression of this searched gene in stem-like cells from each diseased tissue sample relative to stem-like cells in normal samples in each tissue plotted against the malignancy continuum. Samples are colored based on if they are from different disease stage. |
Top |
Malignant transformation related pathway analysis |
| Find out the enriched GO biological processes and KEGG pathways involved in transition from healthy to precancer to cancer |
| Tissue | Disease Stage | Enriched GO biological Processes |
| Colorectum | AD |  |
| Colorectum | SER |  |
| Colorectum | MSS |  |
| Colorectum | MSI-H |  |
| Colorectum | FAP |  |
| ∗Top 15 enriched GO BP terms are showed in the bar plot of each disease state in each tissue. Each row represents a significant GO biological process which is colored according to the -log10(p.adjust). |
| Page: 1 2 3 4 5 6 7 8 9 |
| GO ID | Tissue | Disease Stage | Description | Gene Ratio | Bg Ratio | pvalue | p.adjust | Count |
| GO:005178411 | Thyroid | ATC | negative regulation of nuclear division | 37/6293 | 56/18723 | 6.82e-07 | 9.30e-06 | 37 |
| GO:00330464 | Thyroid | ATC | negative regulation of sister chromatid segregation | 30/6293 | 43/18723 | 1.36e-06 | 1.71e-05 | 30 |
| GO:00330484 | Thyroid | ATC | negative regulation of mitotic sister chromatid segregation | 30/6293 | 43/18723 | 1.36e-06 | 1.71e-05 | 30 |
| GO:20008164 | Thyroid | ATC | negative regulation of mitotic sister chromatid separation | 30/6293 | 43/18723 | 1.36e-06 | 1.71e-05 | 30 |
| GO:00513044 | Thyroid | ATC | chromosome separation | 55/6293 | 96/18723 | 1.58e-06 | 1.93e-05 | 55 |
| GO:000709312 | Thyroid | ATC | mitotic cell cycle checkpoint | 69/6293 | 129/18723 | 2.52e-06 | 2.96e-05 | 69 |
| GO:00070944 | Thyroid | ATC | mitotic spindle assembly checkpoint | 27/6293 | 38/18723 | 2.64e-06 | 3.06e-05 | 27 |
| GO:00711734 | Thyroid | ATC | spindle assembly checkpoint | 27/6293 | 38/18723 | 2.64e-06 | 3.06e-05 | 27 |
| GO:00711744 | Thyroid | ATC | mitotic spindle checkpoint | 27/6293 | 38/18723 | 2.64e-06 | 3.06e-05 | 27 |
| GO:19021004 | Thyroid | ATC | negative regulation of metaphase/anaphase transition of cell cycle | 29/6293 | 42/18723 | 2.85e-06 | 3.27e-05 | 29 |
| GO:00315774 | Thyroid | ATC | spindle checkpoint | 27/6293 | 39/18723 | 5.83e-06 | 6.16e-05 | 27 |
| GO:00519854 | Thyroid | ATC | negative regulation of chromosome segregation | 30/6293 | 45/18723 | 5.89e-06 | 6.18e-05 | 30 |
| GO:19058194 | Thyroid | ATC | negative regulation of chromosome separation | 30/6293 | 45/18723 | 5.89e-06 | 6.18e-05 | 30 |
| GO:000007513 | Thyroid | ATC | cell cycle checkpoint | 84/6293 | 169/18723 | 1.05e-05 | 1.04e-04 | 84 |
| GO:001094813 | Thyroid | ATC | negative regulation of cell cycle process | 134/6293 | 294/18723 | 1.19e-05 | 1.15e-04 | 134 |
| GO:190198813 | Thyroid | ATC | negative regulation of cell cycle phase transition | 116/6293 | 249/18723 | 1.33e-05 | 1.27e-04 | 116 |
| Page: 1 2 3 4 5 6 7 8 9 10 11 12 13 |
| Pathway ID | Tissue | Disease Stage | Description | Gene Ratio | Bg Ratio | pvalue | p.adjust | qvalue | Count |
| Page: 1 |
Top |
Cell-cell communication analysis |
| Identification of potential cell-cell interactions between two cell types and their ligand-receptor pairs for different disease states |
| Ligand | Receptor | LRpair | Pathway | Tissue | Disease Stage |
| Page: 1 |
Top |
Single-cell gene regulatory network inference analysis |
| Find out the significant the regulons (TFs) and the target genes of each regulon across cell types for different disease states |
| TF | Cell Type | Tissue | Disease Stage | Target Gene | RSS | Regulon Activity |
| ∗The dot plots of a searched regulon are shown for all cell subpopulations in each disease state of each tissue based on the regulon specific score inferred using pySCENIC and by calculating the average expression. |
| Page: 1 |
Top |
Somatic mutation of malignant transformation related genes |
| Annotation of somatic variants for genes involved in malignant transformation |
| Hugo Symbol | Variant Class | Variant Classification | dbSNP RS | HGVSc | HGVSp | HGVSp Short | SWISSPROT | BIOTYPE | SIFT | PolyPhen | Tumor Sample Barcode | Tissue | Histology | Sex | Age | Stage | Therapy Types | Drugs | Outcome |
| ZWINT | SNV | Missense_Mutation | c.452N>A | p.Ala151Glu | p.A151E | O95229 | protein_coding | tolerated(0.32) | benign(0.003) | TCGA-A8-A094-01 | Breast | breast invasive carcinoma | Female | >=65 | I/II | Unknown | Unknown | SD | |
| ZWINT | SNV | Missense_Mutation | novel | c.773A>G | p.Asp258Gly | p.D258G | O95229 | protein_coding | deleterious_low_confidence(0.01) | benign(0.217) | TCGA-B6-A0RE-01 | Breast | breast invasive carcinoma | Female | <65 | I/II | Unknown | Unknown | SD |
| ZWINT | SNV | Missense_Mutation | rs758501648 | c.52N>A | p.Glu18Lys | p.E18K | O95229 | protein_coding | tolerated(0.29) | benign(0.006) | TCGA-BH-A0HP-01 | Breast | breast invasive carcinoma | Female | >=65 | III/IV | Chemotherapy | doxorubicin | SD |
| ZWINT | SNV | Missense_Mutation | c.556N>C | p.Asp186His | p.D186H | O95229 | protein_coding | deleterious(0) | possibly_damaging(0.471) | TCGA-E2-A1IN-01 | Breast | breast invasive carcinoma | Female | <65 | I/II | Hormone Therapy | arimidex | SD | |
| ZWINT | SNV | Missense_Mutation | novel | c.266C>A | p.Ala89Glu | p.A89E | O95229 | protein_coding | deleterious(0.01) | probably_damaging(0.944) | TCGA-E9-A295-01 | Breast | breast invasive carcinoma | Female | >=65 | I/II | Hormone Therapy | tamoxiphen | SD |
| ZWINT | insertion | Nonsense_Mutation | novel | c.326_327insTTGGTCTTTCTCCCTTGCTTATCTGTAGAAACAAATG | p.Ile110TrpfsTer9 | p.I110Wfs*9 | O95229 | protein_coding | TCGA-A7-A0CJ-01 | Breast | breast invasive carcinoma | Female | <65 | I/II | Chemotherapy | cytoxan | SD | ||
| ZWINT | insertion | Frame_Shift_Ins | novel | c.589_590insCTGGTTTACCTCTCTCTGCATCTGAGCTCTGCTC | p.Gln197ProfsTer37 | p.Q197Pfs*37 | O95229 | protein_coding | TCGA-A8-A07J-01 | Breast | breast invasive carcinoma | Female | <65 | I/II | Chemotherapy | 5-fluorouracil | CR | ||
| ZWINT | insertion | In_Frame_Ins | novel | c.697_698insTCA | p.Glu233delinsValLys | p.E233delinsVK | O95229 | protein_coding | TCGA-A8-A09D-01 | Breast | breast invasive carcinoma | Female | <65 | I/II | Chemotherapy | doxorubicin | CR | ||
| ZWINT | insertion | Nonsense_Mutation | novel | c.696_697insCATTTGTCTTTATGATTTTCTAGTTGT | p.Ala232_Glu233insHisLeuSerLeuTerPheSerSerCys | p.A232_E233insHLSL*FSSC | O95229 | protein_coding | TCGA-A8-A09D-01 | Breast | breast invasive carcinoma | Female | <65 | I/II | Chemotherapy | doxorubicin | CR | ||
| ZWINT | SNV | Missense_Mutation | c.757N>A | p.Asp253Asn | p.D253N | O95229 | protein_coding | deleterious_low_confidence(0.02) | benign(0.066) | TCGA-FU-A5XV-01 | Cervix | cervical & endocervical cancer | Female | <65 | III/IV | Unknown | Unknown | SD |
| Page: 1 2 3 4 5 6 |
Top |
Related drugs of malignant transformation related genes |
| Identification of chemicals and drugs interact with genes involved in malignant transfromation |
| (DGIdb 4.0) |
| Entrez ID | Symbol | Category | Interaction Types | Drug Claim Name | Drug Name | PMIDs |
| Page: 1 |

Copyright 2023-Present -The University of Texas Health Science Center at Houston |