
|
|||||
|
 | |
| |
| |
| |
| |
| |
|
Gene: ZNF7 |
Gene summary for ZNF7 |
| Gene information | Species | Human | Gene symbol | ZNF7 | Gene ID | 7553 |
| Gene name | zinc finger protein 7 | |
| Gene Alias | HF.16 | |
| Cytomap | 8q24.3 | |
| Gene Type | protein-coding | GO ID | GO:0006139 | UniProtAcc | P17097 |
Top |
Malignant transformation analysis |
| Identification of the aberrant gene expression in precancerous and cancerous lesions by comparing the gene expression of stem-like cells in diseased tissues with normal stem cells |
| Entrez ID | Symbol | Replicates | Species | Organ | Tissue | Adj P-value | Log2FC | Malignancy |
| 7553 | ZNF7 | LZE4T | Human | Esophagus | ESCC | 1.48e-10 | 2.21e-01 | 0.0811 |
| 7553 | ZNF7 | LZE8T | Human | Esophagus | ESCC | 2.48e-04 | 1.47e-01 | 0.067 |
| 7553 | ZNF7 | LZE20T | Human | Esophagus | ESCC | 4.14e-02 | 1.44e-01 | 0.0662 |
| 7553 | ZNF7 | LZE24T | Human | Esophagus | ESCC | 6.53e-12 | 2.92e-01 | 0.0596 |
| 7553 | ZNF7 | P1T-E | Human | Esophagus | ESCC | 1.36e-07 | 3.00e-01 | 0.0875 |
| 7553 | ZNF7 | P2T-E | Human | Esophagus | ESCC | 3.50e-17 | 3.55e-01 | 0.1177 |
| 7553 | ZNF7 | P4T-E | Human | Esophagus | ESCC | 2.71e-14 | 3.38e-01 | 0.1323 |
| 7553 | ZNF7 | P5T-E | Human | Esophagus | ESCC | 1.05e-17 | 2.77e-01 | 0.1327 |
| 7553 | ZNF7 | P8T-E | Human | Esophagus | ESCC | 2.17e-16 | 2.24e-01 | 0.0889 |
| 7553 | ZNF7 | P9T-E | Human | Esophagus | ESCC | 8.50e-11 | 2.83e-01 | 0.1131 |
| 7553 | ZNF7 | P10T-E | Human | Esophagus | ESCC | 9.85e-17 | 3.63e-01 | 0.116 |
| 7553 | ZNF7 | P11T-E | Human | Esophagus | ESCC | 4.21e-18 | 5.88e-01 | 0.1426 |
| 7553 | ZNF7 | P12T-E | Human | Esophagus | ESCC | 3.45e-31 | 5.73e-01 | 0.1122 |
| 7553 | ZNF7 | P15T-E | Human | Esophagus | ESCC | 1.61e-18 | 4.03e-01 | 0.1149 |
| 7553 | ZNF7 | P16T-E | Human | Esophagus | ESCC | 2.07e-48 | 7.68e-01 | 0.1153 |
| 7553 | ZNF7 | P17T-E | Human | Esophagus | ESCC | 2.63e-06 | 2.98e-01 | 0.1278 |
| 7553 | ZNF7 | P20T-E | Human | Esophagus | ESCC | 1.35e-15 | 2.88e-01 | 0.1124 |
| 7553 | ZNF7 | P21T-E | Human | Esophagus | ESCC | 3.22e-20 | 3.98e-01 | 0.1617 |
| 7553 | ZNF7 | P22T-E | Human | Esophagus | ESCC | 1.40e-09 | 2.37e-01 | 0.1236 |
| 7553 | ZNF7 | P23T-E | Human | Esophagus | ESCC | 2.13e-21 | 4.84e-01 | 0.108 |
| Page: 1 2 3 4 5 |
| Tissue | Expression Dynamics | Abbreviation |
| Esophagus | 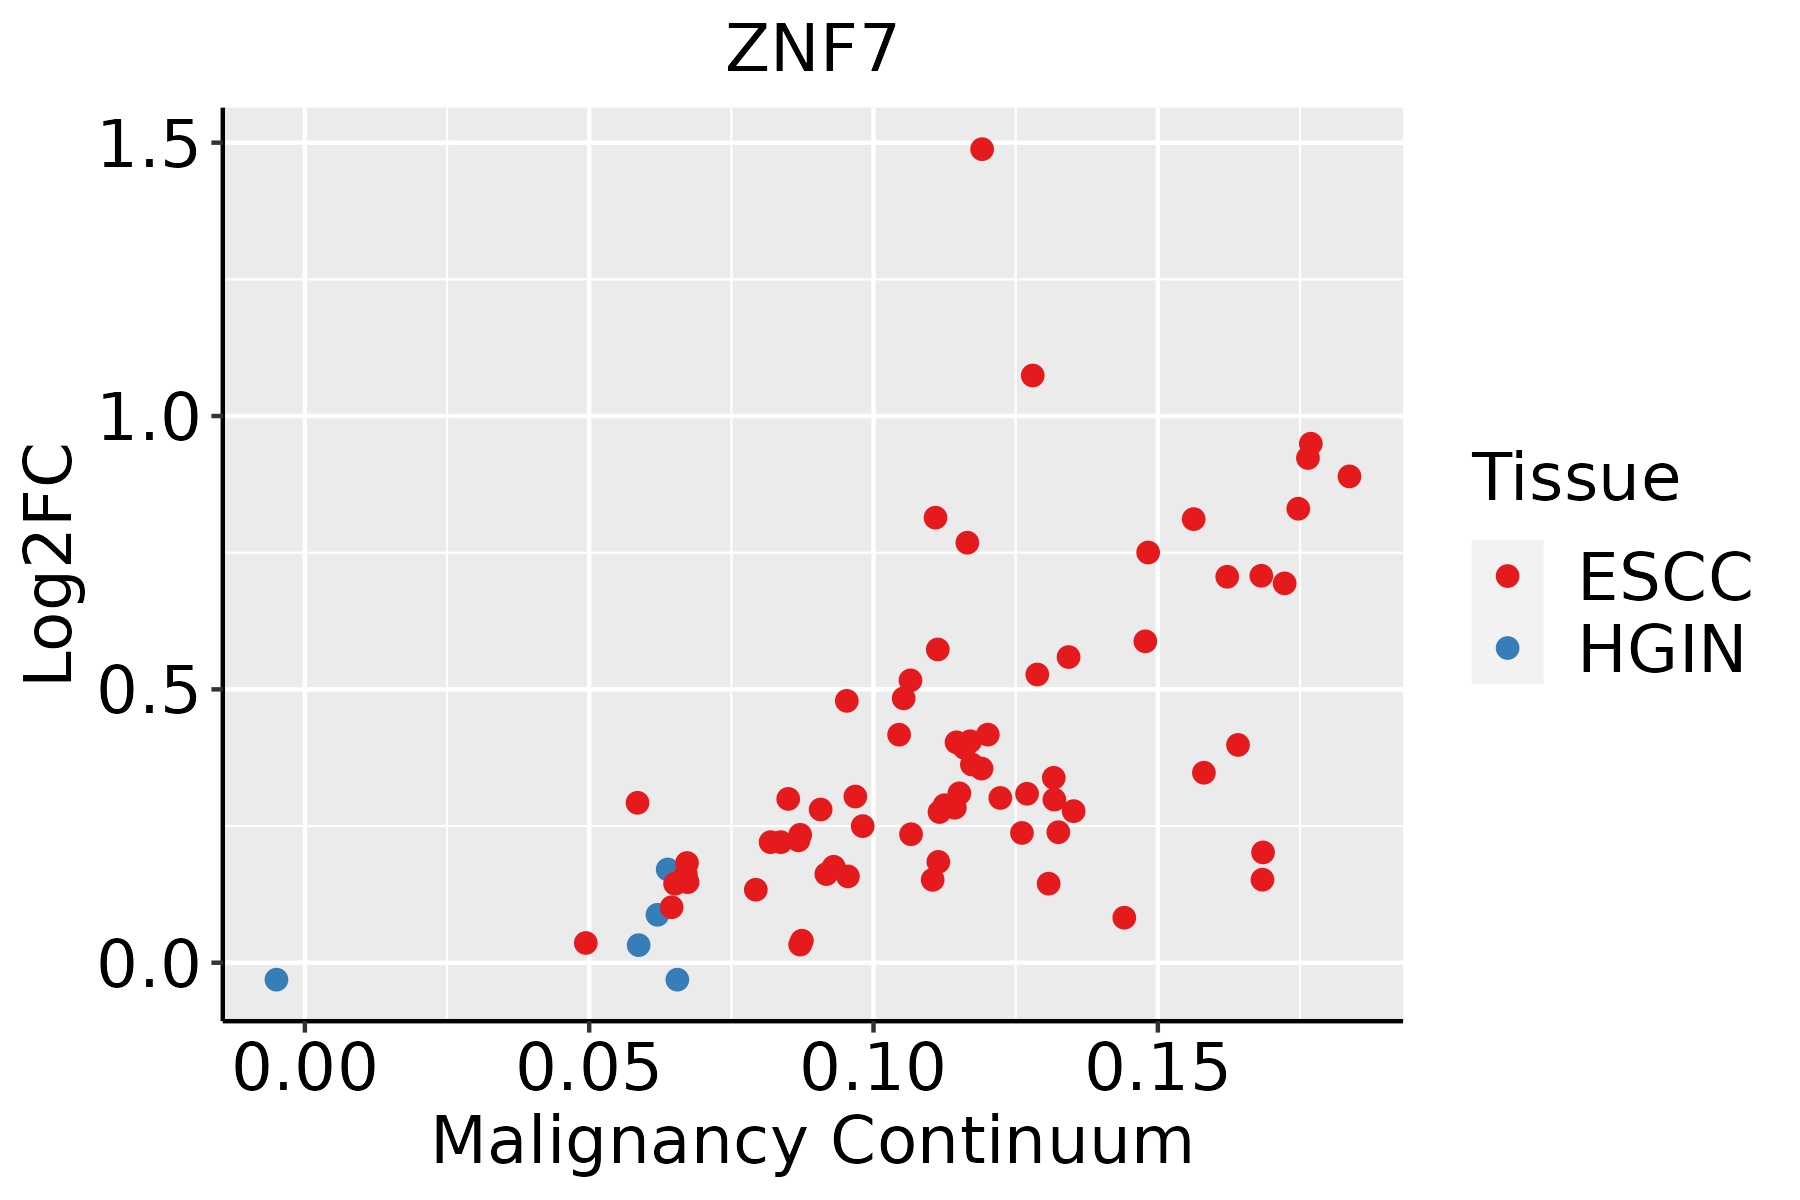 | ESCC: Esophageal squamous cell carcinoma |
| HGIN: High-grade intraepithelial neoplasias | ||
| LGIN: Low-grade intraepithelial neoplasias | ||
| Liver | 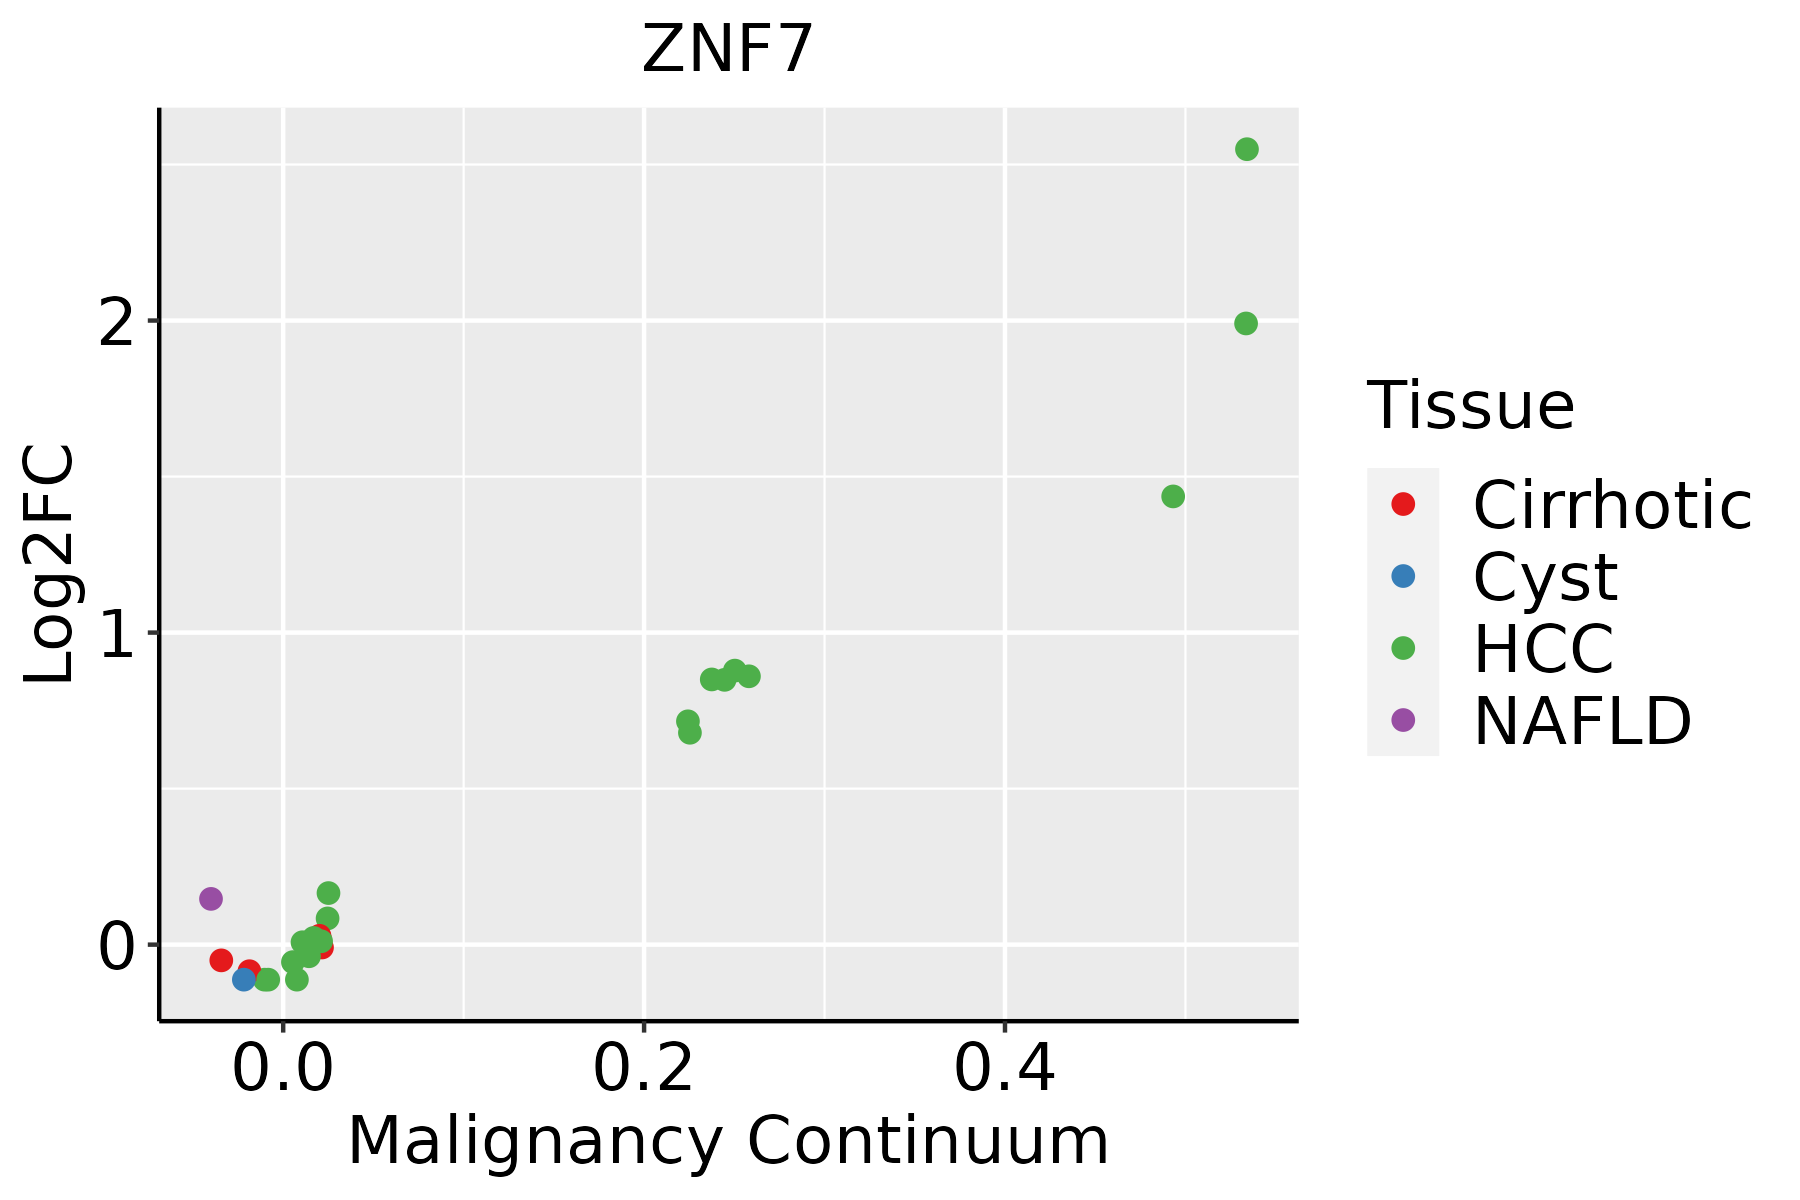 | HCC: Hepatocellular carcinoma |
| NAFLD: Non-alcoholic fatty liver disease | ||
| Oral Cavity | 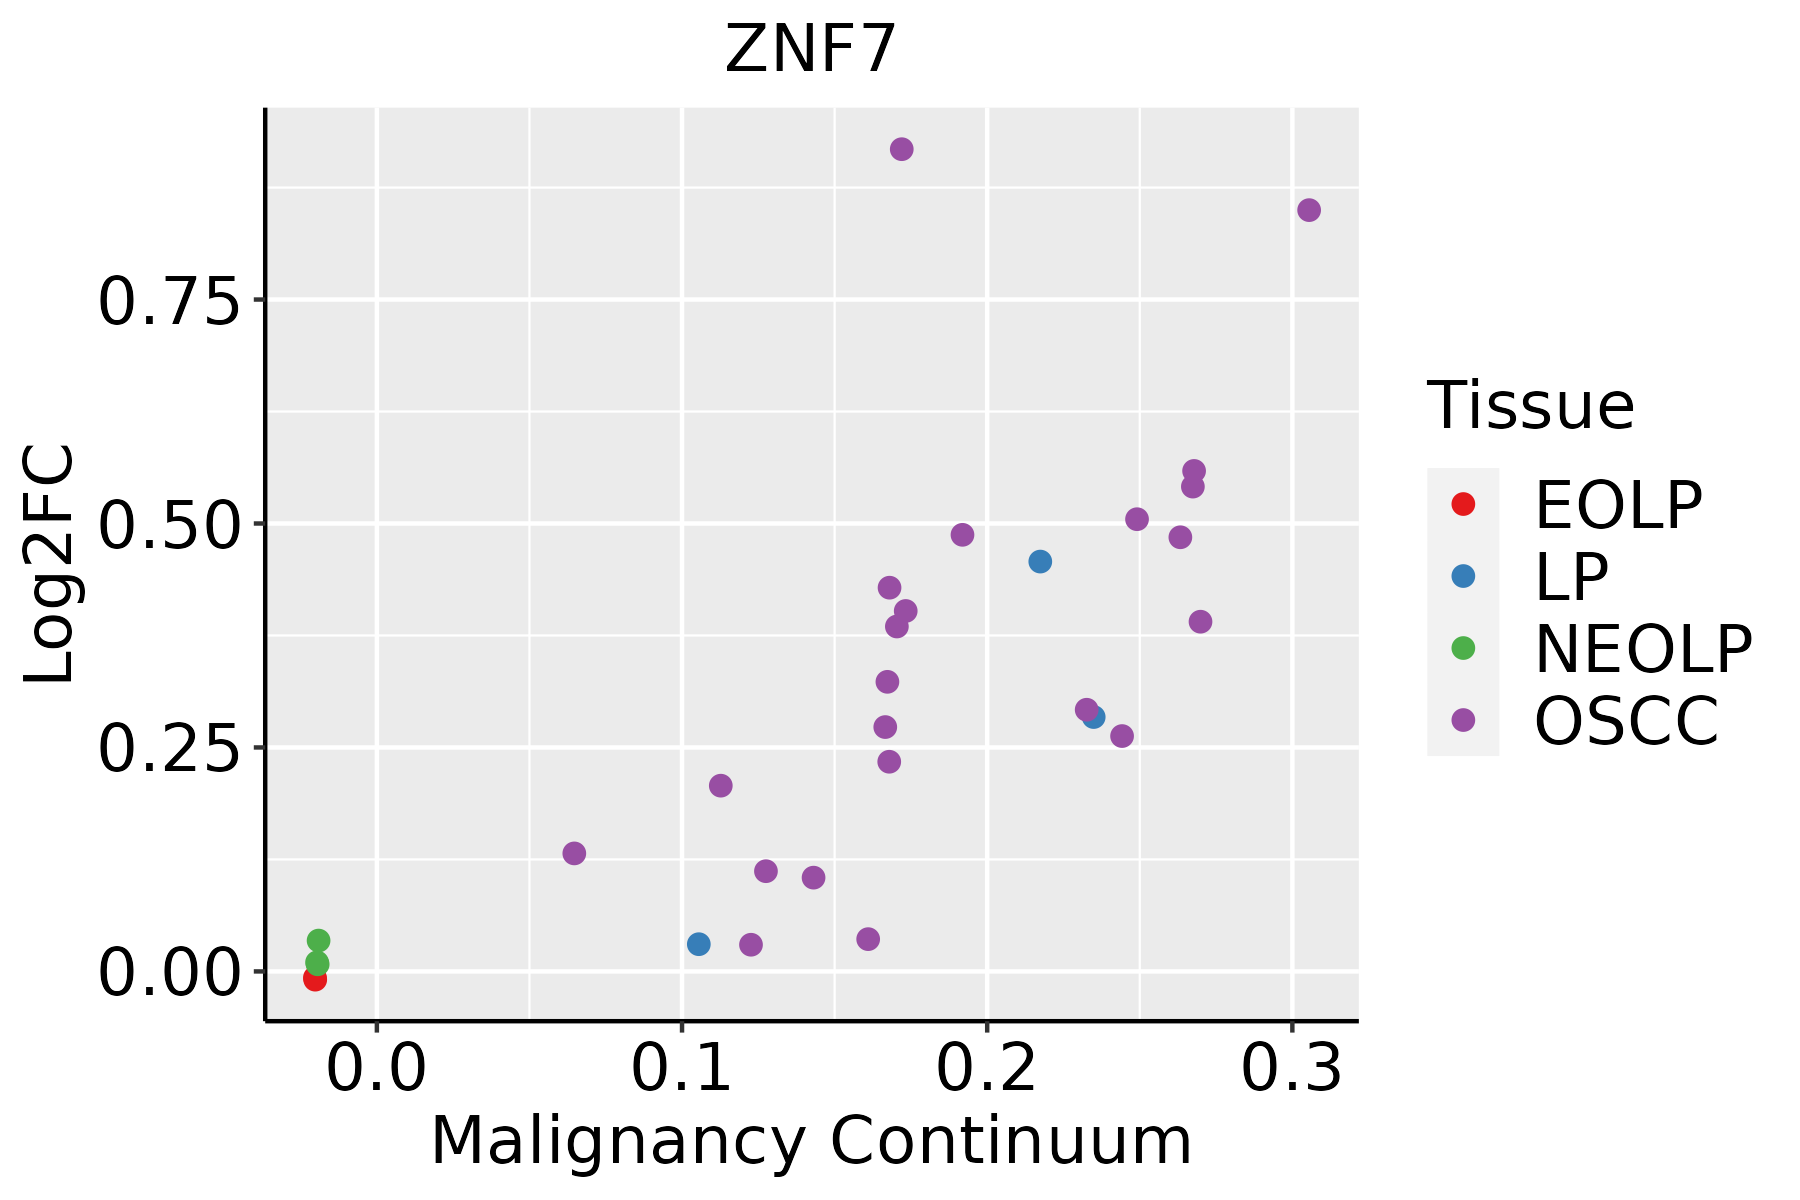 | EOLP: Erosive Oral lichen planus |
| LP: leukoplakia | ||
| NEOLP: Non-erosive oral lichen planus | ||
| OSCC: Oral squamous cell carcinoma |
| ∗log2FC in expression of this searched gene in stem-like cells from each diseased tissue sample relative to stem-like cells in normal samples in each tissue plotted against the malignancy continuum. Samples are colored based on if they are from different disease stage. |
Top |
Malignant transformation related pathway analysis |
| Find out the enriched GO biological processes and KEGG pathways involved in transition from healthy to precancer to cancer |
| Tissue | Disease Stage | Enriched GO biological Processes |
| Colorectum | AD |  |
| Colorectum | SER |  |
| Colorectum | MSS |  |
| Colorectum | MSI-H |  |
| Colorectum | FAP |  |
| ∗Top 15 enriched GO BP terms are showed in the bar plot of each disease state in each tissue. Each row represents a significant GO biological process which is colored according to the -log10(p.adjust). |
| Page: 1 2 3 4 5 6 7 8 9 |
| GO ID | Tissue | Disease Stage | Description | Gene Ratio | Bg Ratio | pvalue | p.adjust | Count |
| GO:000641719 | Prostate | Tumor | regulation of translation | 161/3246 | 468/18723 | 1.55e-19 | 8.74e-17 | 161 |
| GO:009872712 | Prostate | Tumor | maintenance of cell number | 45/3246 | 134/18723 | 3.80e-06 | 6.11e-05 | 45 |
| GO:001982712 | Prostate | Tumor | stem cell population maintenance | 44/3246 | 131/18723 | 4.83e-06 | 7.52e-05 | 44 |
| GO:000641728 | Skin | AK | regulation of translation | 102/1910 | 468/18723 | 6.79e-14 | 2.36e-11 | 102 |
| GO:00198278 | Skin | AK | stem cell population maintenance | 37/1910 | 131/18723 | 5.65e-09 | 4.03e-07 | 37 |
| GO:00987279 | Skin | AK | maintenance of cell number | 37/1910 | 134/18723 | 1.10e-08 | 7.11e-07 | 37 |
| GO:000641729 | Skin | cSCC | regulation of translation | 226/4864 | 468/18723 | 8.78e-26 | 2.62e-23 | 226 |
| GO:001982715 | Skin | cSCC | stem cell population maintenance | 58/4864 | 131/18723 | 4.20e-06 | 6.24e-05 | 58 |
| GO:009872715 | Skin | cSCC | maintenance of cell number | 58/4864 | 134/18723 | 9.83e-06 | 1.29e-04 | 58 |
| GO:0006417113 | Thyroid | PTC | regulation of translation | 236/5968 | 468/18723 | 2.70e-17 | 2.52e-15 | 236 |
| GO:0016055110 | Thyroid | PTC | Wnt signaling pathway | 217/5968 | 444/18723 | 3.71e-14 | 2.30e-12 | 217 |
| GO:0198738110 | Thyroid | PTC | cell-cell signaling by wnt | 217/5968 | 446/18723 | 6.68e-14 | 3.73e-12 | 217 |
| GO:0030111110 | Thyroid | PTC | regulation of Wnt signaling pathway | 163/5968 | 328/18723 | 1.05e-11 | 4.29e-10 | 163 |
| GO:007155919 | Thyroid | PTC | response to transforming growth factor beta | 131/5968 | 256/18723 | 9.20e-11 | 3.17e-09 | 131 |
| GO:007156019 | Thyroid | PTC | cellular response to transforming growth factor beta stimulus | 126/5968 | 250/18723 | 7.34e-10 | 2.19e-08 | 126 |
| GO:000717919 | Thyroid | PTC | transforming growth factor beta receptor signaling pathway | 104/5968 | 198/18723 | 1.20e-09 | 3.47e-08 | 104 |
| GO:0060828110 | Thyroid | PTC | regulation of canonical Wnt signaling pathway | 123/5968 | 253/18723 | 1.83e-08 | 4.26e-07 | 123 |
| GO:0048732113 | Thyroid | PTC | gland development | 193/5968 | 436/18723 | 2.88e-08 | 6.42e-07 | 193 |
| GO:0060070110 | Thyroid | PTC | canonical Wnt signaling pathway | 141/5968 | 303/18723 | 5.71e-08 | 1.21e-06 | 141 |
| GO:001701515 | Thyroid | PTC | regulation of transforming growth factor beta receptor signaling pathway | 69/5968 | 128/18723 | 1.92e-07 | 3.51e-06 | 69 |
| Page: 1 2 3 4 5 6 7 8 9 10 11 12 13 14 15 16 |
| Pathway ID | Tissue | Disease Stage | Description | Gene Ratio | Bg Ratio | pvalue | p.adjust | qvalue | Count |
| Page: 1 |
Top |
Cell-cell communication analysis |
| Identification of potential cell-cell interactions between two cell types and their ligand-receptor pairs for different disease states |
| Ligand | Receptor | LRpair | Pathway | Tissue | Disease Stage |
| Page: 1 |
Top |
Single-cell gene regulatory network inference analysis |
| Find out the significant the regulons (TFs) and the target genes of each regulon across cell types for different disease states |
| TF | Cell Type | Tissue | Disease Stage | Target Gene | RSS | Regulon Activity |
| ∗The dot plots of a searched regulon are shown for all cell subpopulations in each disease state of each tissue based on the regulon specific score inferred using pySCENIC and by calculating the average expression. |
| Page: 1 |
Top |
Somatic mutation of malignant transformation related genes |
| Annotation of somatic variants for genes involved in malignant transformation |
| Hugo Symbol | Variant Class | Variant Classification | dbSNP RS | HGVSc | HGVSp | HGVSp Short | SWISSPROT | BIOTYPE | SIFT | PolyPhen | Tumor Sample Barcode | Tissue | Histology | Sex | Age | Stage | Therapy Types | Drugs | Outcome |
| ZNF7 | SNV | Missense_Mutation | novel | c.1276T>G | p.Cys426Gly | p.C426G | P17097 | protein_coding | deleterious(0) | probably_damaging(0.999) | TCGA-A8-A09M-01 | Breast | breast invasive carcinoma | Female | >=65 | III/IV | Chemotherapy | paclitaxel | CR |
| ZNF7 | SNV | Missense_Mutation | rs200609680 | c.693N>C | p.Gln231His | p.Q231H | P17097 | protein_coding | deleterious(0) | benign(0.276) | TCGA-AC-A23H-01 | Breast | breast invasive carcinoma | Female | >=65 | I/II | Unknown | Unknown | PD |
| ZNF7 | SNV | Missense_Mutation | rs548449450 | c.784N>A | p.Glu262Lys | p.E262K | P17097 | protein_coding | tolerated(0.56) | benign(0.003) | TCGA-AN-A046-01 | Breast | breast invasive carcinoma | Female | >=65 | I/II | Unknown | Unknown | SD |
| ZNF7 | SNV | Missense_Mutation | novel | c.615N>A | p.Met205Ile | p.M205I | P17097 | protein_coding | tolerated(0.24) | benign(0) | TCGA-LL-A8F5-01 | Breast | breast invasive carcinoma | Female | <65 | I/II | Chemotherapy | cyclophosphamide | SD |
| ZNF7 | insertion | Nonsense_Mutation | novel | c.1045_1046insGTTTCTGATTCTGAGGTCTGGTT | p.Glu349GlyfsTer3 | p.E349Gfs*3 | P17097 | protein_coding | TCGA-A7-A0CE-01 | Breast | breast invasive carcinoma | Female | <65 | I/II | Chemotherapy | adriamycin | SD | ||
| ZNF7 | insertion | In_Frame_Ins | novel | c.486_487insTCTTGGCAGCTCTTCCAGCCT | p.Asn162_Cys163insSerTrpGlnLeuPheGlnPro | p.N162_C163insSWQLFQP | P17097 | protein_coding | TCGA-A8-A06X-01 | Breast | breast invasive carcinoma | Female | >=65 | I/II | Unknown | Unknown | SD | ||
| ZNF7 | insertion | Nonsense_Mutation | novel | c.1818_1819insTCACACTGGAGAAAAACCATTTAAATGTGATGAGTGTGGCAAAGG | p.Tyr606_Leu607insSerHisTrpArgLysThrIleTerMetTerTerValTrpGlnArg | p.Y606_L607insSHWRKTI*M**VWQR | P17097 | protein_coding | TCGA-A8-A095-01 | Breast | breast invasive carcinoma | Female | <65 | I/II | Chemotherapy | 5-fluorouracil | CR | ||
| ZNF7 | insertion | Frame_Shift_Ins | novel | c.1111_1112insACAGGACTTTCCTCAGAATCCTGGCTTTGGAGACGTTTCT | p.Arg371AsnfsTer68 | p.R371Nfs*68 | P17097 | protein_coding | TCGA-A8-A097-01 | Breast | breast invasive carcinoma | Female | >=65 | I/II | Hormone Therapy | tamoxiphen | SD | ||
| ZNF7 | insertion | In_Frame_Ins | novel | c.435_436insAGTGAA | p.Ser145_His146insSerGlu | p.S145_H146insSE | P17097 | protein_coding | TCGA-B6-A0RE-01 | Breast | breast invasive carcinoma | Female | <65 | I/II | Unknown | Unknown | SD | ||
| ZNF7 | insertion | Frame_Shift_Ins | novel | c.437_438insAGGTAAAAAGTATGAAACCACT | p.His146GlnfsTer24 | p.H146Qfs*24 | P17097 | protein_coding | TCGA-B6-A0RE-01 | Breast | breast invasive carcinoma | Female | <65 | I/II | Unknown | Unknown | SD |
| Page: 1 2 3 4 5 6 7 8 9 10 |
Top |
Related drugs of malignant transformation related genes |
| Identification of chemicals and drugs interact with genes involved in malignant transfromation |
| (DGIdb 4.0) |
| Entrez ID | Symbol | Category | Interaction Types | Drug Claim Name | Drug Name | PMIDs |
| Page: 1 |

Copyright 2023-Present -The University of Texas Health Science Center at Houston |