Schematic overview of the cellular and molecular mechanisms involved in the cancer progression, including the proposed cellular and molecular mechanisms in cancer cells trajectory. AT1: alveolar type 1 cells; AT2: alveolar type 2 cells; AAH: atypical adenomatous hyperplasia; AIS: adenocarcinoma in situ; MIA: minimally invasive adenocarcinoma; IA: invasive adenocarcinoma; EMT: epithelial-mesenchymal transition

Home

Download

Statistics

Help

Contact

Center for Computational Systems Medicine
leaf

Gene summary

leaf

Malignant transformation analysis

leaf

Malignant transformation related pathway analysis

leaf

Cell-cell communication analysis

leaf

Single-cell gene regulatory network inference analysis

leaf

Somatic mutation of malignant transformation related genes

leaf

Related drugs of malignant transformation related genes

Gene: ZBTB20

Gene summary for ZBTB20

check button Gene summary.

Gene informationSpeciesHuman
Gene symbol

ZBTB20

Gene ID

26137

Gene namezinc finger and BTB domain containing 20
Gene AliasDPZF
Cytomap3q13.31
Gene Typeprotein-coding
GO ID

GO:0000122

UniProtAcc

Q9HC78


Top

Malignant transformation analysis

check button Identification of the aberrant gene expression in precancerous and cancerous lesions by comparing the gene expression of stem-like cells in diseased tissues with normal stem cells
check button Malignant transformation involving gene list.
Entrez IDSymbolReplicatesSpeciesOrganTissueAdj P-valueLog2FCMalignancy
26137ZBTB20GSM4909281HumanBreastIDC3.82e-104.61e-010.21
26137ZBTB20GSM4909286HumanBreastIDC4.32e-114.08e-010.1081
26137ZBTB20GSM4909290HumanBreastIDC2.34e-05-2.68e-010.2096
26137ZBTB20GSM4909296HumanBreastIDC1.49e-05-1.85e-010.1524
26137ZBTB20GSM4909297HumanBreastIDC2.01e-04-6.40e-020.1517
26137ZBTB20GSM4909299HumanBreastIDC3.98e-267.28e-010.035
26137ZBTB20GSM4909300HumanBreastIDC3.15e-064.94e-010.0334
26137ZBTB20GSM4909305HumanBreastIDC1.36e-022.87e-010.0436
26137ZBTB20GSM4909307HumanBreastIDC4.17e-043.72e-010.1569
26137ZBTB20GSM4909308HumanBreastIDC1.84e-215.56e-010.158
26137ZBTB20GSM4909309HumanBreastIDC1.37e-145.59e-010.0483
26137ZBTB20GSM4909311HumanBreastIDC4.97e-13-1.88e-010.1534
26137ZBTB20GSM4909312HumanBreastIDC1.63e-06-1.55e-010.1552
26137ZBTB20GSM4909313HumanBreastIDC2.11e-084.20e-010.0391
26137ZBTB20GSM4909319HumanBreastIDC3.98e-16-2.64e-010.1563
26137ZBTB20GSM4909321HumanBreastIDC1.17e-10-1.82e-010.1559
26137ZBTB20brca1HumanBreastPrecancer5.56e-07-2.68e-01-0.0338
26137ZBTB20NCCBC14HumanBreastDCIS6.81e-03-1.17e-010.2021
26137ZBTB20NCCBC5HumanBreastDCIS1.62e-02-2.26e-010.2046
26137ZBTB20P1HumanBreastIDC2.69e-069.61e-020.1527
Page: 1 2 3 4 5 6 7 8 9 10 11 12 13 14 15 

check button Transcriptomic changes along malignancy continuum.
TissueExpression DynamicsAbbreviation
BreastThe image shows the transcriptomic changes along malignancy continuum.log2FC in expression of this searched gene in stem-like cells from each diseased tissue sample relative to stem-like cells in normal samples in each tissue plotted against the malignancy continuum. Samples are colored based on if they are from different disease stage.IDC: Invasive ductal carcinoma
DCIS: Ductal carcinoma in situ
Precancer(BRCA1-mut): Precancerous lesion from BRCA1 mutation carriers
CervixThe image shows the transcriptomic changes along malignancy continuum.log2FC in expression of this searched gene in stem-like cells from each diseased tissue sample relative to stem-like cells in normal samples in each tissue plotted against the malignancy continuum. Samples are colored based on if they are from different disease stage.CC: Cervix cancer
HSIL_HPV: HPV-infected high-grade squamous intraepithelial lesions
N_HPV: HPV-infected normal cervix
Colorectum (GSE201348)The image shows the transcriptomic changes along malignancy continuum.log2FC in expression of this searched gene in stem-like cells from each diseased tissue sample relative to stem-like cells in normal samples in each tissue plotted against the malignancy continuum. Samples are colored based on if they are from different disease stage.FAP: Familial adenomatous polyposis
CRC: Colorectal cancer
Colorectum (HTA11)The image shows the transcriptomic changes along malignancy continuum.log2FC in expression of this searched gene in stem-like cells from each diseased tissue sample relative to stem-like cells in normal samples in each tissue plotted against the malignancy continuum. Samples are colored based on if they are from different disease stage.AD: Adenomas
SER: Sessile serrated lesions
MSI-H: Microsatellite-high colorectal cancer
MSS: Microsatellite stable colorectal cancer
EndometriumThe image shows the transcriptomic changes along malignancy continuum.log2FC in expression of this searched gene in stem-like cells from each diseased tissue sample relative to stem-like cells in normal samples in each tissue plotted against the malignancy continuum. Samples are colored based on if they are from different disease stage.
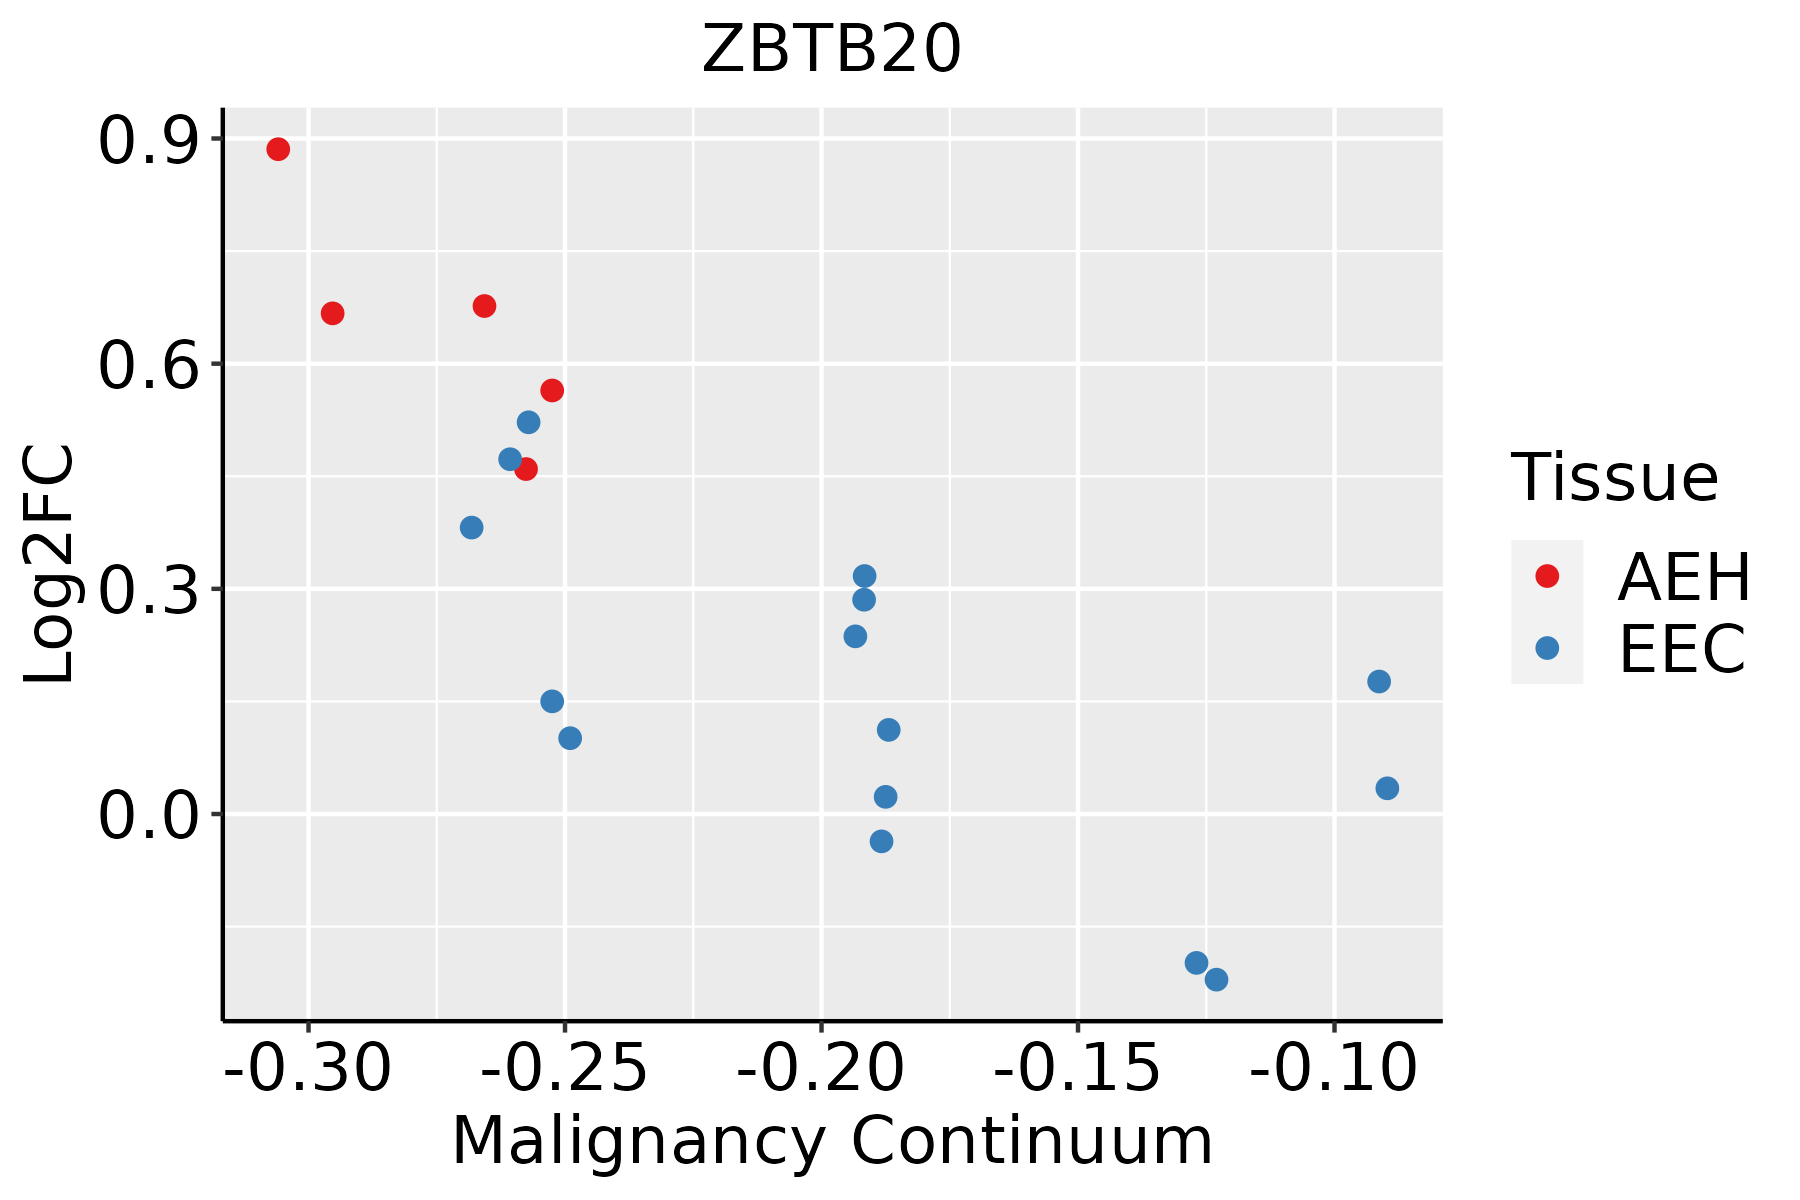
AEH: Atypical endometrial hyperplasia
EEC: Endometrioid Cancer
EsophagusThe image shows the transcriptomic changes along malignancy continuum.log2FC in expression of this searched gene in stem-like cells from each diseased tissue sample relative to stem-like cells in normal samples in each tissue plotted against the malignancy continuum. Samples are colored based on if they are from different disease stage.
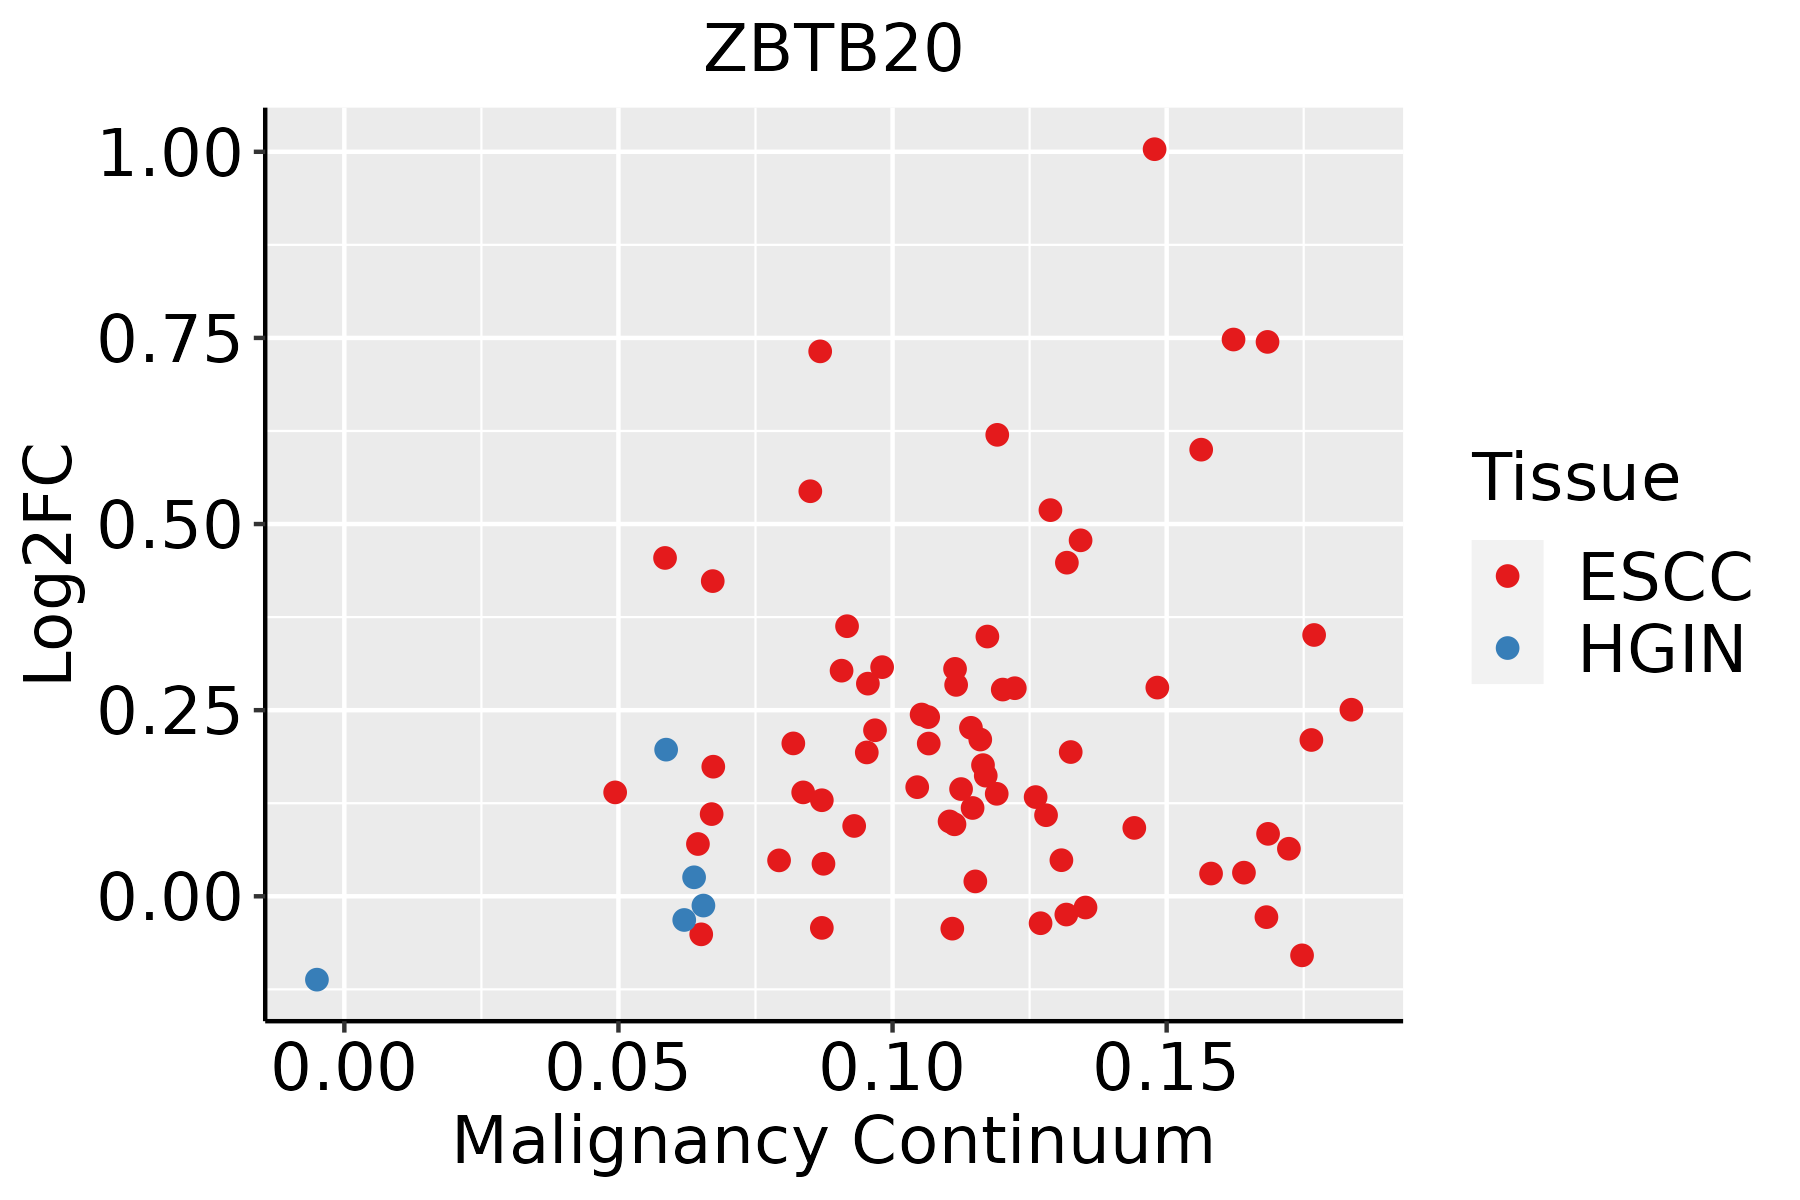
ESCC: Esophageal squamous cell carcinoma
HGIN: High-grade intraepithelial neoplasias
LGIN: Low-grade intraepithelial neoplasias
GCThe image shows the transcriptomic changes along malignancy continuum.log2FC in expression of this searched gene in stem-like cells from each diseased tissue sample relative to stem-like cells in normal samples in each tissue plotted against the malignancy continuum. Samples are colored based on if they are from different disease stage.
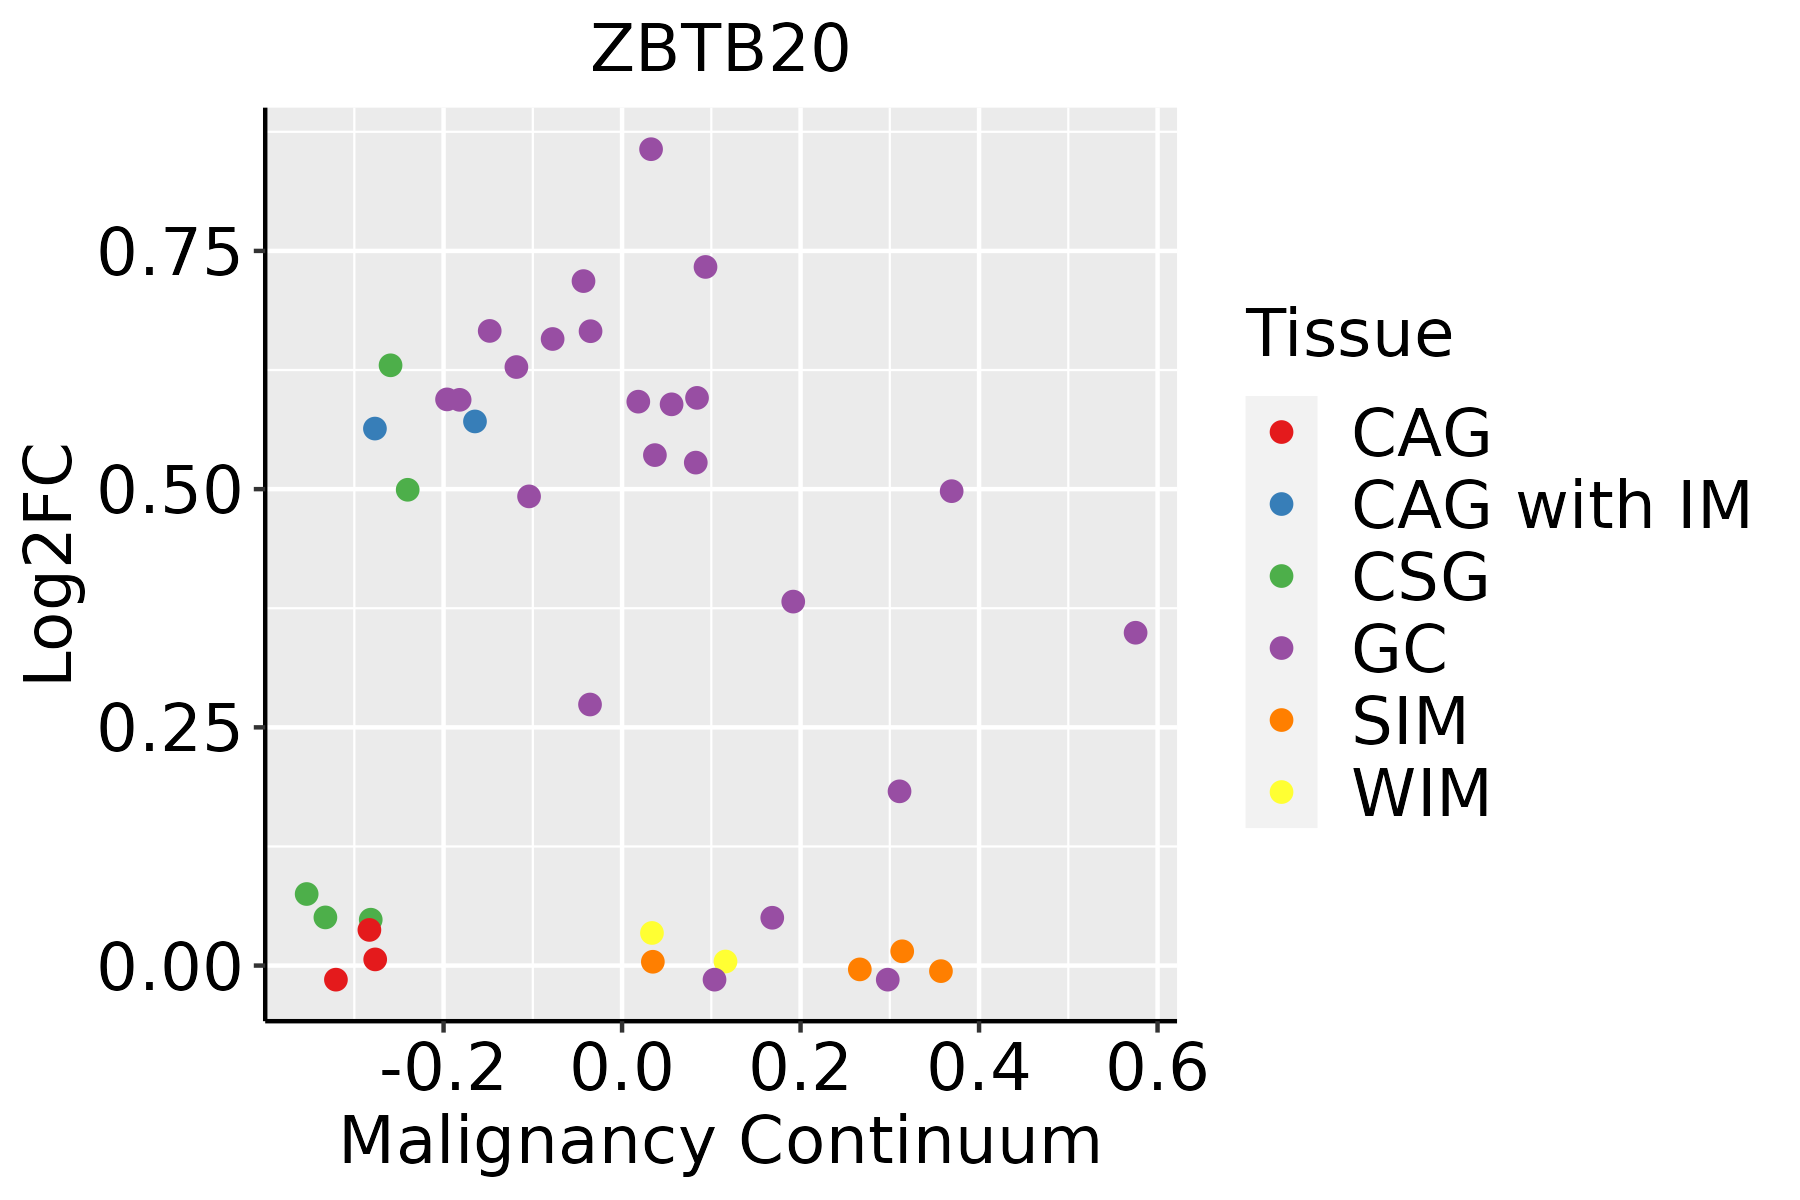
CAG: Chronic atrophic gastritis
CAG with IM: Chronic atrophic gastritis with intestinal metaplasia
CSG: Chronic superficial gastritis
GC: Gastric cancer
SIM: Severe intestinal metaplasia
WIM: Wild intestinal metaplasia
LiverThe image shows the transcriptomic changes along malignancy continuum.log2FC in expression of this searched gene in stem-like cells from each diseased tissue sample relative to stem-like cells in normal samples in each tissue plotted against the malignancy continuum. Samples are colored based on if they are from different disease stage.
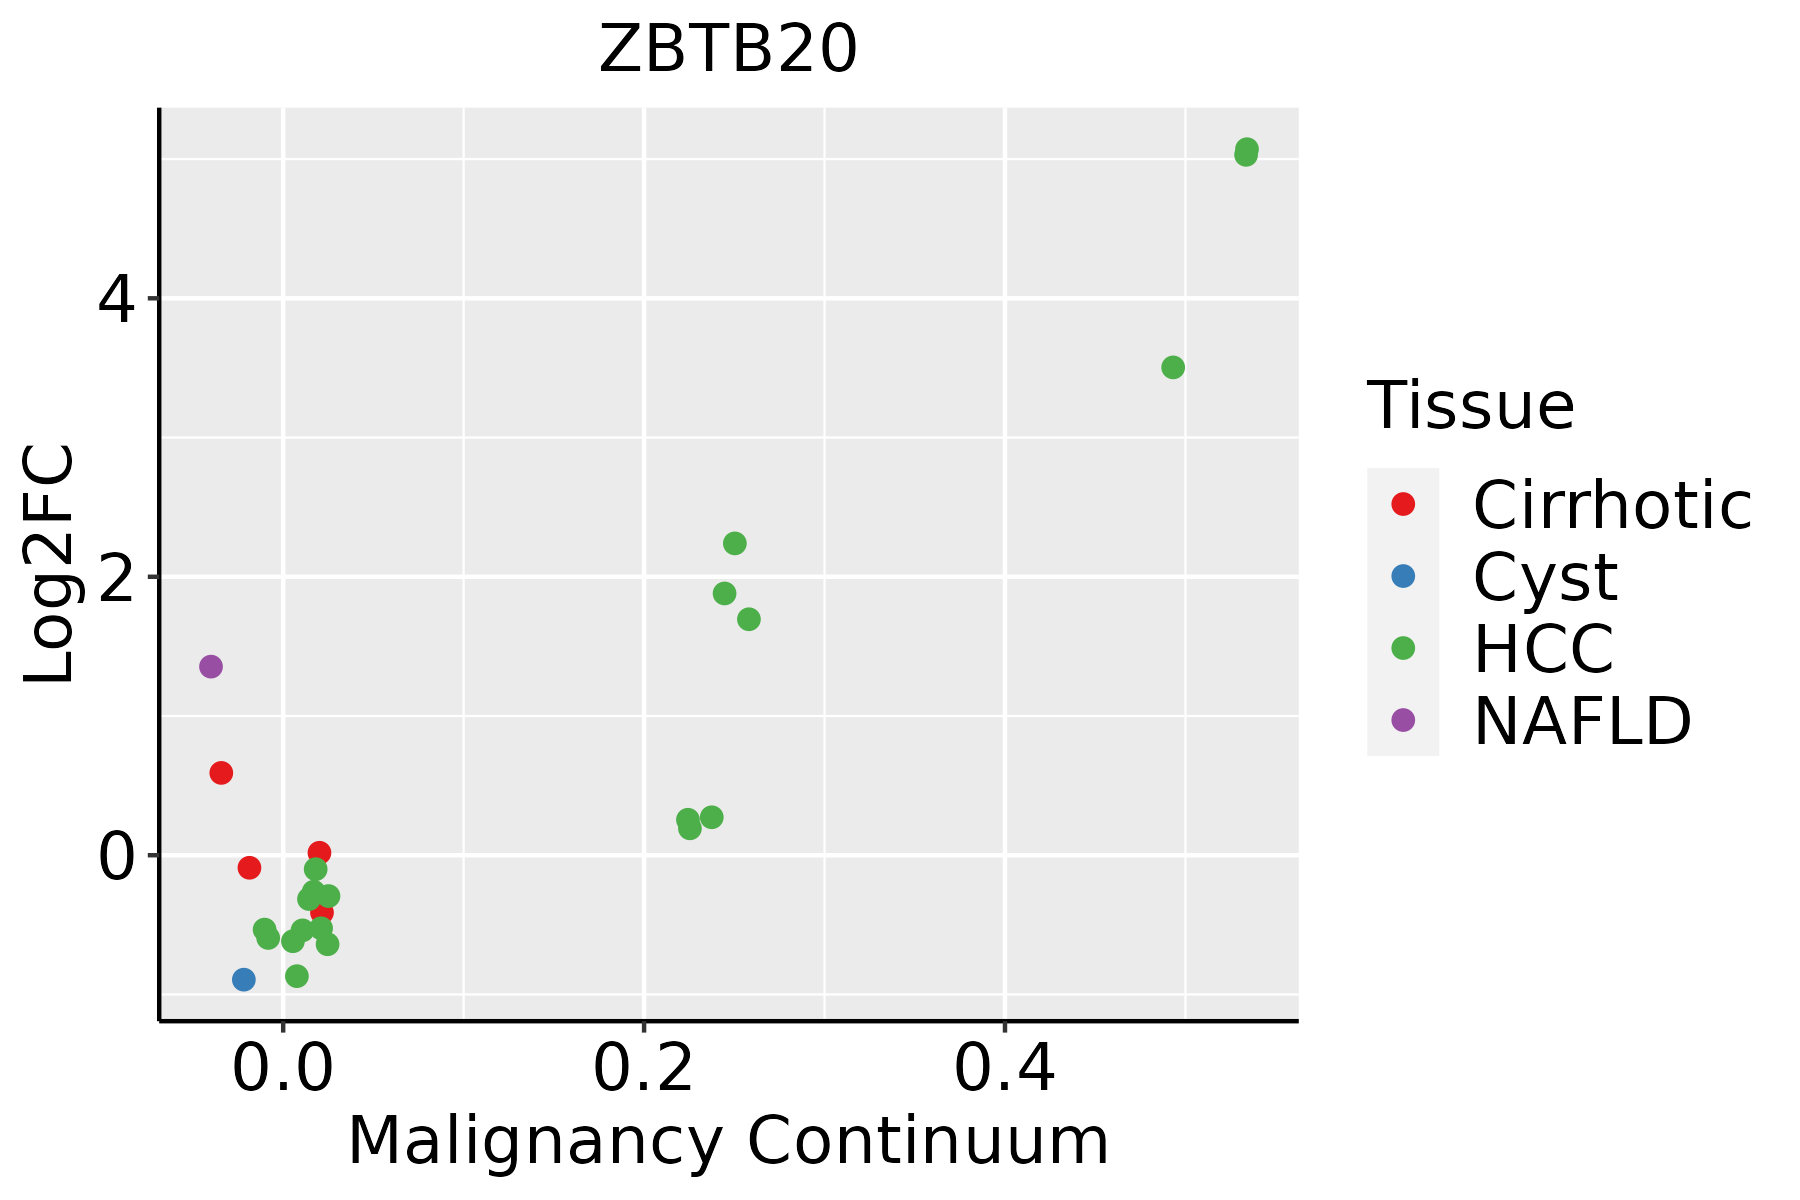
HCC: Hepatocellular carcinoma
NAFLD: Non-alcoholic fatty liver disease
LungThe image shows the transcriptomic changes along malignancy continuum.log2FC in expression of this searched gene in stem-like cells from each diseased tissue sample relative to stem-like cells in normal samples in each tissue plotted against the malignancy continuum. Samples are colored based on if they are from different disease stage.AAH: Atypical adenomatous hyperplasia
AIS: Adenocarcinoma in situ
IAC: Invasive lung adenocarcinoma
MIA: Minimally invasive adenocarcinoma
Oral CavityThe image shows the transcriptomic changes along malignancy continuum.log2FC in expression of this searched gene in stem-like cells from each diseased tissue sample relative to stem-like cells in normal samples in each tissue plotted against the malignancy continuum. Samples are colored based on if they are from different disease stage.
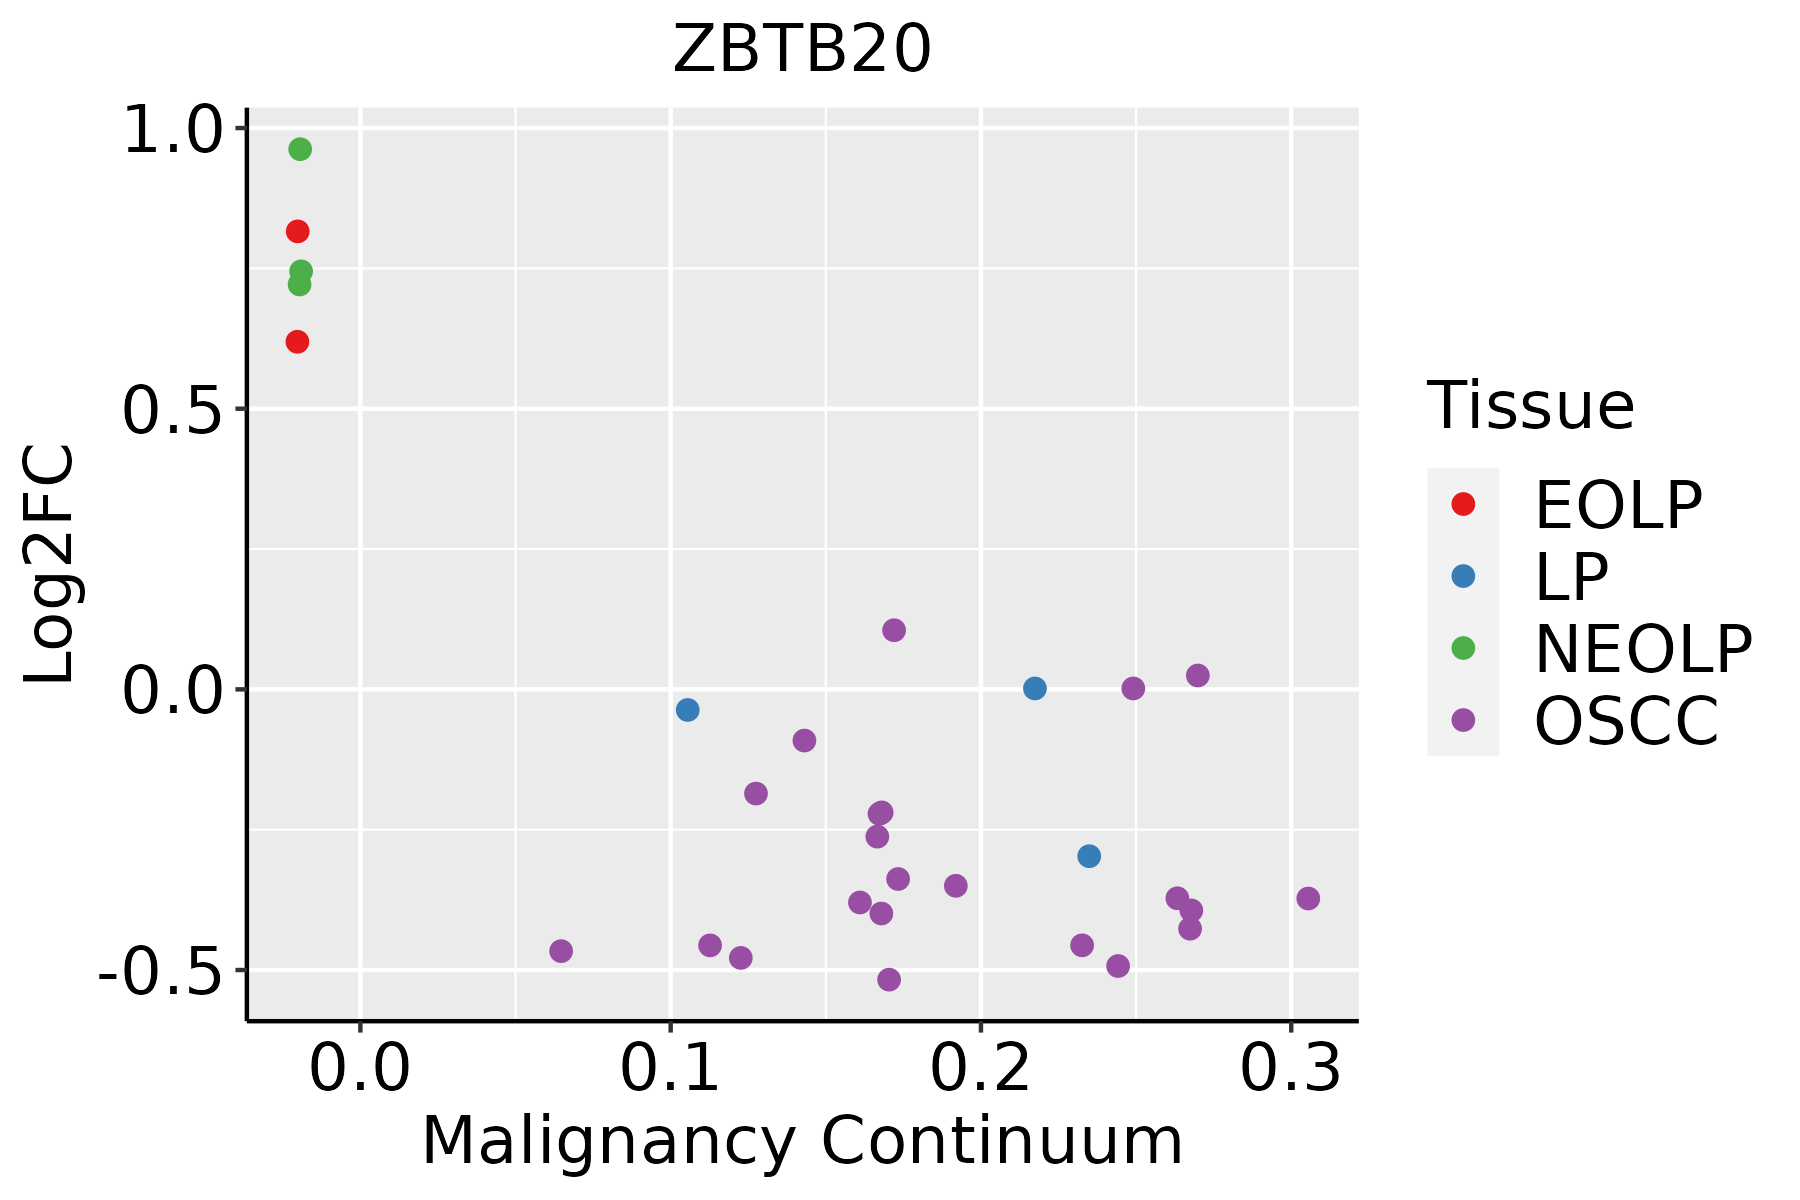
EOLP: Erosive Oral lichen planus
LP: leukoplakia
NEOLP: Non-erosive oral lichen planus
OSCC: Oral squamous cell carcinoma
ProstateThe image shows the transcriptomic changes along malignancy continuum.log2FC in expression of this searched gene in stem-like cells from each diseased tissue sample relative to stem-like cells in normal samples in each tissue plotted against the malignancy continuum. Samples are colored based on if they are from different disease stage.
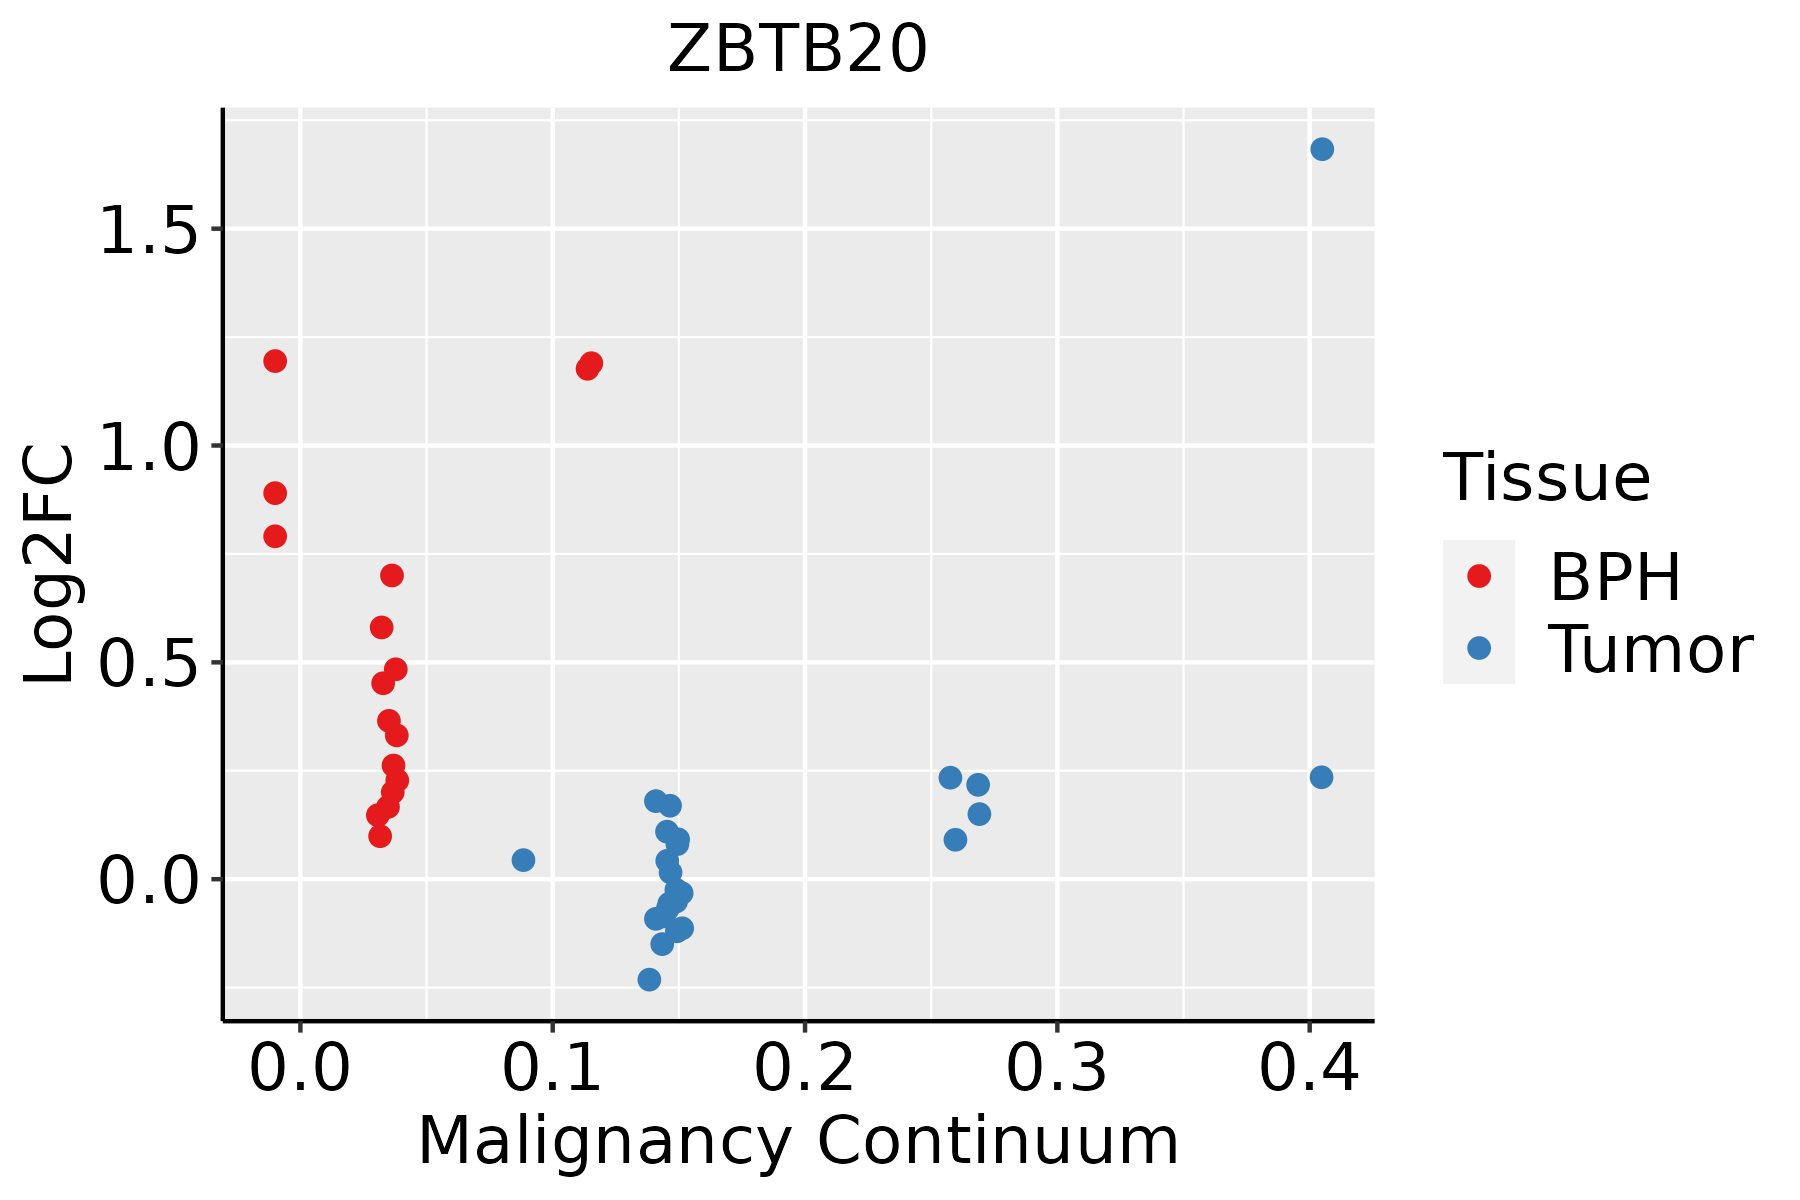
BPH: Benign Prostatic Hyperplasia
SkinThe image shows the transcriptomic changes along malignancy continuum.log2FC in expression of this searched gene in stem-like cells from each diseased tissue sample relative to stem-like cells in normal samples in each tissue plotted against the malignancy continuum. Samples are colored based on if they are from different disease stage.
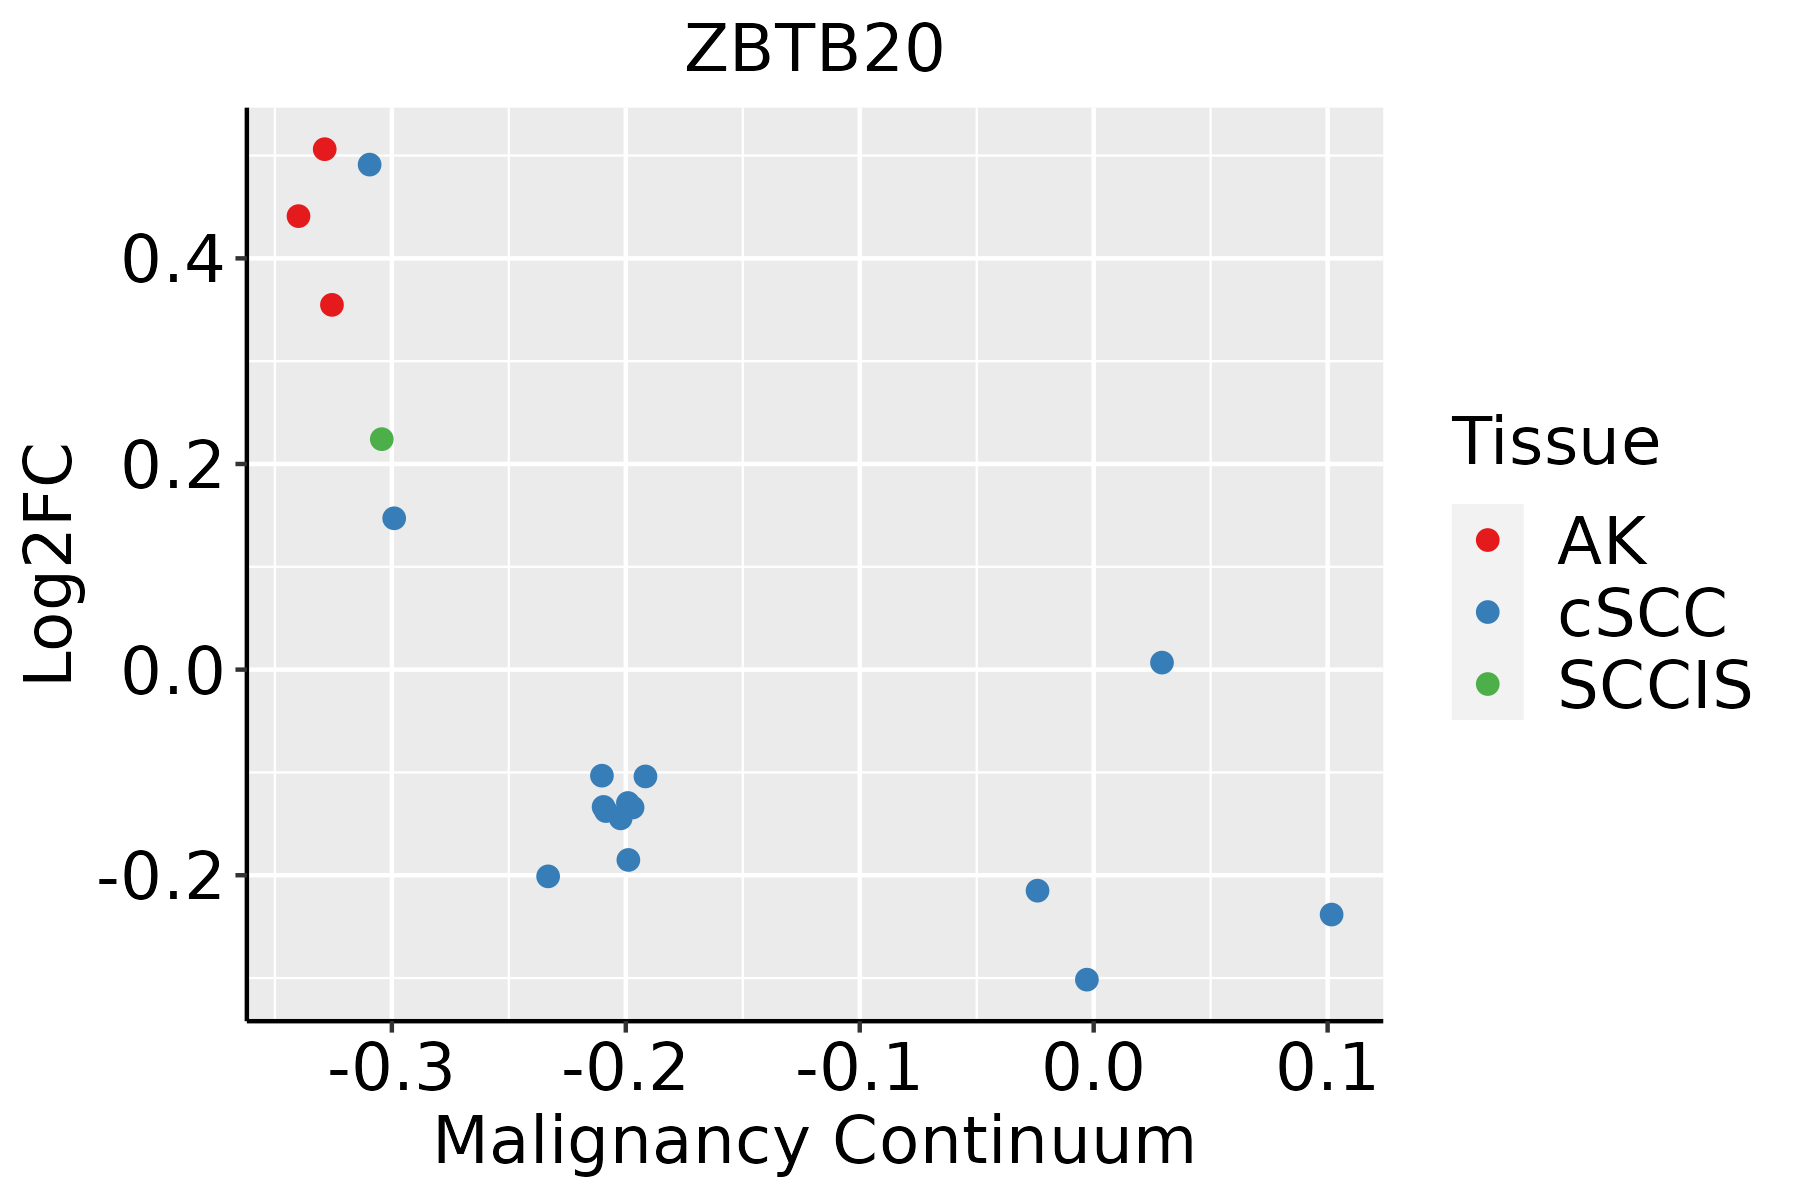
AK: Actinic keratosis
cSCC: Cutaneous squamous cell carcinoma
SCCIS:squamous cell carcinoma in situ
ThyroidThe image shows the transcriptomic changes along malignancy continuum.log2FC in expression of this searched gene in stem-like cells from each diseased tissue sample relative to stem-like cells in normal samples in each tissue plotted against the malignancy continuum. Samples are colored based on if they are from different disease stage.ATC: Anaplastic thyroid cancer
HT: Hashimoto's thyroiditis
PTC: Papillary thyroid cancer
∗log2FC in expression of this searched gene in stem-like cells from each diseased tissue sample relative to stem-like cells in normal samples in each tissue plotted against the malignancy continuum. Samples are colored based on if they are from different disease stage.

Top

Malignant transformation related pathway analysis

check buttonFind out the enriched GO biological processes and KEGG pathways involved in transition from healthy to precancer to cancer
check button Figure of enriched GO biological processes.
TissueDisease StageEnriched GO biological Processes
ColorectumADGO analysis - Figure of enriched GO biological processes: Top 15 enriched GO BP terms are showed in the bar plot of each disease state in each tissue. Each row represents a significant GO biological process which is colored according to the -log10(p.adjust).
ColorectumSERGO analysis - Figure of enriched GO biological processes: Top 15 enriched GO BP terms are showed in the bar plot of each disease state in each tissue. Each row represents a significant GO biological process which is colored according to the -log10(p.adjust).
ColorectumMSSGO analysis - Figure of enriched GO biological processes: Top 15 enriched GO BP terms are showed in the bar plot of each disease state in each tissue. Each row represents a significant GO biological process which is colored according to the -log10(p.adjust).
ColorectumMSI-HGO analysis - Figure of enriched GO biological processes: Top 15 enriched GO BP terms are showed in the bar plot of each disease state in each tissue. Each row represents a significant GO biological process which is colored according to the -log10(p.adjust).
ColorectumFAPGO analysis - Figure of enriched GO biological processes: Top 15 enriched GO BP terms are showed in the bar plot of each disease state in each tissue. Each row represents a significant GO biological process which is colored according to the -log10(p.adjust).
∗Top 15 enriched GO BP terms are showed in the bar plot of each disease state in each tissue. Each row represents a significant GO biological process which is colored according to the -log10(p.adjust).
Page: 1 2 3 4 5 6 7 8 9 

check button Enriched GO biological processes.
GO IDTissueDisease StageDescriptionGene RatioBg Ratiopvaluep.adjustCount
GO:00097491ColorectumSERresponse to glucose52/2897212/187233.75e-045.74e-0352
GO:00091321ColorectumSERnucleoside diphosphate metabolic process34/2897124/187234.53e-046.60e-0334
GO:00067571ColorectumSERATP generation from ADP25/289782/187234.54e-046.60e-0325
GO:00097461ColorectumSERresponse to hexose53/2897219/187234.69e-046.76e-0353
GO:00460311ColorectumSERADP metabolic process26/289790/187238.77e-041.06e-0226
GO:00469391ColorectumSERnucleotide phosphorylation28/2897101/187231.15e-031.31e-0228
GO:00061651ColorectumSERnucleoside diphosphate phosphorylation27/289799/187231.81e-031.86e-0227
GO:00160521ColorectumSERcarbohydrate catabolic process38/2897154/187231.92e-031.93e-0238
GO:00713331ColorectumSERcellular response to glucose stimulus37/2897151/187232.48e-032.33e-0237
GO:00425931ColorectumSERglucose homeostasis57/2897258/187232.92e-032.59e-0257
GO:00713311ColorectumSERcellular response to hexose stimulus37/2897153/187233.15e-032.73e-0237
GO:00335001ColorectumSERcarbohydrate homeostasis57/2897259/187233.20e-032.76e-0257
GO:00713261ColorectumSERcellular response to monosaccharide stimulus37/2897154/187233.55e-033.00e-0237
GO:00016781ColorectumSERcellular glucose homeostasis40/2897172/187234.61e-033.65e-0240
GO:00713221ColorectumSERcellular response to carbohydrate stimulus38/2897163/187235.41e-034.03e-0238
GO:00060912ColorectumMSSgeneration of precursor metabolites and energy186/3467490/187231.14e-242.15e-21186
GO:00460342ColorectumMSSATP metabolic process125/3467277/187231.38e-242.15e-21125
GO:00098962ColorectumMSSpositive regulation of catabolic process163/3467492/187233.10e-159.22e-13163
GO:00313312ColorectumMSSpositive regulation of cellular catabolic process140/3467427/187237.02e-131.33e-10140
GO:00061632ColorectumMSSpurine nucleotide metabolic process128/3467396/187232.04e-113.02e-09128
Page: 1 2 3 4 5 6 7 8 9 10 11 12 13 14 15 16 17 18 19 20 21 22 23 24 25 26 27 28 29 30 31 32 33 34 35 36 37 38 39 40 41 42 43 44 45 46 47 48 49 50 51 52 53 54 55 56 

check button Enriched KEGG pathways.
Pathway IDTissueDisease StageDescriptionGene RatioBg Ratiopvaluep.adjustqvalueCount
Page: 1 

Top

Cell-cell communication analysis

check buttonIdentification of potential cell-cell interactions between two cell types and their ligand-receptor pairs for different disease states
LigandReceptorLRpairPathwayTissueDisease Stage
Page: 1 

Top

Single-cell gene regulatory network inference analysis

check buttonFind out the significant the regulons (TFs) and the target genes of each regulon across cell types for different disease states
TFCell TypeTissueDisease StageTarget GeneRSSRegulon Activity
∗The dot plots of a searched regulon are shown for all cell subpopulations in each disease state of each tissue based on the regulon specific score inferred using pySCENIC and by calculating the average expression.
Page: 1 

Top

Somatic mutation of malignant transformation related genes

check buttonAnnotation of somatic variants for genes involved in malignant transformation
Hugo SymbolVariant ClassVariant ClassificationdbSNP RSHGVScHGVSpHGVSp ShortSWISSPROTBIOTYPESIFTPolyPhenTumor Sample BarcodeTissueHistologySexAgeStageTherapy TypesDrugsOutcome
ZBTB20SNVMissense_Mutationc.1090N>Ap.Glu364Lysp.E364KQ9HC78protein_codingdeleterious(0.03)probably_damaging(0.959)TCGA-A8-A06Q-01Breastbreast invasive carcinomaFemale<65III/IVUnknownUnknownSD
ZBTB20SNVMissense_Mutationnovelc.1864A>Gp.Ile622Valp.I622VQ9HC78protein_codingtolerated(0.06)possibly_damaging(0.727)TCGA-AC-A62Y-01Breastbreast invasive carcinomaFemale>=65I/IIUnknownUnknownSD
ZBTB20SNVMissense_Mutationnovelc.1824C>Gp.Cys608Trpp.C608WQ9HC78protein_codingdeleterious(0)probably_damaging(0.973)TCGA-B6-A0I5-01Breastbreast invasive carcinomaFemale<65I/IIUnknownUnknownSD
ZBTB20SNVMissense_Mutationc.1120A>Cp.Ser374Argp.S374RQ9HC78protein_codingdeleterious(0)probably_damaging(0.969)TCGA-BH-A18Q-01Breastbreast invasive carcinomaFemale<65I/IIUnknownUnknownSD
ZBTB20SNVMissense_Mutationrs779910215c.2155N>Ap.Val719Ilep.V719IQ9HC78protein_codingtolerated_low_confidence(0.1)probably_damaging(0.984)TCGA-D8-A1Y1-01Breastbreast invasive carcinomaFemale>=65III/IVHormone TherapytamoxiphenPD
ZBTB20insertionNonsense_Mutationnovelc.1688_1689insAGAACGTTGCTTAAGATAAACTTTGCCTTCTTTGCAGGGTAATGTAAp.Ala564GlufsTer6p.A564Efs*6Q9HC78protein_codingTCGA-A8-A08T-01Breastbreast invasive carcinomaFemale<65III/IVUnknownUnknownPD
ZBTB20insertionFrame_Shift_Insnovelc.1171_1172insGATCTCGATGTCGCTGTAGCCAp.Glu391GlyfsTer22p.E391Gfs*22Q9HC78protein_codingTCGA-AN-A0AS-01Breastbreast invasive carcinomaFemale>=65III/IVUnknownUnknownSD
ZBTB20insertionIn_Frame_Insnovelc.1261_1262insATCCCCTTGCAACTGATGTCACCTGCAGCATGTCAAp.Pro421delinsHisProLeuAlaThrAspValThrCysSerMetSerThrp.P421delinsHPLATDVTCSMSTQ9HC78protein_codingTCGA-AO-A0JE-01Breastbreast invasive carcinomaFemale<65III/IVChemotherapydoxorubicinSD
ZBTB20insertionFrame_Shift_Insnovelc.1822_1823insATATTCTTGTGGAAGAGAAAAAGAAAAAGAAATGGAGGGTGGGGp.Cys608TyrfsTer25p.C608Yfs*25Q9HC78protein_codingTCGA-B6-A0I5-01Breastbreast invasive carcinomaFemale<65I/IIUnknownUnknownSD
ZBTB20deletionFrame_Shift_Delnovelc.284delNp.Asn95ThrfsTer12p.N95Tfs*12Q9HC78protein_codingTCGA-EW-A2FV-01Breastbreast invasive carcinomaFemale<65III/IVChemotherapydocetaxelSD
Page: 1 2 3 4 5 6 7 8 9 10 11 12 

Top

Related drugs of malignant transformation related genes

check buttonIdentification of chemicals and drugs interact with genes involved in malignant transfromation
(DGIdb 4.0)
Entrez IDSymbolCategoryInteraction TypesDrug Claim NameDrug NamePMIDs
Page: 1