
|
|||||
|
 | |
| |
| |
| |
| |
| |
|
Gene: ZBTB1 |
Gene summary for ZBTB1 |
| Gene information | Species | Human | Gene symbol | ZBTB1 | Gene ID | 22890 |
| Gene name | zinc finger and BTB domain containing 1 | |
| Gene Alias | ZNF909 | |
| Cytomap | 14q23.3 | |
| Gene Type | protein-coding | GO ID | GO:0000122 | UniProtAcc | Q9Y2K1 |
Top |
Malignant transformation analysis |
| Identification of the aberrant gene expression in precancerous and cancerous lesions by comparing the gene expression of stem-like cells in diseased tissues with normal stem cells |
| Entrez ID | Symbol | Replicates | Species | Organ | Tissue | Adj P-value | Log2FC | Malignancy |
| 22890 | ZBTB1 | LZE4T | Human | Esophagus | ESCC | 1.53e-07 | 1.46e-01 | 0.0811 |
| 22890 | ZBTB1 | LZE5T | Human | Esophagus | ESCC | 2.57e-02 | 1.46e-01 | 0.0514 |
| 22890 | ZBTB1 | LZE8T | Human | Esophagus | ESCC | 4.90e-04 | -1.02e-03 | 0.067 |
| 22890 | ZBTB1 | LZE20T | Human | Esophagus | ESCC | 2.43e-06 | 9.56e-02 | 0.0662 |
| 22890 | ZBTB1 | LZE24T | Human | Esophagus | ESCC | 3.99e-12 | 3.45e-01 | 0.0596 |
| 22890 | ZBTB1 | LZE21T | Human | Esophagus | ESCC | 7.89e-03 | 1.66e-01 | 0.0655 |
| 22890 | ZBTB1 | P2T-E | Human | Esophagus | ESCC | 4.49e-21 | 2.58e-01 | 0.1177 |
| 22890 | ZBTB1 | P4T-E | Human | Esophagus | ESCC | 1.14e-17 | 3.53e-01 | 0.1323 |
| 22890 | ZBTB1 | P5T-E | Human | Esophagus | ESCC | 2.27e-04 | 3.16e-02 | 0.1327 |
| 22890 | ZBTB1 | P8T-E | Human | Esophagus | ESCC | 1.30e-15 | 3.02e-01 | 0.0889 |
| 22890 | ZBTB1 | P9T-E | Human | Esophagus | ESCC | 2.77e-11 | 9.38e-02 | 0.1131 |
| 22890 | ZBTB1 | P10T-E | Human | Esophagus | ESCC | 2.55e-23 | 4.93e-01 | 0.116 |
| 22890 | ZBTB1 | P11T-E | Human | Esophagus | ESCC | 3.94e-07 | 3.19e-01 | 0.1426 |
| 22890 | ZBTB1 | P12T-E | Human | Esophagus | ESCC | 2.65e-19 | 5.13e-01 | 0.1122 |
| 22890 | ZBTB1 | P15T-E | Human | Esophagus | ESCC | 3.46e-19 | 4.83e-01 | 0.1149 |
| 22890 | ZBTB1 | P16T-E | Human | Esophagus | ESCC | 8.02e-15 | 3.09e-01 | 0.1153 |
| 22890 | ZBTB1 | P17T-E | Human | Esophagus | ESCC | 1.39e-03 | 2.67e-01 | 0.1278 |
| 22890 | ZBTB1 | P20T-E | Human | Esophagus | ESCC | 2.70e-15 | 2.19e-01 | 0.1124 |
| 22890 | ZBTB1 | P21T-E | Human | Esophagus | ESCC | 7.75e-17 | 1.08e-01 | 0.1617 |
| 22890 | ZBTB1 | P22T-E | Human | Esophagus | ESCC | 1.37e-20 | 2.24e-01 | 0.1236 |
| Page: 1 2 3 4 |
| Tissue | Expression Dynamics | Abbreviation |
| Esophagus |  | ESCC: Esophageal squamous cell carcinoma |
| HGIN: High-grade intraepithelial neoplasias | ||
| LGIN: Low-grade intraepithelial neoplasias | ||
| Prostate | 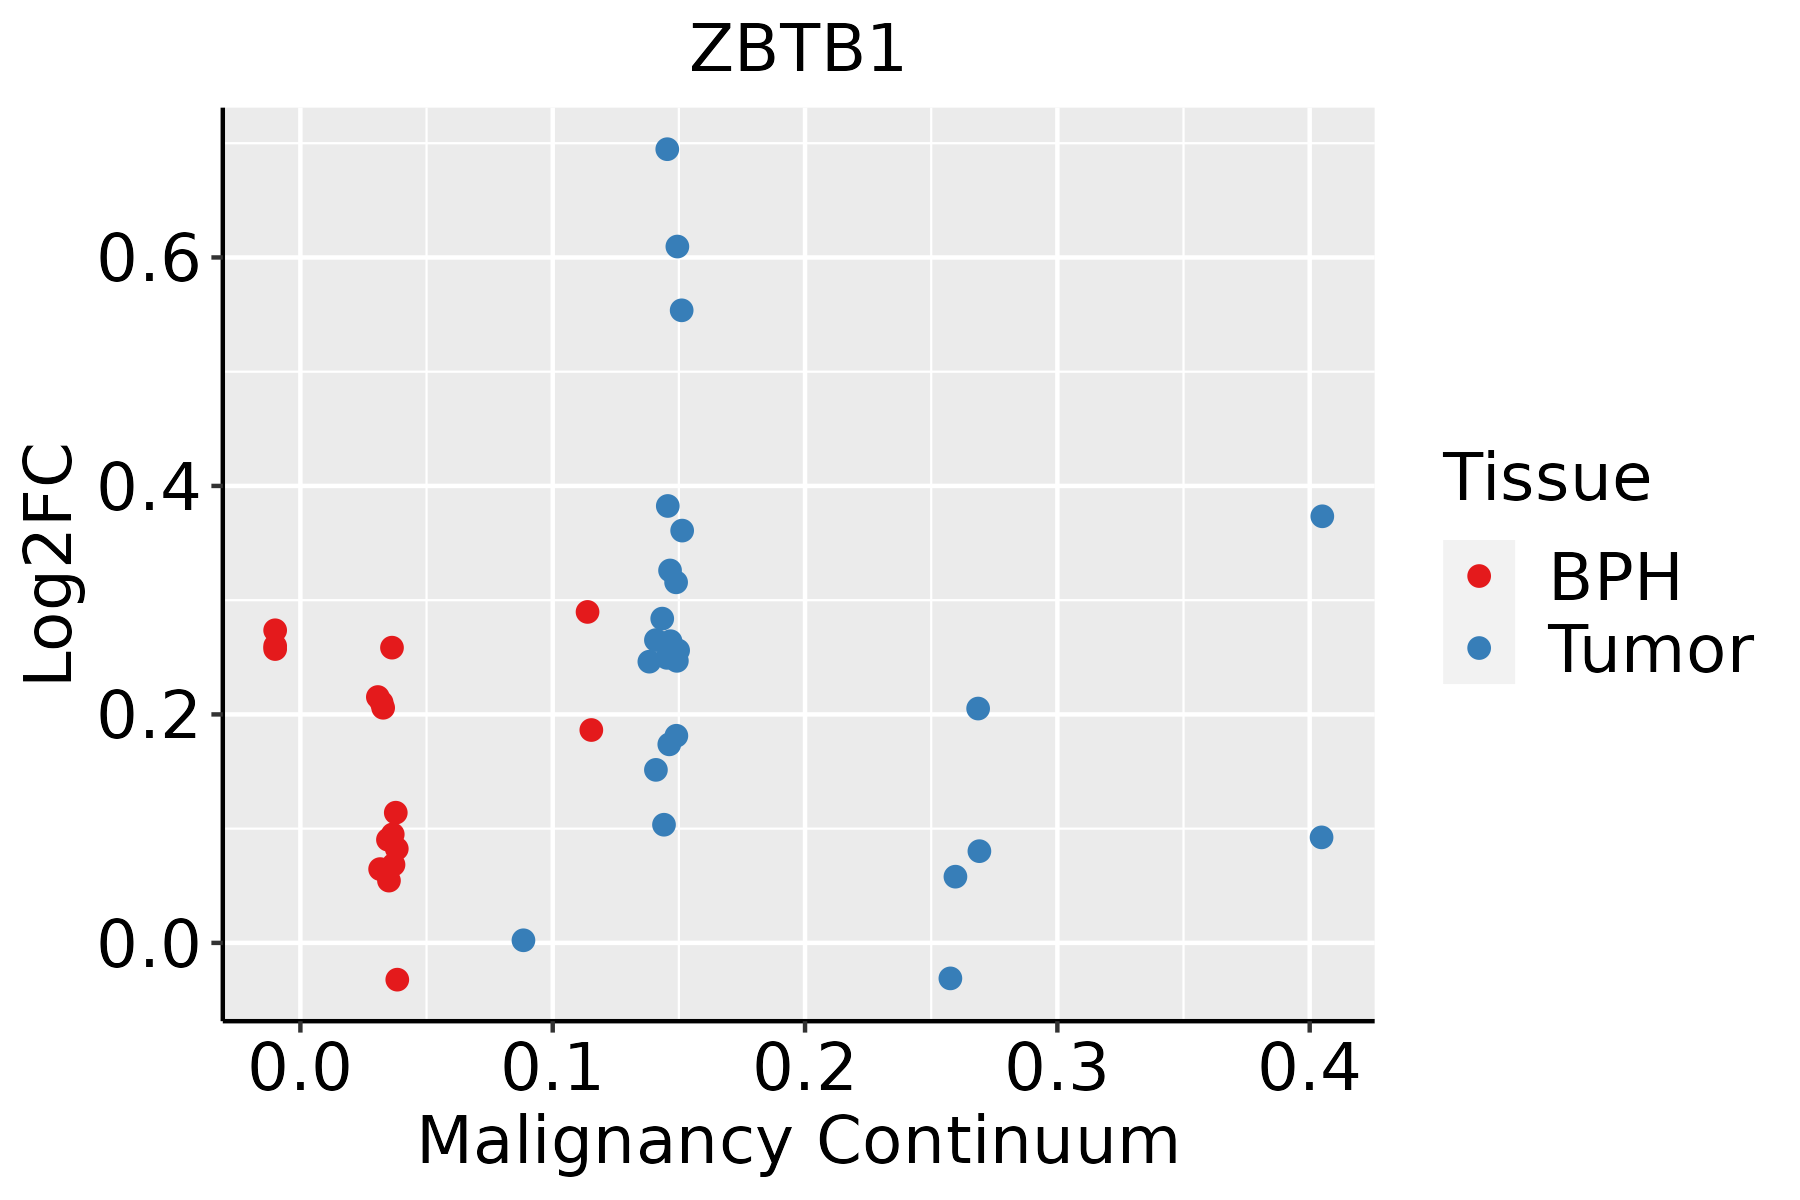 | BPH: Benign Prostatic Hyperplasia |
| ∗log2FC in expression of this searched gene in stem-like cells from each diseased tissue sample relative to stem-like cells in normal samples in each tissue plotted against the malignancy continuum. Samples are colored based on if they are from different disease stage. |
Top |
Malignant transformation related pathway analysis |
| Find out the enriched GO biological processes and KEGG pathways involved in transition from healthy to precancer to cancer |
| Tissue | Disease Stage | Enriched GO biological Processes |
| Colorectum | AD |  |
| Colorectum | SER |  |
| Colorectum | MSS |  |
| Colorectum | MSI-H |  |
| Colorectum | FAP |  |
| ∗Top 15 enriched GO BP terms are showed in the bar plot of each disease state in each tissue. Each row represents a significant GO biological process which is colored according to the -log10(p.adjust). |
| Page: 1 2 3 4 5 6 7 8 9 |
| GO ID | Tissue | Disease Stage | Description | Gene Ratio | Bg Ratio | pvalue | p.adjust | Count |
| GO:003027811 | Prostate | Tumor | regulation of ossification | 32/3246 | 115/18723 | 3.39e-03 | 1.75e-02 | 32 |
| GO:190210712 | Prostate | Tumor | positive regulation of leukocyte differentiation | 41/3246 | 157/18723 | 3.63e-03 | 1.86e-02 | 41 |
| GO:190370812 | Prostate | Tumor | positive regulation of hemopoiesis | 41/3246 | 157/18723 | 3.63e-03 | 1.86e-02 | 41 |
| GO:000941111 | Prostate | Tumor | response to UV | 39/3246 | 149/18723 | 4.29e-03 | 2.14e-02 | 39 |
| GO:00456381 | Prostate | Tumor | negative regulation of myeloid cell differentiation | 26/3246 | 90/18723 | 4.54e-03 | 2.24e-02 | 26 |
| GO:003021711 | Prostate | Tumor | T cell differentiation | 61/3246 | 257/18723 | 5.30e-03 | 2.54e-02 | 61 |
| GO:0042789 | Prostate | Tumor | mRNA transcription by RNA polymerase II | 6/3246 | 11/18723 | 5.63e-03 | 2.63e-02 | 6 |
| GO:000182312 | Prostate | Tumor | mesonephros development | 27/3246 | 96/18723 | 5.77e-03 | 2.68e-02 | 27 |
| GO:190303914 | Prostate | Tumor | positive regulation of leukocyte cell-cell adhesion | 57/3246 | 239/18723 | 6.17e-03 | 2.86e-02 | 57 |
| GO:006034811 | Prostate | Tumor | bone development | 50/3246 | 205/18723 | 6.30e-03 | 2.89e-02 | 50 |
| GO:00023201 | Prostate | Tumor | lymphoid progenitor cell differentiation | 9/3246 | 22/18723 | 7.96e-03 | 3.52e-02 | 9 |
| GO:004558011 | Prostate | Tumor | regulation of T cell differentiation | 37/3246 | 146/18723 | 9.18e-03 | 3.95e-02 | 37 |
| GO:000245614 | Prostate | Tumor | T cell mediated immunity | 29/3246 | 109/18723 | 9.93e-03 | 4.20e-02 | 29 |
| GO:0034504111 | Thyroid | PTC | protein localization to nucleus | 170/5968 | 290/18723 | 3.34e-21 | 6.38e-19 | 170 |
| GO:000182215 | Thyroid | PTC | kidney development | 133/5968 | 293/18723 | 7.57e-07 | 1.18e-05 | 133 |
| GO:0001503110 | Thyroid | PTC | ossification | 176/5968 | 408/18723 | 9.26e-07 | 1.40e-05 | 176 |
| GO:000165517 | Thyroid | PTC | urogenital system development | 149/5968 | 338/18723 | 1.41e-06 | 2.01e-05 | 149 |
| GO:007200114 | Thyroid | PTC | renal system development | 135/5968 | 302/18723 | 1.76e-06 | 2.43e-05 | 135 |
| GO:0030099113 | Thyroid | PTC | myeloid cell differentiation | 160/5968 | 381/18723 | 1.75e-05 | 1.82e-04 | 160 |
| GO:004544418 | Thyroid | PTC | fat cell differentiation | 102/5968 | 229/18723 | 3.66e-05 | 3.40e-04 | 102 |
| Page: 1 2 3 4 5 6 7 8 9 10 11 12 13 14 15 |
| Pathway ID | Tissue | Disease Stage | Description | Gene Ratio | Bg Ratio | pvalue | p.adjust | qvalue | Count |
| Page: 1 |
Top |
Cell-cell communication analysis |
| Identification of potential cell-cell interactions between two cell types and their ligand-receptor pairs for different disease states |
| Ligand | Receptor | LRpair | Pathway | Tissue | Disease Stage |
| Page: 1 |
Top |
Single-cell gene regulatory network inference analysis |
| Find out the significant the regulons (TFs) and the target genes of each regulon across cell types for different disease states |
| TF | Cell Type | Tissue | Disease Stage | Target Gene | RSS | Regulon Activity |
| ZBTB1 | MSC | Breast | ADJ | HK2,REL,RBBP6, etc. | 6.65e-03 |  |
| ZBTB1 | CAF | Breast | DCIS | HK2,REL,RBBP6, etc. | 5.85e-02 |  |
| ZBTB1 | MSC | Breast | Healthy | HK2,REL,RBBP6, etc. | 7.45e-02 |  |
| ZBTB1 | MSC | Breast | Precancer | HK2,REL,RBBP6, etc. | 2.37e-01 |  |
| ZBTB1 | TREG | Cervix | ADJ | CCL4L2,AKAP5,ZC3H18, etc. | 1.49e-02 |  |
| ZBTB1 | ICAF | Colorectum | SER | COL4A5,CTSK,C16orf87, etc. | 3.86e-01 |  |
| ZBTB1 | INCAF | Endometrium | ADJ | FAM156B,ZNF101,GDF7, etc. | 6.05e-01 |  |
| ZBTB1 | FIB | Endometrium | ADJ | FAM156B,ZNF101,GDF7, etc. | 1.39e-02 | |
| ZBTB1 | INCAF | Endometrium | AEH | FAM156B,ZNF101,GDF7, etc. | 6.02e-01 |  |
| ZBTB1 | ICAF | Endometrium | AEH | FAM156B,ZNF101,GDF7, etc. | 7.24e-03 | |
| ∗The dot plots of a searched regulon are shown for all cell subpopulations in each disease state of each tissue based on the regulon specific score inferred using pySCENIC and by calculating the average expression. |
| Page: 1 2 |
Top |
Somatic mutation of malignant transformation related genes |
| Annotation of somatic variants for genes involved in malignant transformation |
| Hugo Symbol | Variant Class | Variant Classification | dbSNP RS | HGVSc | HGVSp | HGVSp Short | SWISSPROT | BIOTYPE | SIFT | PolyPhen | Tumor Sample Barcode | Tissue | Histology | Sex | Age | Stage | Therapy Types | Drugs | Outcome |
| ZBTB1 | SNV | Missense_Mutation | c.1458G>C | p.Glu486Asp | p.E486D | Q9Y2K1 | protein_coding | tolerated(0.6) | benign(0.16) | TCGA-5L-AAT1-01 | Breast | breast invasive carcinoma | Female | <65 | III/IV | Hormone Therapy | letrozol | SD | |
| ZBTB1 | SNV | Missense_Mutation | c.204N>A | p.Met68Ile | p.M68I | Q9Y2K1 | protein_coding | tolerated(0.08) | benign(0.031) | TCGA-AC-A23H-01 | Breast | breast invasive carcinoma | Female | >=65 | I/II | Unknown | Unknown | PD | |
| ZBTB1 | SNV | Missense_Mutation | rs148266968 | c.961N>A | p.Glu321Lys | p.E321K | Q9Y2K1 | protein_coding | tolerated(0.5) | benign(0.092) | TCGA-AC-A23H-01 | Breast | breast invasive carcinoma | Female | >=65 | I/II | Unknown | Unknown | PD |
| ZBTB1 | SNV | Missense_Mutation | novel | c.1898G>A | p.Arg633Lys | p.R633K | Q9Y2K1 | protein_coding | tolerated(0.11) | probably_damaging(0.935) | TCGA-BH-A0C0-01 | Breast | breast invasive carcinoma | Female | <65 | I/II | Chemotherapy | carboplatin | SD |
| ZBTB1 | insertion | Nonsense_Mutation | novel | c.1901_1902insATGAGA | p.Tyr634delinsTer | p.Y634delins* | Q9Y2K1 | protein_coding | TCGA-A8-A096-01 | Breast | breast invasive carcinoma | Female | >=65 | I/II | Unknown | Unknown | SD | ||
| ZBTB1 | deletion | Frame_Shift_Del | rs747075448 | c.1140delN | p.Ser383ValfsTer6 | p.S383Vfs*6 | Q9Y2K1 | protein_coding | TCGA-AN-A0AK-01 | Breast | breast invasive carcinoma | Female | >=65 | I/II | Unknown | Unknown | SD | ||
| ZBTB1 | insertion | Frame_Shift_Ins | novel | c.687_688insCTGGAGGGAGC | p.Leu231GlufsTer5 | p.L231Efs*5 | Q9Y2K1 | protein_coding | TCGA-AR-A0TU-01 | Breast | breast invasive carcinoma | Female | <65 | I/II | Unspecific | Doxorubicin | SD | ||
| ZBTB1 | deletion | Frame_Shift_Del | novel | c.1885delN | p.Gly630AlafsTer24 | p.G630Afs*24 | Q9Y2K1 | protein_coding | TCGA-D8-A27V-01 | Breast | breast invasive carcinoma | Female | <65 | I/II | Hormone Therapy | tamoxiphen | SD | ||
| ZBTB1 | SNV | Missense_Mutation | rs143630259 | c.1406N>A | p.Arg469Gln | p.R469Q | Q9Y2K1 | protein_coding | deleterious(0.03) | benign(0.232) | TCGA-EK-A2RC-01 | Cervix | cervical & endocervical cancer | Female | <65 | I/II | Unknown | Unknown | SD |
| ZBTB1 | SNV | Missense_Mutation | c.1476G>C | p.Glu492Asp | p.E492D | Q9Y2K1 | protein_coding | tolerated(0.42) | benign(0.428) | TCGA-IR-A3LK-01 | Cervix | cervical & endocervical cancer | Female | >=65 | I/II | Chemotherapy | cisplatin | PD |
| Page: 1 2 3 4 5 6 7 8 |
Top |
Related drugs of malignant transformation related genes |
| Identification of chemicals and drugs interact with genes involved in malignant transfromation |
| (DGIdb 4.0) |
| Entrez ID | Symbol | Category | Interaction Types | Drug Claim Name | Drug Name | PMIDs |
| Page: 1 |

Copyright 2023-Present -The University of Texas Health Science Center at Houston |