
|
|||||
|
 | |
| |
| |
| |
| |
| |
|
Gene: XRN2 |
Gene summary for XRN2 |
| Gene information | Species | Human | Gene symbol | XRN2 | Gene ID | 22803 |
| Gene name | 5'-3' exoribonuclease 2 | |
| Gene Alias | XRN2 | |
| Cytomap | 20p11.22 | |
| Gene Type | protein-coding | GO ID | GO:0000003 | UniProtAcc | B4DZC3 |
Top |
Malignant transformation analysis |
| Identification of the aberrant gene expression in precancerous and cancerous lesions by comparing the gene expression of stem-like cells in diseased tissues with normal stem cells |
| Entrez ID | Symbol | Replicates | Species | Organ | Tissue | Adj P-value | Log2FC | Malignancy |
| 22803 | XRN2 | LZE2T | Human | Esophagus | ESCC | 7.58e-08 | 1.24e+00 | 0.082 |
| 22803 | XRN2 | LZE4T | Human | Esophagus | ESCC | 2.86e-27 | 1.10e+00 | 0.0811 |
| 22803 | XRN2 | LZE5T | Human | Esophagus | ESCC | 4.21e-02 | 5.94e-01 | 0.0514 |
| 22803 | XRN2 | LZE7T | Human | Esophagus | ESCC | 1.21e-04 | 8.03e-01 | 0.0667 |
| 22803 | XRN2 | LZE8T | Human | Esophagus | ESCC | 6.04e-09 | 4.19e-01 | 0.067 |
| 22803 | XRN2 | LZE22D1 | Human | Esophagus | HGIN | 1.18e-02 | 8.68e-03 | 0.0595 |
| 22803 | XRN2 | LZE22T | Human | Esophagus | ESCC | 1.86e-05 | 5.00e-01 | 0.068 |
| 22803 | XRN2 | LZE24T | Human | Esophagus | ESCC | 3.24e-13 | 4.61e-01 | 0.0596 |
| 22803 | XRN2 | LZE21T | Human | Esophagus | ESCC | 2.16e-04 | 2.49e-01 | 0.0655 |
| 22803 | XRN2 | LZE6T | Human | Esophagus | ESCC | 6.68e-06 | 5.08e-01 | 0.0845 |
| 22803 | XRN2 | P1T-E | Human | Esophagus | ESCC | 4.51e-09 | 7.57e-01 | 0.0875 |
| 22803 | XRN2 | P2T-E | Human | Esophagus | ESCC | 3.22e-63 | 1.39e+00 | 0.1177 |
| 22803 | XRN2 | P4T-E | Human | Esophagus | ESCC | 4.50e-32 | 1.02e+00 | 0.1323 |
| 22803 | XRN2 | P5T-E | Human | Esophagus | ESCC | 1.45e-15 | 6.31e-01 | 0.1327 |
| 22803 | XRN2 | P8T-E | Human | Esophagus | ESCC | 6.66e-32 | 8.54e-01 | 0.0889 |
| 22803 | XRN2 | P9T-E | Human | Esophagus | ESCC | 4.30e-29 | 8.42e-01 | 0.1131 |
| 22803 | XRN2 | P10T-E | Human | Esophagus | ESCC | 2.63e-72 | 1.61e+00 | 0.116 |
| 22803 | XRN2 | P11T-E | Human | Esophagus | ESCC | 3.71e-15 | 9.41e-01 | 0.1426 |
| 22803 | XRN2 | P12T-E | Human | Esophagus | ESCC | 1.19e-43 | 1.40e+00 | 0.1122 |
| 22803 | XRN2 | P15T-E | Human | Esophagus | ESCC | 6.57e-57 | 1.42e+00 | 0.1149 |
| Page: 1 2 3 4 5 6 7 |
| Tissue | Expression Dynamics | Abbreviation |
| Esophagus |  | ESCC: Esophageal squamous cell carcinoma |
| HGIN: High-grade intraepithelial neoplasias | ||
| LGIN: Low-grade intraepithelial neoplasias | ||
| Liver |  | HCC: Hepatocellular carcinoma |
| NAFLD: Non-alcoholic fatty liver disease | ||
| Oral Cavity | 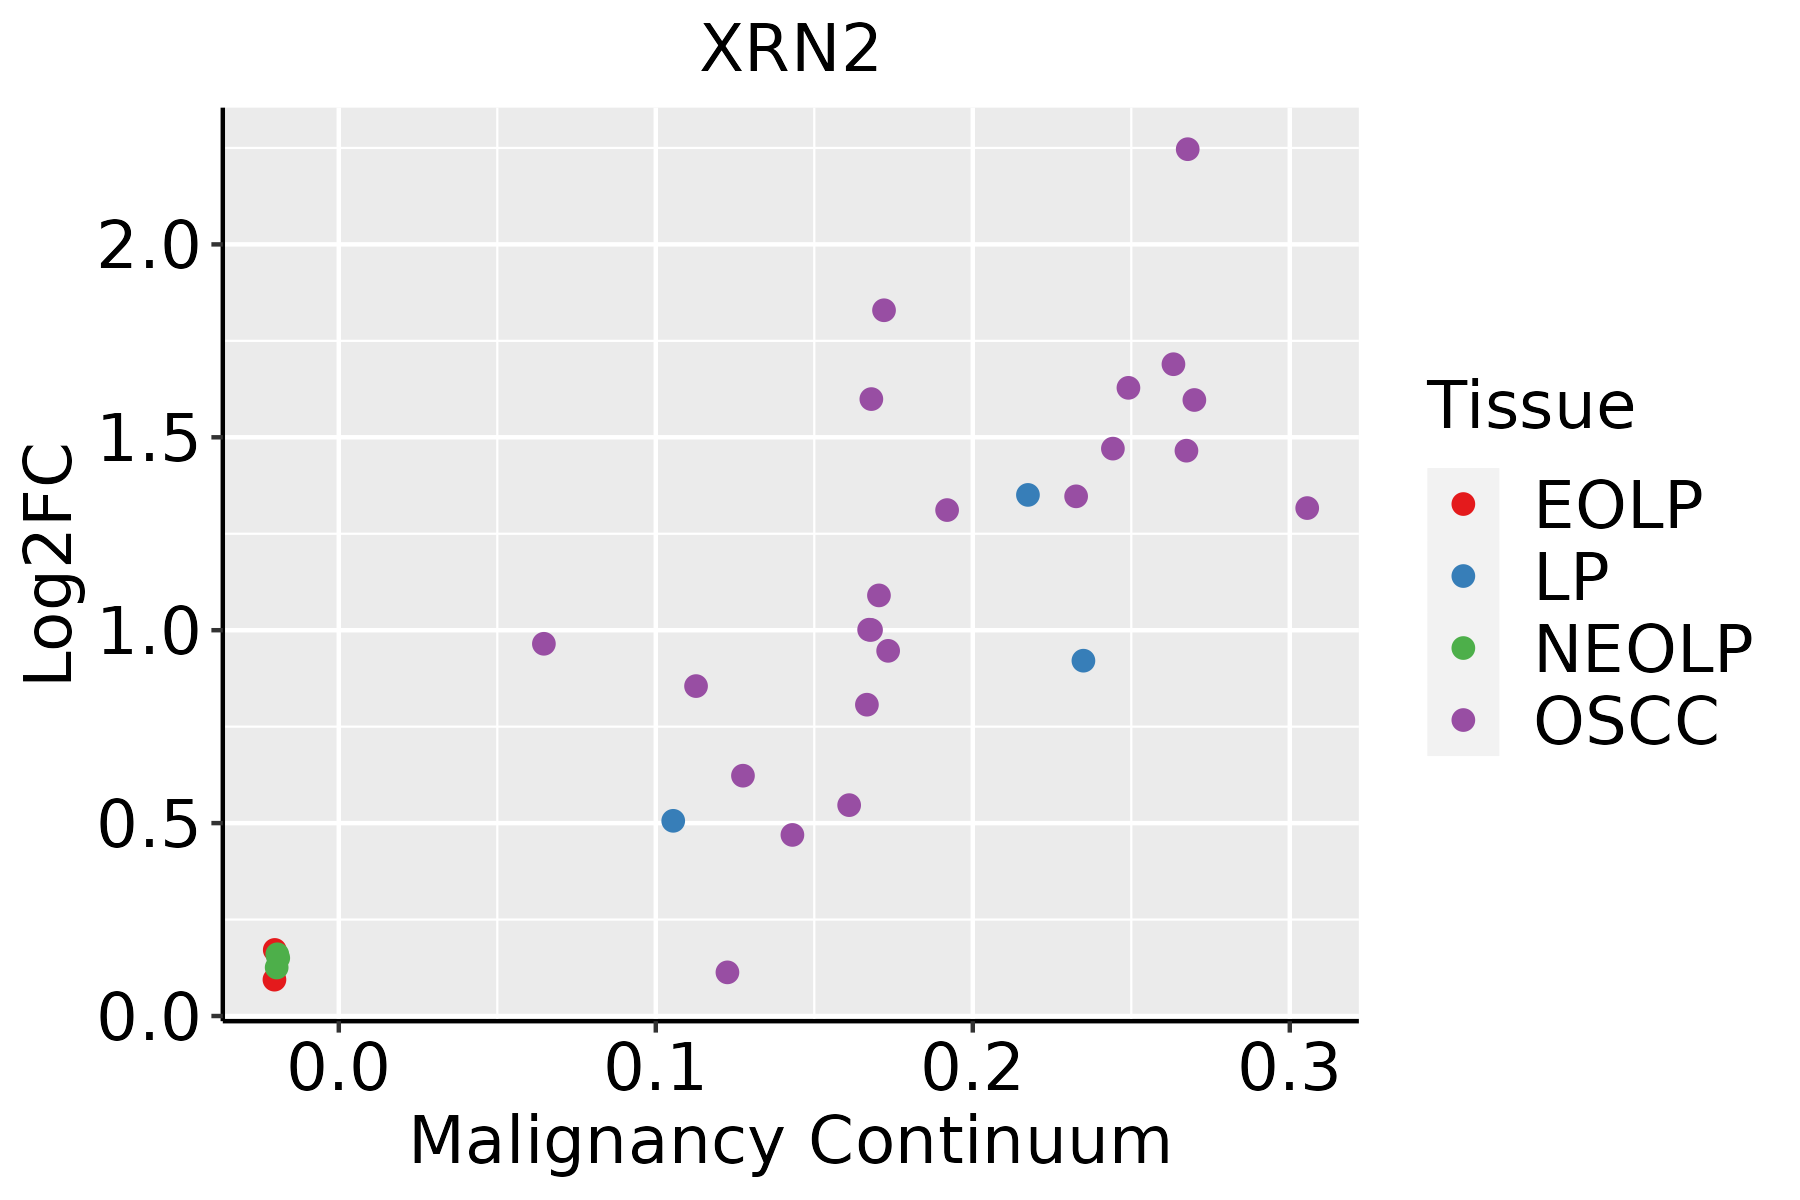 | EOLP: Erosive Oral lichen planus |
| LP: leukoplakia | ||
| NEOLP: Non-erosive oral lichen planus | ||
| OSCC: Oral squamous cell carcinoma | ||
| Prostate |  | BPH: Benign Prostatic Hyperplasia |
| Skin | 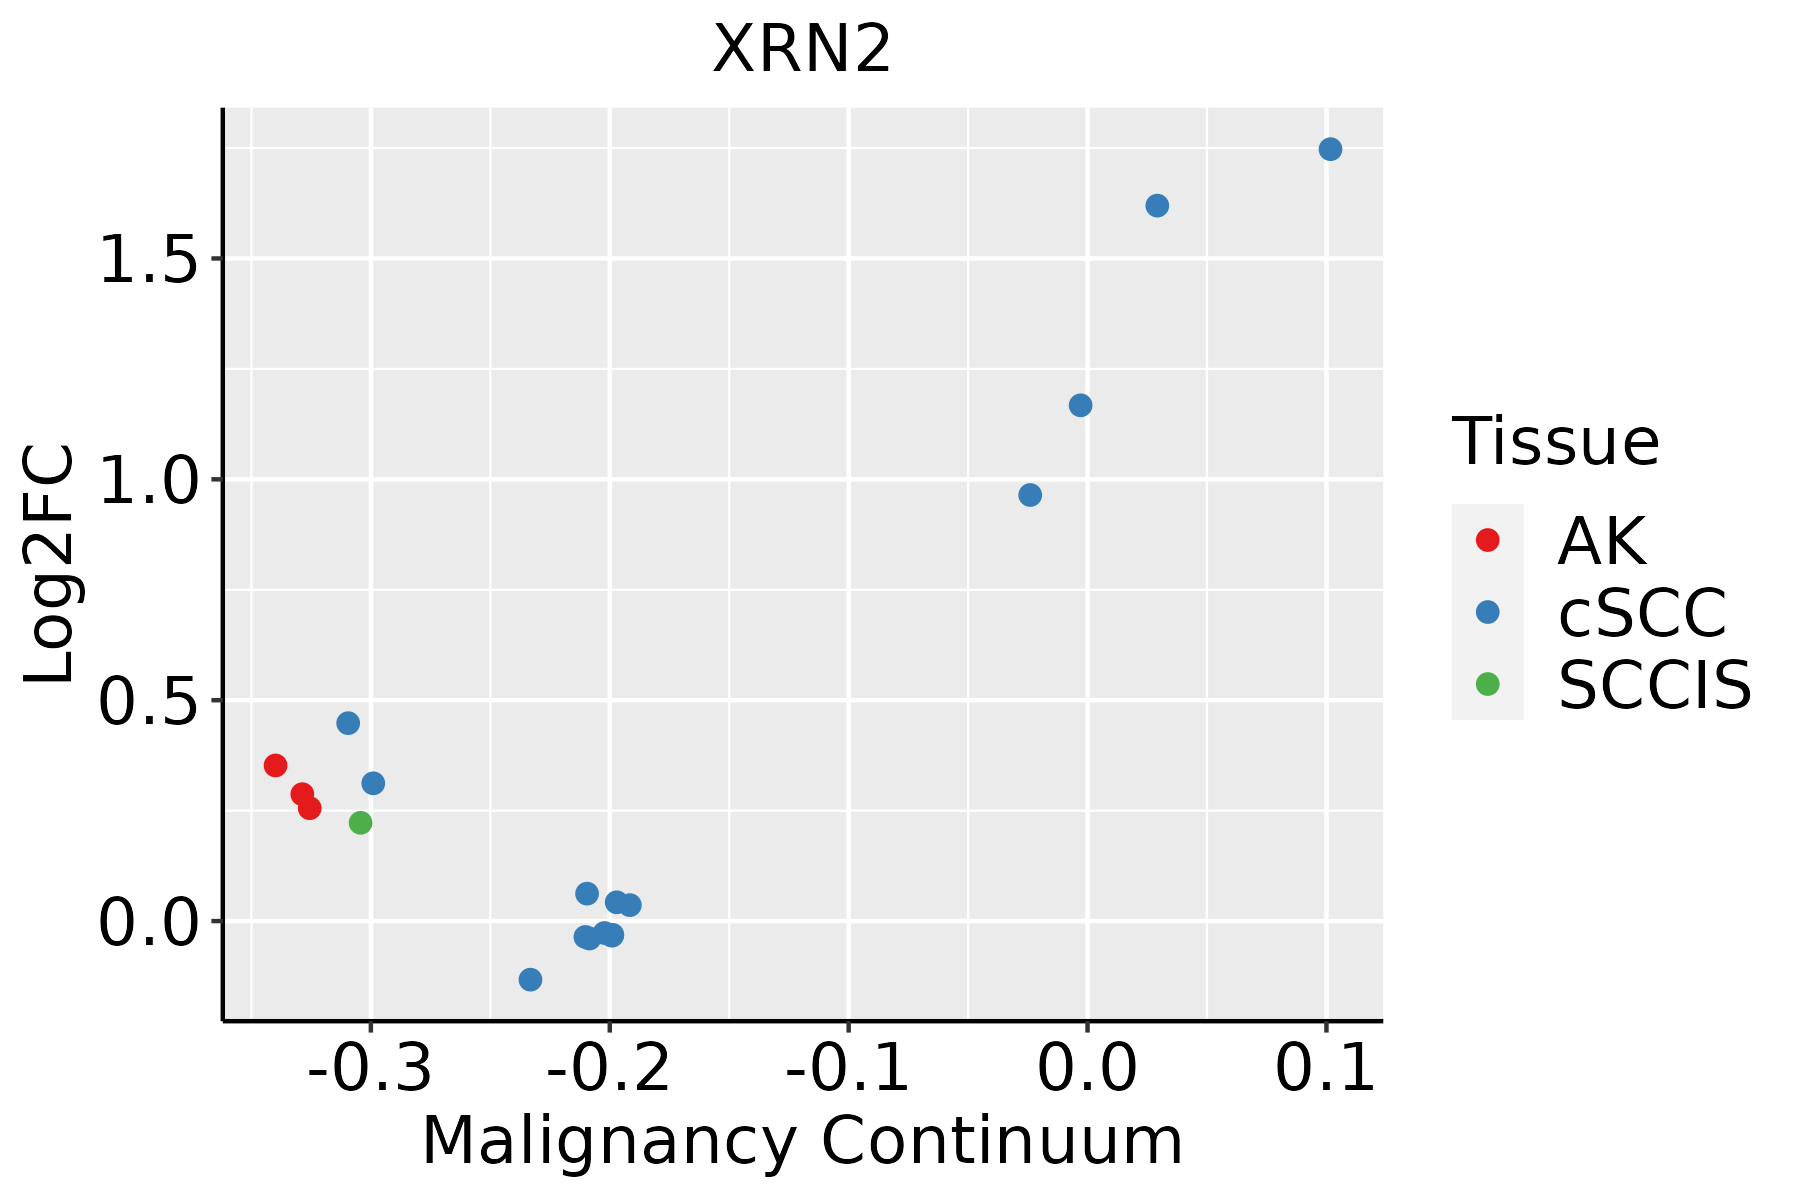 | AK: Actinic keratosis |
| cSCC: Cutaneous squamous cell carcinoma | ||
| SCCIS:squamous cell carcinoma in situ | ||
| Thyroid |  | ATC: Anaplastic thyroid cancer |
| HT: Hashimoto's thyroiditis | ||
| PTC: Papillary thyroid cancer |
| ∗log2FC in expression of this searched gene in stem-like cells from each diseased tissue sample relative to stem-like cells in normal samples in each tissue plotted against the malignancy continuum. Samples are colored based on if they are from different disease stage. |
Top |
Malignant transformation related pathway analysis |
| Find out the enriched GO biological processes and KEGG pathways involved in transition from healthy to precancer to cancer |
| Tissue | Disease Stage | Enriched GO biological Processes |
| Colorectum | AD |  |
| Colorectum | SER |  |
| Colorectum | MSS |  |
| Colorectum | MSI-H |  |
| Colorectum | FAP |  |
| ∗Top 15 enriched GO BP terms are showed in the bar plot of each disease state in each tissue. Each row represents a significant GO biological process which is colored according to the -log10(p.adjust). |
| Page: 1 2 3 4 5 6 7 8 9 |
| GO ID | Tissue | Disease Stage | Description | Gene Ratio | Bg Ratio | pvalue | p.adjust | Count |
| GO:003447021 | Thyroid | ATC | ncRNA processing | 216/6293 | 395/18723 | 3.14e-18 | 3.98e-16 | 216 |
| GO:000640227 | Thyroid | ATC | mRNA catabolic process | 140/6293 | 232/18723 | 5.08e-17 | 4.65e-15 | 140 |
| GO:003465525 | Thyroid | ATC | nucleobase-containing compound catabolic process | 217/6293 | 407/18723 | 1.20e-16 | 1.04e-14 | 217 |
| GO:000095624 | Thyroid | ATC | nuclear-transcribed mRNA catabolic process | 78/6293 | 112/18723 | 6.44e-15 | 4.07e-13 | 78 |
| GO:004670024 | Thyroid | ATC | heterocycle catabolic process | 228/6293 | 445/18723 | 7.26e-15 | 4.50e-13 | 228 |
| GO:004427025 | Thyroid | ATC | cellular nitrogen compound catabolic process | 229/6293 | 451/18723 | 2.25e-14 | 1.27e-12 | 229 |
| GO:003466021 | Thyroid | ATC | ncRNA metabolic process | 240/6293 | 485/18723 | 2.03e-13 | 9.91e-12 | 240 |
| GO:001943924 | Thyroid | ATC | aromatic compound catabolic process | 232/6293 | 467/18723 | 3.05e-13 | 1.44e-11 | 232 |
| GO:190136124 | Thyroid | ATC | organic cyclic compound catabolic process | 238/6293 | 495/18723 | 1.12e-11 | 4.12e-10 | 238 |
| GO:009050112 | Thyroid | ATC | RNA phosphodiester bond hydrolysis | 76/6293 | 152/18723 | 2.07e-05 | 1.86e-04 | 76 |
| GO:009050312 | Thyroid | ATC | RNA phosphodiester bond hydrolysis, exonucleolytic | 27/6293 | 42/18723 | 4.62e-05 | 3.70e-04 | 27 |
| GO:003090015 | Thyroid | ATC | forebrain development | 164/6293 | 379/18723 | 4.85e-05 | 3.87e-04 | 164 |
| GO:002153712 | Thyroid | ATC | telencephalon development | 113/6293 | 248/18723 | 5.61e-05 | 4.32e-04 | 113 |
| GO:002154312 | Thyroid | ATC | pallium development | 81/6293 | 169/18723 | 7.67e-05 | 5.80e-04 | 81 |
| GO:0021766 | Thyroid | ATC | hippocampus development | 38/6293 | 80/18723 | 6.84e-03 | 2.72e-02 | 38 |
| GO:009030511 | Thyroid | ATC | nucleic acid phosphodiester bond hydrolysis | 107/6293 | 261/18723 | 7.21e-03 | 2.84e-02 | 107 |
| GO:0021761 | Thyroid | ATC | limbic system development | 48/6293 | 107/18723 | 9.97e-03 | 3.63e-02 | 48 |
| Page: 1 2 3 4 5 6 7 8 9 10 11 12 13 |
| Pathway ID | Tissue | Disease Stage | Description | Gene Ratio | Bg Ratio | pvalue | p.adjust | qvalue | Count |
| hsa0301810 | Esophagus | HGIN | RNA degradation | 27/1383 | 79/8465 | 7.73e-05 | 9.00e-04 | 7.15e-04 | 27 |
| hsa0301815 | Esophagus | HGIN | RNA degradation | 27/1383 | 79/8465 | 7.73e-05 | 9.00e-04 | 7.15e-04 | 27 |
| hsa0301824 | Esophagus | ESCC | RNA degradation | 62/4205 | 79/8465 | 1.18e-07 | 9.39e-07 | 4.81e-07 | 62 |
| hsa0301834 | Esophagus | ESCC | RNA degradation | 62/4205 | 79/8465 | 1.18e-07 | 9.39e-07 | 4.81e-07 | 62 |
| hsa03018 | Liver | Cirrhotic | RNA degradation | 44/2530 | 79/8465 | 1.43e-06 | 1.65e-05 | 1.02e-05 | 44 |
| hsa030181 | Liver | Cirrhotic | RNA degradation | 44/2530 | 79/8465 | 1.43e-06 | 1.65e-05 | 1.02e-05 | 44 |
| hsa030182 | Liver | HCC | RNA degradation | 58/4020 | 79/8465 | 2.29e-06 | 2.19e-05 | 1.22e-05 | 58 |
| hsa030183 | Liver | HCC | RNA degradation | 58/4020 | 79/8465 | 2.29e-06 | 2.19e-05 | 1.22e-05 | 58 |
| hsa030189 | Oral cavity | OSCC | RNA degradation | 59/3704 | 79/8465 | 2.05e-08 | 1.91e-07 | 9.70e-08 | 59 |
| hsa0301814 | Oral cavity | OSCC | RNA degradation | 59/3704 | 79/8465 | 2.05e-08 | 1.91e-07 | 9.70e-08 | 59 |
| hsa0301823 | Oral cavity | LP | RNA degradation | 39/2418 | 79/8465 | 6.98e-05 | 4.38e-04 | 2.83e-04 | 39 |
| hsa0301833 | Oral cavity | LP | RNA degradation | 39/2418 | 79/8465 | 6.98e-05 | 4.38e-04 | 2.83e-04 | 39 |
| hsa0301841 | Oral cavity | EOLP | RNA degradation | 22/1218 | 79/8465 | 1.33e-03 | 4.80e-03 | 2.83e-03 | 22 |
| hsa0301851 | Oral cavity | EOLP | RNA degradation | 22/1218 | 79/8465 | 1.33e-03 | 4.80e-03 | 2.83e-03 | 22 |
| hsa0301861 | Oral cavity | NEOLP | RNA degradation | 18/1112 | 79/8465 | 1.25e-02 | 4.06e-02 | 2.56e-02 | 18 |
| hsa0301871 | Oral cavity | NEOLP | RNA degradation | 18/1112 | 79/8465 | 1.25e-02 | 4.06e-02 | 2.56e-02 | 18 |
| hsa030188 | Prostate | BPH | RNA degradation | 29/1718 | 79/8465 | 5.17e-04 | 2.67e-03 | 1.65e-03 | 29 |
| hsa0301813 | Prostate | BPH | RNA degradation | 29/1718 | 79/8465 | 5.17e-04 | 2.67e-03 | 1.65e-03 | 29 |
| hsa0301822 | Prostate | Tumor | RNA degradation | 30/1791 | 79/8465 | 4.48e-04 | 2.35e-03 | 1.46e-03 | 30 |
| hsa0301832 | Prostate | Tumor | RNA degradation | 30/1791 | 79/8465 | 4.48e-04 | 2.35e-03 | 1.46e-03 | 30 |
| Page: 1 |
Top |
Cell-cell communication analysis |
| Identification of potential cell-cell interactions between two cell types and their ligand-receptor pairs for different disease states |
| Ligand | Receptor | LRpair | Pathway | Tissue | Disease Stage |
| Page: 1 |
Top |
Single-cell gene regulatory network inference analysis |
| Find out the significant the regulons (TFs) and the target genes of each regulon across cell types for different disease states |
| TF | Cell Type | Tissue | Disease Stage | Target Gene | RSS | Regulon Activity |
| ∗The dot plots of a searched regulon are shown for all cell subpopulations in each disease state of each tissue based on the regulon specific score inferred using pySCENIC and by calculating the average expression. |
| Page: 1 |
Top |
Somatic mutation of malignant transformation related genes |
| Annotation of somatic variants for genes involved in malignant transformation |
| Hugo Symbol | Variant Class | Variant Classification | dbSNP RS | HGVSc | HGVSp | HGVSp Short | SWISSPROT | BIOTYPE | SIFT | PolyPhen | Tumor Sample Barcode | Tissue | Histology | Sex | Age | Stage | Therapy Types | Drugs | Outcome |
| XRN2 | SNV | Missense_Mutation | c.310N>A | p.Gly104Arg | p.G104R | Q9H0D6 | protein_coding | deleterious(0) | probably_damaging(1) | TCGA-AO-A03L-01 | Breast | breast invasive carcinoma | Female | <65 | III/IV | Chemotherapy | cyclophosphamide | SD | |
| XRN2 | SNV | Missense_Mutation | rs376273044 | c.1844N>A | p.Arg615Gln | p.R615Q | Q9H0D6 | protein_coding | tolerated(0.39) | benign(0.019) | TCGA-AO-A12D-01 | Breast | breast invasive carcinoma | Female | <65 | I/II | Chemotherapy | cyclophosphamide | SD |
| XRN2 | SNV | Missense_Mutation | rs746894001 | c.1084N>T | p.Arg362Cys | p.R362C | Q9H0D6 | protein_coding | deleterious(0) | probably_damaging(0.994) | TCGA-D8-A1JJ-01 | Breast | breast invasive carcinoma | Female | <65 | I/II | Chemotherapy | doxorubicine | SD |
| XRN2 | SNV | Missense_Mutation | c.2755N>G | p.Pro919Ala | p.P919A | Q9H0D6 | protein_coding | tolerated_low_confidence(0.65) | benign(0) | TCGA-C5-A1M8-01 | Cervix | cervical & endocervical cancer | Female | <65 | I/II | Unknown | Unknown | SD | |
| XRN2 | SNV | Missense_Mutation | novel | c.2285A>T | p.Glu762Val | p.E762V | Q9H0D6 | protein_coding | tolerated(0.06) | benign(0.156) | TCGA-MA-AA3Z-01 | Cervix | cervical & endocervical cancer | Female | <65 | I/II | Unknown | Unknown | SD |
| XRN2 | SNV | Missense_Mutation | c.322N>T | p.Arg108Cys | p.R108C | Q9H0D6 | protein_coding | deleterious(0) | probably_damaging(1) | TCGA-AA-3663-01 | Colorectum | colon adenocarcinoma | Male | <65 | I/II | Unknown | Unknown | SD | |
| XRN2 | SNV | Missense_Mutation | c.664N>T | p.Asp222Tyr | p.D222Y | Q9H0D6 | protein_coding | deleterious(0) | probably_damaging(0.999) | TCGA-AA-3977-01 | Colorectum | colon adenocarcinoma | Male | >=65 | I/II | Unknown | Unknown | SD | |
| XRN2 | SNV | Missense_Mutation | novel | c.113C>T | p.Ala38Val | p.A38V | Q9H0D6 | protein_coding | tolerated(0.09) | benign(0.012) | TCGA-AA-3984-01 | Colorectum | colon adenocarcinoma | Female | <65 | I/II | Unknown | Unknown | SD |
| XRN2 | SNV | Missense_Mutation | rs377677641 | c.2377N>T | p.Arg793Trp | p.R793W | Q9H0D6 | protein_coding | deleterious(0) | possibly_damaging(0.613) | TCGA-AA-A01R-01 | Colorectum | colon adenocarcinoma | Male | <65 | III/IV | Chemotherapy | 5-fluorouracil | PD |
| XRN2 | SNV | Missense_Mutation | rs753036714 | c.1843N>T | p.Arg615Trp | p.R615W | Q9H0D6 | protein_coding | deleterious(0.01) | probably_damaging(0.948) | TCGA-AM-5821-01 | Colorectum | colon adenocarcinoma | Female | >=65 | I/II | Unknown | Unknown | SD |
| Page: 1 2 3 4 5 6 7 8 9 10 11 |
Top |
Related drugs of malignant transformation related genes |
| Identification of chemicals and drugs interact with genes involved in malignant transfromation |
| (DGIdb 4.0) |
| Entrez ID | Symbol | Category | Interaction Types | Drug Claim Name | Drug Name | PMIDs |
| Page: 1 |

Copyright 2023-Present -The University of Texas Health Science Center at Houston |