
|
|||||
|
 | |
| |
| |
| |
| |
| |
|
Gene: TRIM4 |
Gene summary for TRIM4 |
| Gene information | Species | Human | Gene symbol | TRIM4 | Gene ID | 89122 |
| Gene name | tripartite motif containing 4 | |
| Gene Alias | RNF87 | |
| Cytomap | 7q22.1 | |
| Gene Type | protein-coding | GO ID | GO:0002376 | UniProtAcc | Q9C037 |
Top |
Malignant transformation analysis |
| Identification of the aberrant gene expression in precancerous and cancerous lesions by comparing the gene expression of stem-like cells in diseased tissues with normal stem cells |
| Entrez ID | Symbol | Replicates | Species | Organ | Tissue | Adj P-value | Log2FC | Malignancy |
| 89122 | TRIM4 | LZE20T | Human | Esophagus | ESCC | 1.71e-05 | 1.72e-01 | 0.0662 |
| 89122 | TRIM4 | LZE24T | Human | Esophagus | ESCC | 2.70e-18 | 4.06e-01 | 0.0596 |
| 89122 | TRIM4 | LZE21T | Human | Esophagus | ESCC | 4.17e-02 | 1.52e-01 | 0.0655 |
| 89122 | TRIM4 | P1T-E | Human | Esophagus | ESCC | 7.49e-11 | 3.85e-01 | 0.0875 |
| 89122 | TRIM4 | P2T-E | Human | Esophagus | ESCC | 8.99e-36 | 5.74e-01 | 0.1177 |
| 89122 | TRIM4 | P4T-E | Human | Esophagus | ESCC | 1.50e-27 | 3.87e-01 | 0.1323 |
| 89122 | TRIM4 | P5T-E | Human | Esophagus | ESCC | 6.28e-07 | 1.37e-01 | 0.1327 |
| 89122 | TRIM4 | P8T-E | Human | Esophagus | ESCC | 3.13e-12 | 2.09e-01 | 0.0889 |
| 89122 | TRIM4 | P9T-E | Human | Esophagus | ESCC | 1.63e-13 | 2.30e-01 | 0.1131 |
| 89122 | TRIM4 | P10T-E | Human | Esophagus | ESCC | 1.30e-24 | 4.19e-01 | 0.116 |
| 89122 | TRIM4 | P11T-E | Human | Esophagus | ESCC | 1.07e-14 | 4.24e-01 | 0.1426 |
| 89122 | TRIM4 | P12T-E | Human | Esophagus | ESCC | 2.99e-29 | 5.69e-01 | 0.1122 |
| 89122 | TRIM4 | P15T-E | Human | Esophagus | ESCC | 1.32e-38 | 7.19e-01 | 0.1149 |
| 89122 | TRIM4 | P16T-E | Human | Esophagus | ESCC | 1.10e-49 | 8.42e-01 | 0.1153 |
| 89122 | TRIM4 | P17T-E | Human | Esophagus | ESCC | 1.77e-12 | 3.78e-01 | 0.1278 |
| 89122 | TRIM4 | P19T-E | Human | Esophagus | ESCC | 2.26e-10 | 4.13e-01 | 0.1662 |
| 89122 | TRIM4 | P20T-E | Human | Esophagus | ESCC | 1.23e-35 | 7.51e-01 | 0.1124 |
| 89122 | TRIM4 | P21T-E | Human | Esophagus | ESCC | 2.61e-13 | 2.82e-01 | 0.1617 |
| 89122 | TRIM4 | P22T-E | Human | Esophagus | ESCC | 3.64e-15 | 2.09e-01 | 0.1236 |
| 89122 | TRIM4 | P23T-E | Human | Esophagus | ESCC | 6.27e-40 | 8.50e-01 | 0.108 |
| Page: 1 2 3 4 5 |
| Tissue | Expression Dynamics | Abbreviation |
| Esophagus |  | ESCC: Esophageal squamous cell carcinoma |
| HGIN: High-grade intraepithelial neoplasias | ||
| LGIN: Low-grade intraepithelial neoplasias | ||
| Liver | 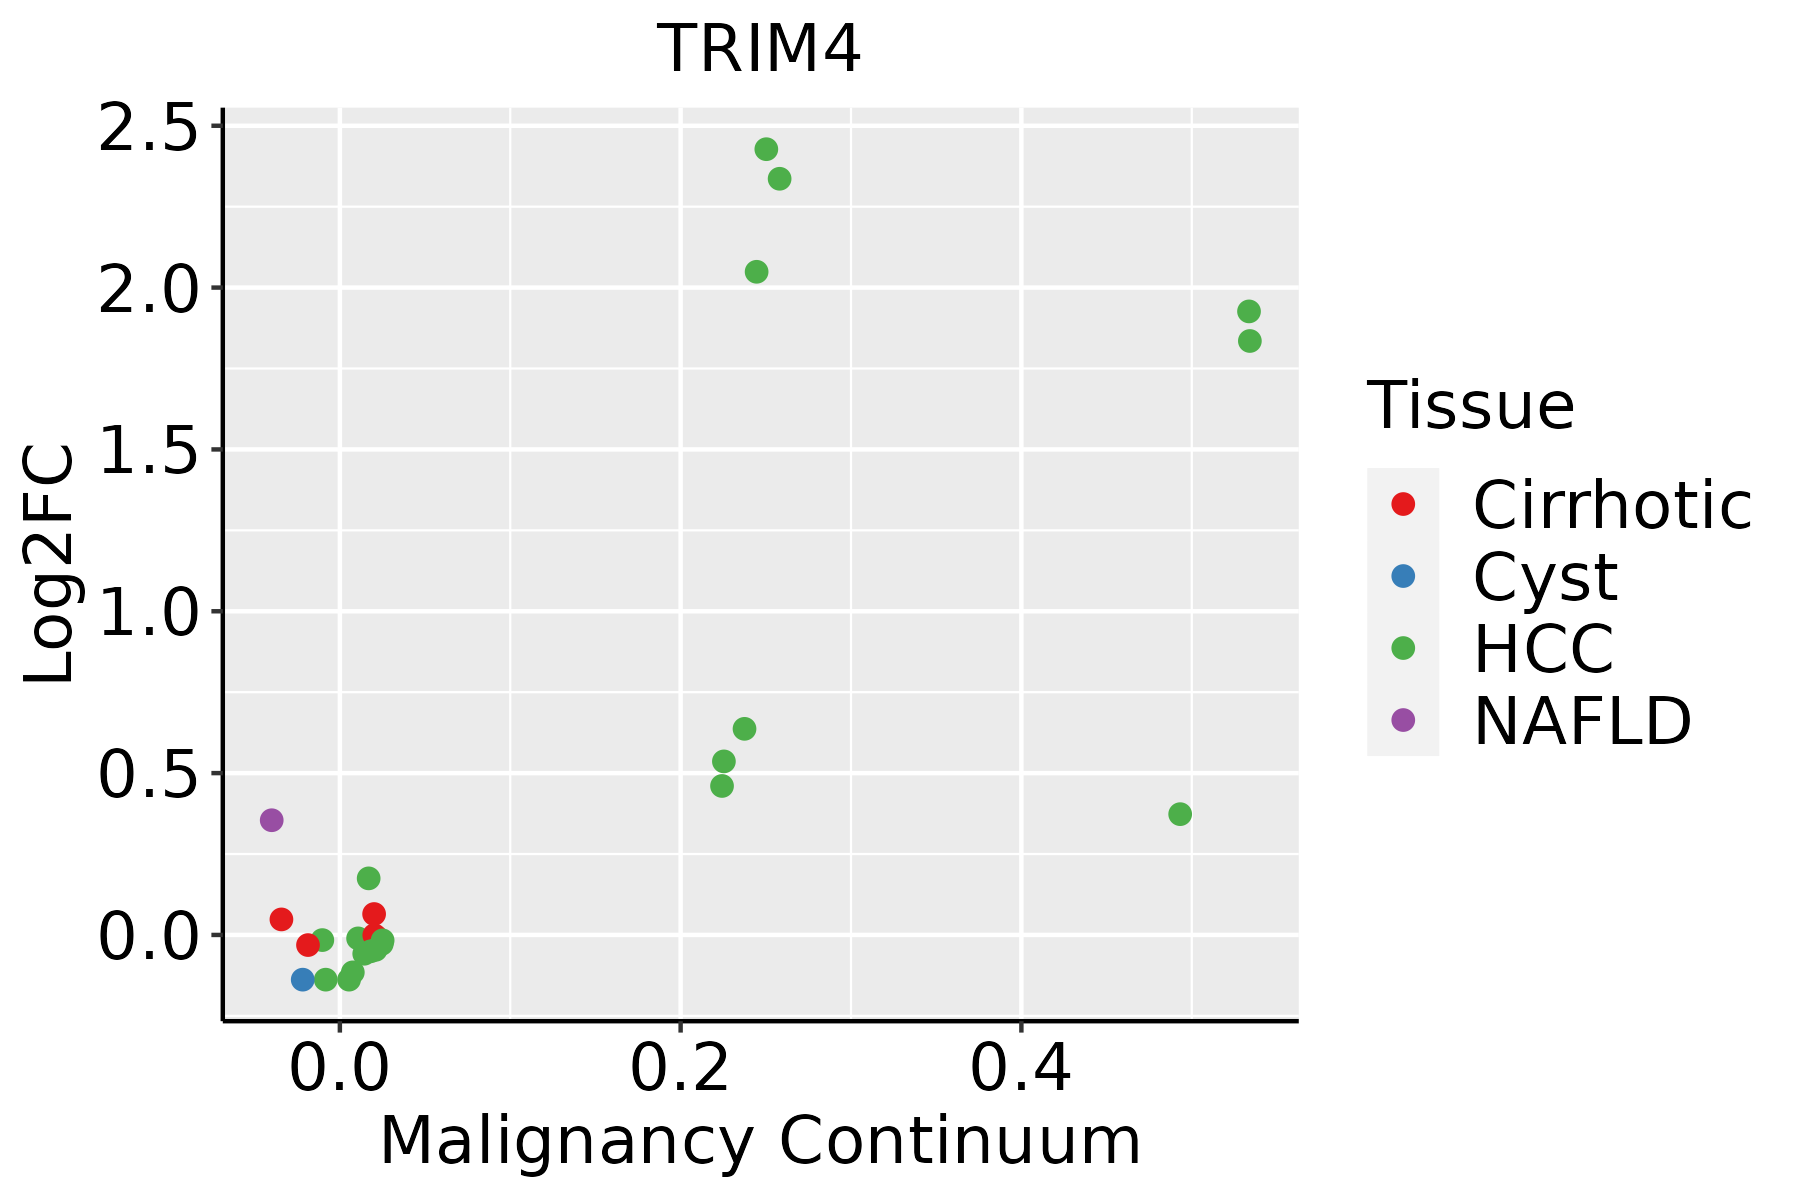 | HCC: Hepatocellular carcinoma |
| NAFLD: Non-alcoholic fatty liver disease | ||
| Thyroid | 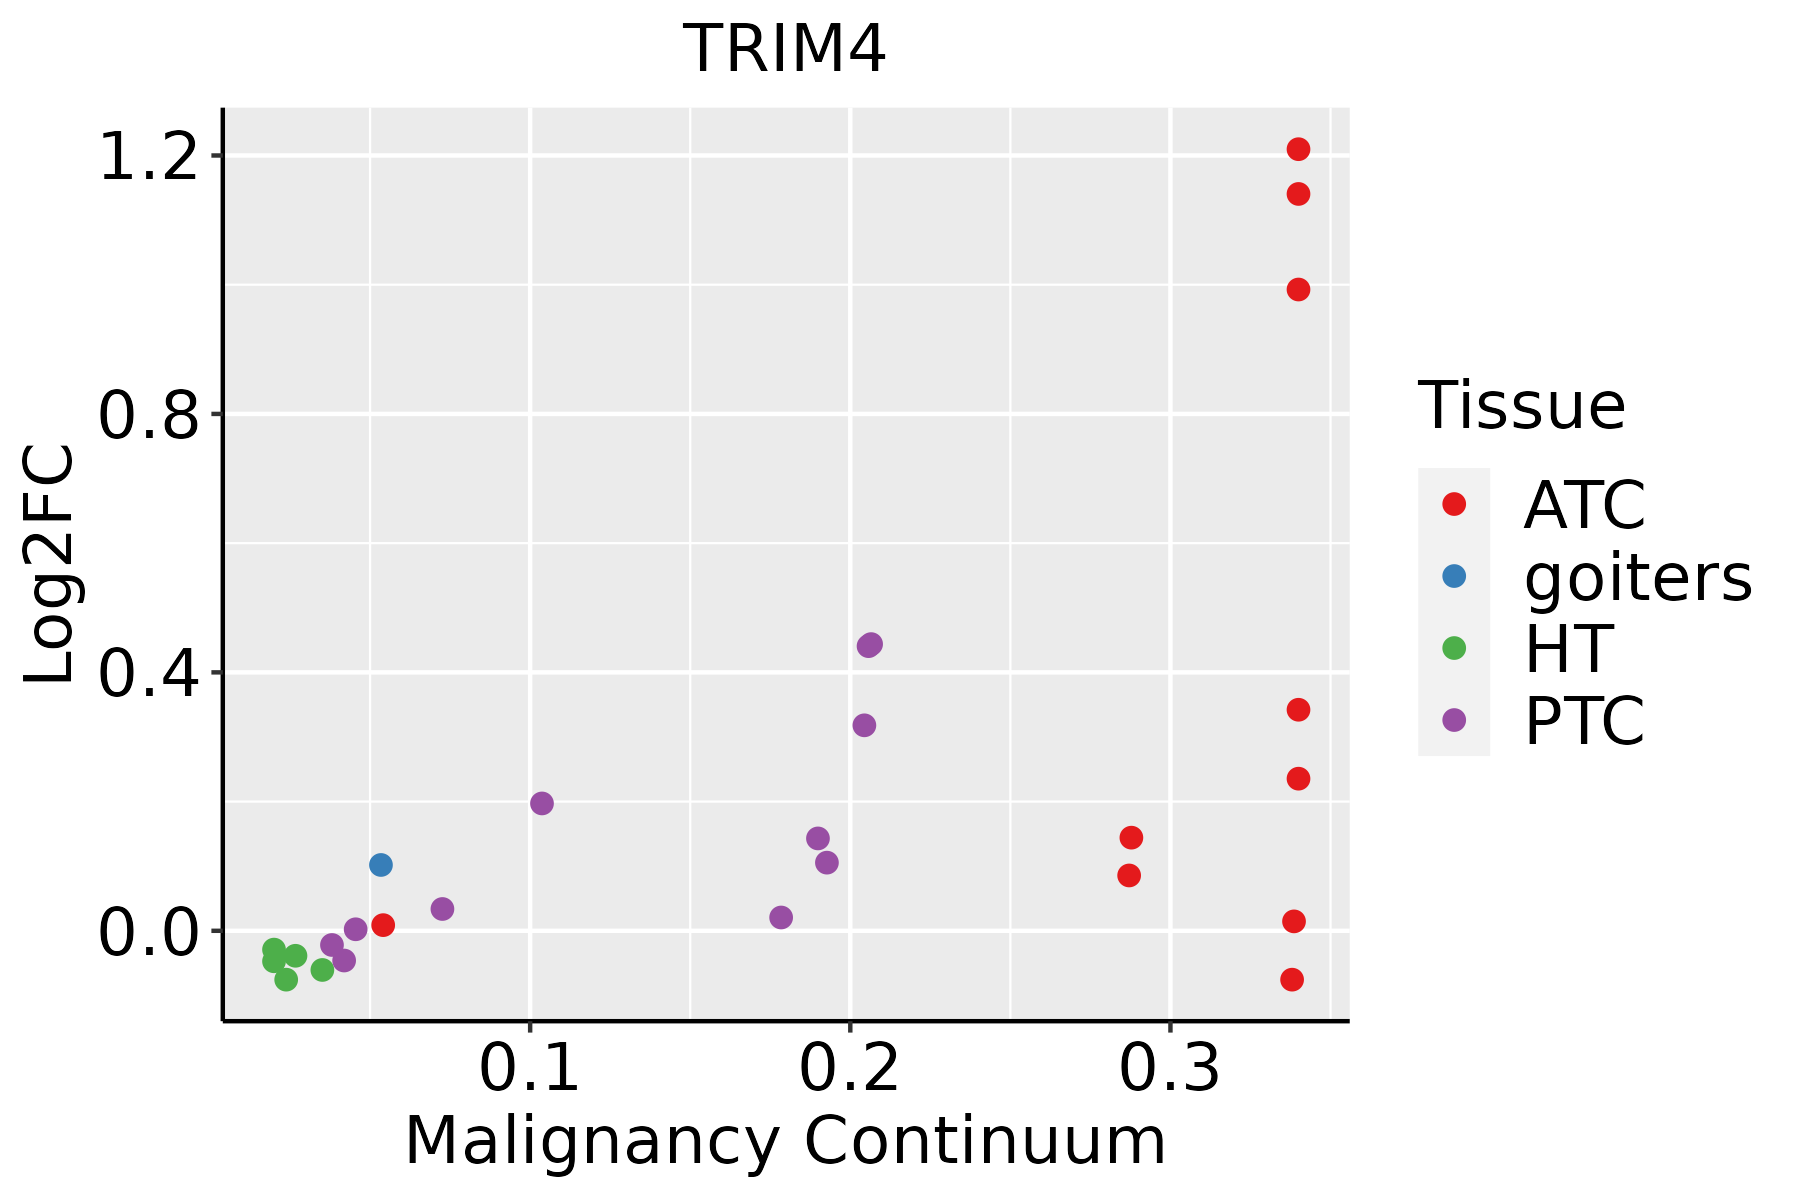 | ATC: Anaplastic thyroid cancer |
| HT: Hashimoto's thyroiditis | ||
| PTC: Papillary thyroid cancer |
| ∗log2FC in expression of this searched gene in stem-like cells from each diseased tissue sample relative to stem-like cells in normal samples in each tissue plotted against the malignancy continuum. Samples are colored based on if they are from different disease stage. |
Top |
Malignant transformation related pathway analysis |
| Find out the enriched GO biological processes and KEGG pathways involved in transition from healthy to precancer to cancer |
| Tissue | Disease Stage | Enriched GO biological Processes |
| Colorectum | AD |  |
| Colorectum | SER |  |
| Colorectum | MSS |  |
| Colorectum | MSI-H |  |
| Colorectum | FAP |  |
| ∗Top 15 enriched GO BP terms are showed in the bar plot of each disease state in each tissue. Each row represents a significant GO biological process which is colored according to the -log10(p.adjust). |
| Page: 1 2 3 4 5 6 7 8 9 |
| GO ID | Tissue | Disease Stage | Description | Gene Ratio | Bg Ratio | pvalue | p.adjust | Count |
| GO:003139718 | Prostate | BPH | negative regulation of protein ubiquitination | 33/3107 | 83/18723 | 4.07e-07 | 8.42e-06 | 33 |
| GO:00709368 | Prostate | BPH | protein K48-linked ubiquitination | 26/3107 | 65/18723 | 5.90e-06 | 8.64e-05 | 26 |
| GO:00002099 | Prostate | BPH | protein polyubiquitination | 64/3107 | 236/18723 | 2.83e-05 | 3.31e-04 | 64 |
| GO:19012245 | Prostate | BPH | positive regulation of NIK/NF-kappaB signaling | 25/3107 | 69/18723 | 6.41e-05 | 6.37e-04 | 25 |
| GO:00380613 | Prostate | BPH | NIK/NF-kappaB signaling | 42/3107 | 143/18723 | 9.53e-05 | 8.92e-04 | 42 |
| GO:19012223 | Prostate | BPH | regulation of NIK/NF-kappaB signaling | 34/3107 | 112/18723 | 2.13e-04 | 1.73e-03 | 34 |
| GO:003164719 | Prostate | Tumor | regulation of protein stability | 112/3246 | 298/18723 | 4.18e-17 | 1.18e-14 | 112 |
| GO:190332019 | Prostate | Tumor | regulation of protein modification by small protein conjugation or removal | 92/3246 | 242/18723 | 1.20e-14 | 1.73e-12 | 92 |
| GO:005082119 | Prostate | Tumor | protein stabilization | 76/3246 | 191/18723 | 1.55e-13 | 1.73e-11 | 76 |
| GO:003139619 | Prostate | Tumor | regulation of protein ubiquitination | 76/3246 | 210/18723 | 3.96e-11 | 2.68e-09 | 76 |
| GO:190332119 | Prostate | Tumor | negative regulation of protein modification by small protein conjugation or removal | 38/3246 | 95/18723 | 1.49e-07 | 3.76e-06 | 38 |
| GO:003139719 | Prostate | Tumor | negative regulation of protein ubiquitination | 34/3246 | 83/18723 | 3.41e-07 | 7.67e-06 | 34 |
| GO:000961514 | Prostate | Tumor | response to virus | 101/3246 | 367/18723 | 6.40e-07 | 1.32e-05 | 101 |
| GO:007093615 | Prostate | Tumor | protein K48-linked ubiquitination | 26/3246 | 65/18723 | 1.33e-05 | 1.83e-04 | 26 |
| GO:000020914 | Prostate | Tumor | protein polyubiquitination | 64/3246 | 236/18723 | 1.08e-04 | 1.03e-03 | 64 |
| GO:190122412 | Prostate | Tumor | positive regulation of NIK/NF-kappaB signaling | 25/3246 | 69/18723 | 1.33e-04 | 1.23e-03 | 25 |
| GO:003806111 | Prostate | Tumor | NIK/NF-kappaB signaling | 42/3246 | 143/18723 | 2.56e-04 | 2.14e-03 | 42 |
| GO:190122211 | Prostate | Tumor | regulation of NIK/NF-kappaB signaling | 34/3246 | 112/18723 | 4.92e-04 | 3.64e-03 | 34 |
| GO:00516073 | Prostate | Tumor | defense response to virus | 62/3246 | 265/18723 | 6.92e-03 | 3.13e-02 | 62 |
| GO:01405463 | Prostate | Tumor | defense response to symbiont | 62/3246 | 265/18723 | 6.92e-03 | 3.13e-02 | 62 |
| Page: 1 2 3 4 5 6 7 8 9 10 11 12 13 14 15 |
| Pathway ID | Tissue | Disease Stage | Description | Gene Ratio | Bg Ratio | pvalue | p.adjust | qvalue | Count |
| Page: 1 |
Top |
Cell-cell communication analysis |
| Identification of potential cell-cell interactions between two cell types and their ligand-receptor pairs for different disease states |
| Ligand | Receptor | LRpair | Pathway | Tissue | Disease Stage |
| Page: 1 |
Top |
Single-cell gene regulatory network inference analysis |
| Find out the significant the regulons (TFs) and the target genes of each regulon across cell types for different disease states |
| TF | Cell Type | Tissue | Disease Stage | Target Gene | RSS | Regulon Activity |
| ∗The dot plots of a searched regulon are shown for all cell subpopulations in each disease state of each tissue based on the regulon specific score inferred using pySCENIC and by calculating the average expression. |
| Page: 1 |
Top |
Somatic mutation of malignant transformation related genes |
| Annotation of somatic variants for genes involved in malignant transformation |
| Hugo Symbol | Variant Class | Variant Classification | dbSNP RS | HGVSc | HGVSp | HGVSp Short | SWISSPROT | BIOTYPE | SIFT | PolyPhen | Tumor Sample Barcode | Tissue | Histology | Sex | Age | Stage | Therapy Types | Drugs | Outcome |
| TRIM4 | SNV | Missense_Mutation | rs746597075 | c.369N>G | p.Ile123Met | p.I123M | Q9C037 | protein_coding | tolerated(0.1) | benign(0.013) | TCGA-AC-A23H-01 | Breast | breast invasive carcinoma | Female | >=65 | I/II | Unknown | Unknown | PD |
| TRIM4 | SNV | Missense_Mutation | novel | c.1252G>T | p.Ala418Ser | p.A418S | Q9C037 | protein_coding | deleterious(0.03) | benign(0.171) | TCGA-AN-A046-01 | Breast | breast invasive carcinoma | Female | >=65 | I/II | Unknown | Unknown | SD |
| TRIM4 | SNV | Missense_Mutation | rs773415980 | c.1220G>A | p.Arg407His | p.R407H | Q9C037 | protein_coding | tolerated(0.09) | benign(0) | TCGA-A6-6653-01 | Colorectum | colon adenocarcinoma | Male | >=65 | I/II | Unknown | Unknown | SD |
| TRIM4 | SNV | Missense_Mutation | c.663N>T | p.Leu221Phe | p.L221F | Q9C037 | protein_coding | deleterious(0) | probably_damaging(0.986) | TCGA-AA-3510-01 | Colorectum | colon adenocarcinoma | Male | >=65 | I/II | Unknown | Unknown | SD | |
| TRIM4 | SNV | Missense_Mutation | novel | c.1085G>T | p.Arg362Ile | p.R362I | Q9C037 | protein_coding | deleterious(0) | benign(0.309) | TCGA-AA-3984-01 | Colorectum | colon adenocarcinoma | Female | <65 | I/II | Unknown | Unknown | SD |
| TRIM4 | SNV | Missense_Mutation | c.790C>G | p.Leu264Val | p.L264V | Q9C037 | protein_coding | deleterious(0.01) | probably_damaging(0.952) | TCGA-AA-A01K-01 | Colorectum | colon adenocarcinoma | Female | >=65 | III/IV | Chemotherapy | folinic | CR | |
| TRIM4 | SNV | Missense_Mutation | novel | c.932N>A | p.Leu311Gln | p.L311Q | Q9C037 | protein_coding | deleterious(0.05) | benign(0.272) | TCGA-AM-5820-01 | Colorectum | colon adenocarcinoma | Female | <65 | I/II | Unknown | Unknown | SD |
| TRIM4 | SNV | Missense_Mutation | c.1030G>A | p.Ala344Thr | p.A344T | Q9C037 | protein_coding | tolerated(0.15) | probably_damaging(0.977) | TCGA-WS-AB45-01 | Colorectum | colon adenocarcinoma | Female | <65 | I/II | Unknown | Unknown | SD | |
| TRIM4 | SNV | Missense_Mutation | novel | c.593G>T | p.Arg198Ile | p.R198I | Q9C037 | protein_coding | deleterious(0.04) | probably_damaging(0.979) | TCGA-AG-A002-01 | Colorectum | rectum adenocarcinoma | Male | <65 | I/II | Unknown | Unknown | SD |
| TRIM4 | deletion | Frame_Shift_Del | c.1118delA | p.Asn373ThrfsTer57 | p.N373Tfs*57 | Q9C037 | protein_coding | TCGA-AA-3815-01 | Colorectum | colon adenocarcinoma | Female | >=65 | I/II | Unknown | Unknown | SD |
| Page: 1 2 3 4 5 |
Top |
Related drugs of malignant transformation related genes |
| Identification of chemicals and drugs interact with genes involved in malignant transfromation |
| (DGIdb 4.0) |
| Entrez ID | Symbol | Category | Interaction Types | Drug Claim Name | Drug Name | PMIDs |
| Page: 1 |

Copyright 2023-Present -The University of Texas Health Science Center at Houston |