
|
|||||
|
 | |
| |
| |
| |
| |
| |
|
Gene: TREM2 |
Gene summary for TREM2 |
| Gene information | Species | Human | Gene symbol | TREM2 | Gene ID | 54209 |
| Gene name | triggering receptor expressed on myeloid cells 2 | |
| Gene Alias | PLOSL2 | |
| Cytomap | 6p21.1 | |
| Gene Type | protein-coding | GO ID | GO:0000165 | UniProtAcc | Q9NZC2 |
Top |
Malignant transformation analysis |
| Identification of the aberrant gene expression in precancerous and cancerous lesions by comparing the gene expression of stem-like cells in diseased tissues with normal stem cells |
| Entrez ID | Symbol | Replicates | Species | Organ | Tissue | Adj P-value | Log2FC | Malignancy |
| 54209 | TREM2 | LZE6T | Human | Esophagus | ESCC | 9.93e-10 | 8.88e-01 | 0.0845 |
| 54209 | TREM2 | P16T-E | Human | Esophagus | ESCC | 6.19e-93 | 3.57e+00 | 0.1153 |
| 54209 | TREM2 | P17T-E | Human | Esophagus | ESCC | 4.70e-13 | 1.06e+00 | 0.1278 |
| 54209 | TREM2 | P22T-E | Human | Esophagus | ESCC | 7.95e-19 | 4.67e-01 | 0.1236 |
| 54209 | TREM2 | P56T-E | Human | Esophagus | ESCC | 8.17e-06 | 1.05e+00 | 0.1613 |
| 54209 | TREM2 | P65T-E | Human | Esophagus | ESCC | 3.48e-10 | 6.06e-01 | 0.0978 |
| 54209 | TREM2 | P74T-E | Human | Esophagus | ESCC | 1.66e-21 | 1.07e+00 | 0.1479 |
| 54209 | TREM2 | P76T-E | Human | Esophagus | ESCC | 1.99e-15 | 1.48e+00 | 0.1207 |
| 54209 | TREM2 | P83T-E | Human | Esophagus | ESCC | 3.65e-03 | 2.26e-01 | 0.1738 |
| 54209 | TREM2 | P107T-E | Human | Esophagus | ESCC | 4.07e-24 | 1.21e+00 | 0.171 |
| 54209 | TREM2 | C04 | Human | Oral cavity | OSCC | 1.62e-38 | 2.16e+00 | 0.2633 |
| 54209 | TREM2 | C21 | Human | Oral cavity | OSCC | 4.07e-23 | 7.57e-01 | 0.2678 |
| 54209 | TREM2 | C30 | Human | Oral cavity | OSCC | 8.42e-14 | 6.37e-01 | 0.3055 |
| 54209 | TREM2 | C06 | Human | Oral cavity | OSCC | 6.22e-04 | 7.50e-01 | 0.2699 |
| 54209 | TREM2 | C07 | Human | Oral cavity | OSCC | 8.27e-07 | 2.11e+00 | 0.2491 |
| 54209 | TREM2 | LN22 | Human | Oral cavity | OSCC | 3.59e-16 | 2.07e+00 | 0.1733 |
| 54209 | TREM2 | SYSMH2 | Human | Oral cavity | OSCC | 9.26e-07 | 2.78e-01 | 0.2326 |
| 54209 | TREM2 | SYSMH3 | Human | Oral cavity | OSCC | 1.63e-40 | 1.28e+00 | 0.2442 |
| 54209 | TREM2 | SYSMH6 | Human | Oral cavity | OSCC | 1.66e-02 | 4.92e-01 | 0.1275 |
| Page: 1 |
| Tissue | Expression Dynamics | Abbreviation |
| Esophagus | 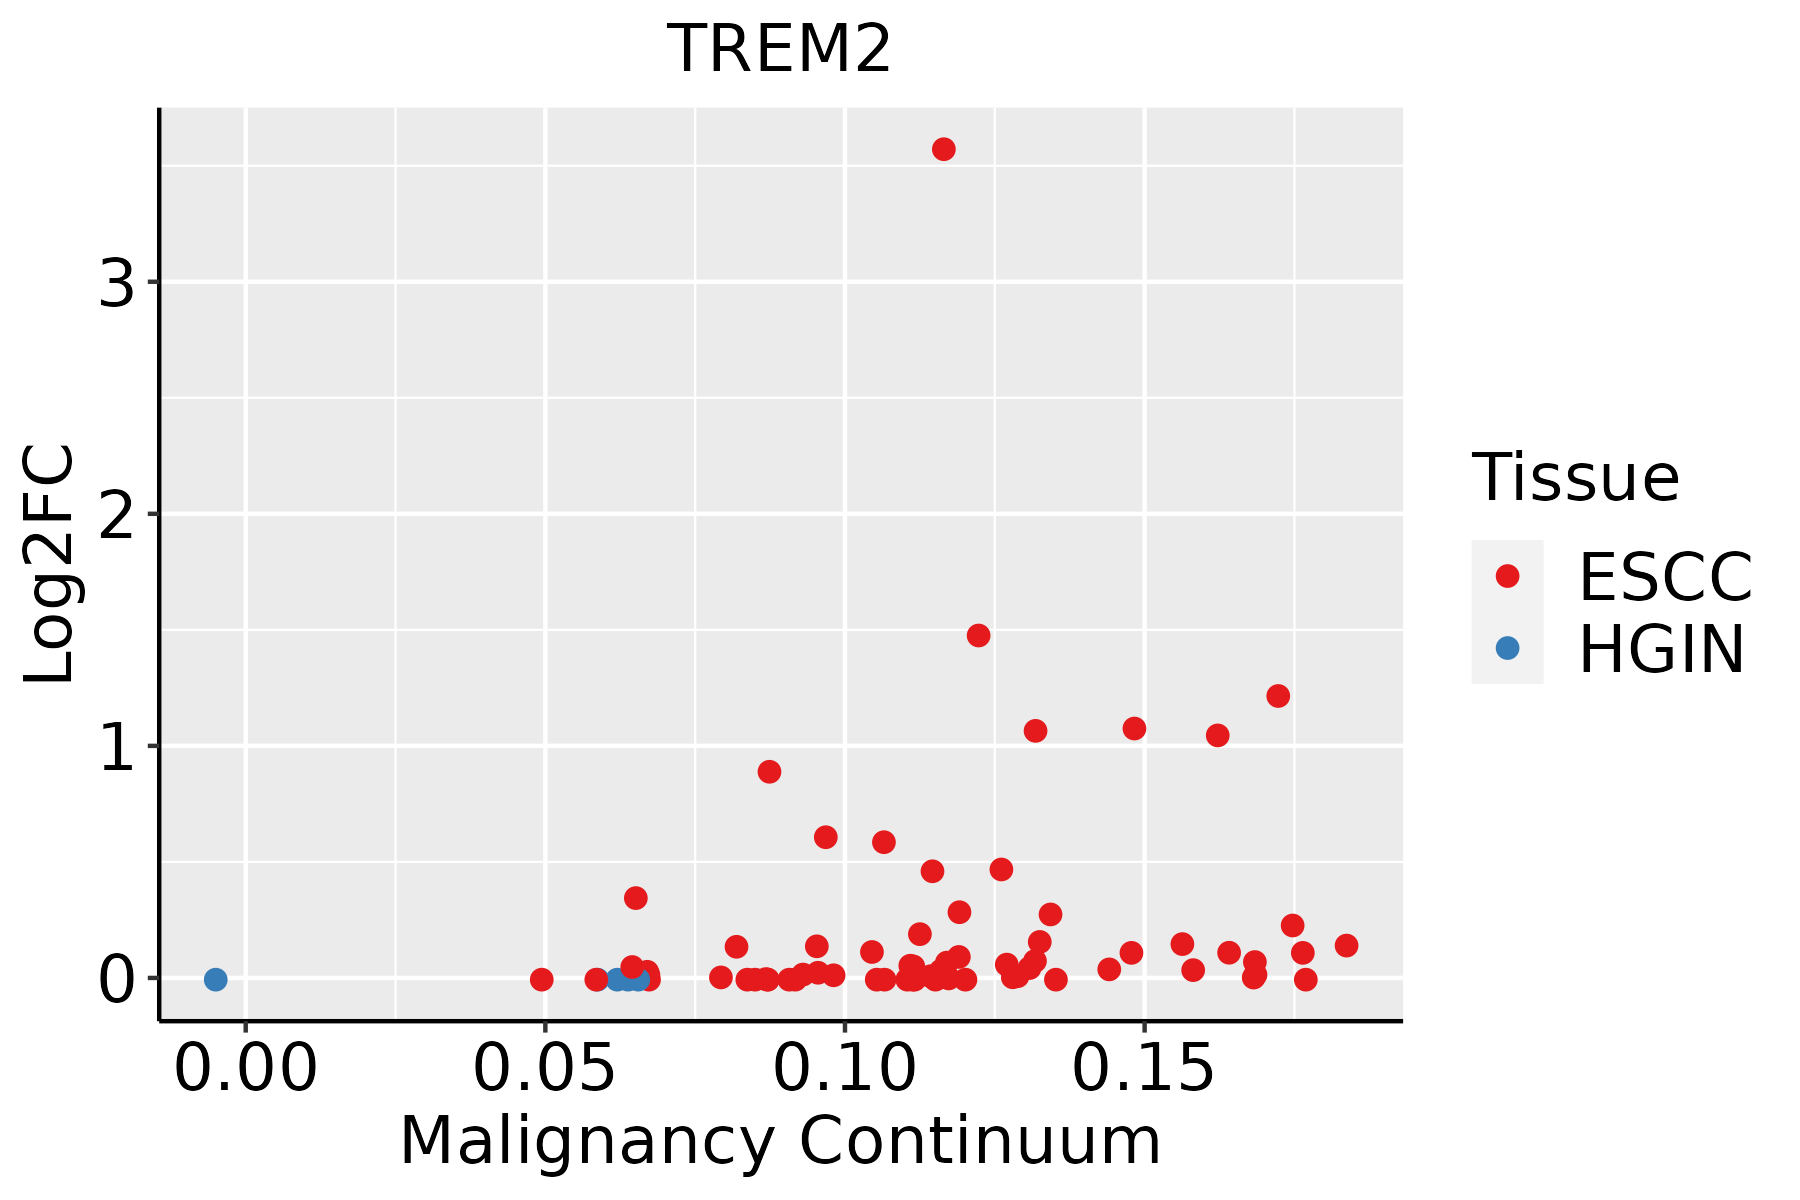 | ESCC: Esophageal squamous cell carcinoma |
| HGIN: High-grade intraepithelial neoplasias | ||
| LGIN: Low-grade intraepithelial neoplasias | ||
| Oral Cavity | 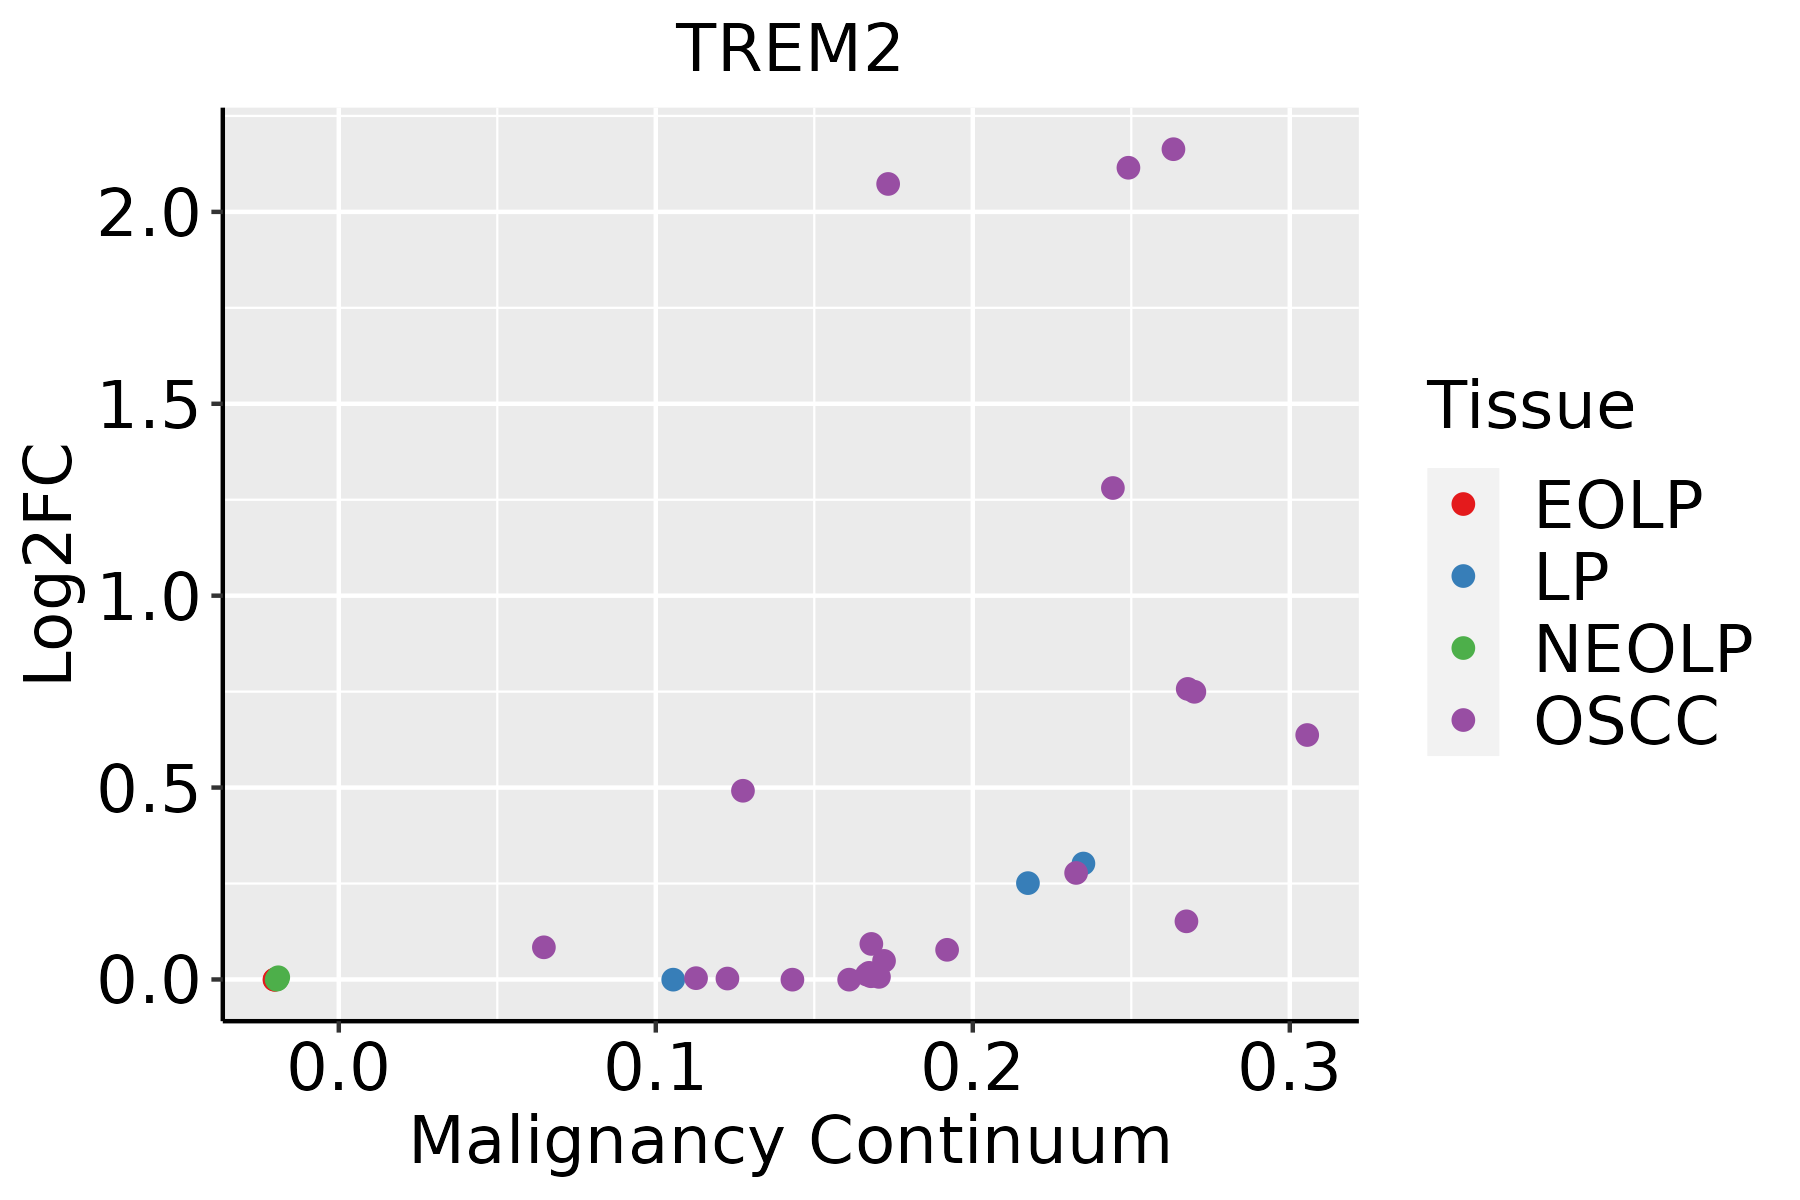 | EOLP: Erosive Oral lichen planus |
| LP: leukoplakia | ||
| NEOLP: Non-erosive oral lichen planus | ||
| OSCC: Oral squamous cell carcinoma |
| ∗log2FC in expression of this searched gene in stem-like cells from each diseased tissue sample relative to stem-like cells in normal samples in each tissue plotted against the malignancy continuum. Samples are colored based on if they are from different disease stage. |
Top |
Malignant transformation related pathway analysis |
| Find out the enriched GO biological processes and KEGG pathways involved in transition from healthy to precancer to cancer |
| Tissue | Disease Stage | Enriched GO biological Processes |
| Colorectum | AD |  |
| Colorectum | SER |  |
| Colorectum | MSS |  |
| Colorectum | MSI-H |  |
| Colorectum | FAP |  |
| ∗Top 15 enriched GO BP terms are showed in the bar plot of each disease state in each tissue. Each row represents a significant GO biological process which is colored according to the -log10(p.adjust). |
| Page: 1 2 3 4 5 6 7 8 9 |
| GO ID | Tissue | Disease Stage | Description | Gene Ratio | Bg Ratio | pvalue | p.adjust | Count |
| GO:00105075 | Oral cavity | OSCC | negative regulation of autophagy | 51/7305 | 85/18723 | 7.08e-05 | 5.62e-04 | 51 |
| GO:190437716 | Oral cavity | OSCC | positive regulation of protein localization to cell periphery | 43/7305 | 69/18723 | 7.43e-05 | 5.81e-04 | 43 |
| GO:000974320 | Oral cavity | OSCC | response to carbohydrate | 128/7305 | 253/18723 | 1.11e-04 | 8.16e-04 | 128 |
| GO:00380614 | Oral cavity | OSCC | NIK/NF-kappaB signaling | 78/7305 | 143/18723 | 1.14e-04 | 8.35e-04 | 78 |
| GO:190307815 | Oral cavity | OSCC | positive regulation of protein localization to plasma membrane | 39/7305 | 62/18723 | 1.19e-04 | 8.54e-04 | 39 |
| GO:007252120 | Oral cavity | OSCC | purine-containing compound metabolic process | 199/7305 | 416/18723 | 1.34e-04 | 9.53e-04 | 199 |
| GO:000915020 | Oral cavity | OSCC | purine ribonucleotide metabolic process | 178/7305 | 368/18723 | 1.45e-04 | 1.02e-03 | 178 |
| GO:000268510 | Oral cavity | OSCC | regulation of leukocyte migration | 108/7305 | 210/18723 | 1.63e-04 | 1.13e-03 | 108 |
| GO:00321037 | Oral cavity | OSCC | positive regulation of response to external stimulus | 203/7305 | 427/18723 | 1.79e-04 | 1.22e-03 | 203 |
| GO:00607604 | Oral cavity | OSCC | positive regulation of response to cytokine stimulus | 36/7305 | 57/18723 | 1.91e-04 | 1.28e-03 | 36 |
| GO:00192214 | Oral cavity | OSCC | cytokine-mediated signaling pathway | 222/7305 | 472/18723 | 2.02e-04 | 1.35e-03 | 222 |
| GO:00509216 | Oral cavity | OSCC | positive regulation of chemotaxis | 76/7305 | 141/18723 | 2.30e-04 | 1.49e-03 | 76 |
| GO:003428420 | Oral cavity | OSCC | response to monosaccharide | 114/7305 | 225/18723 | 2.37e-04 | 1.54e-03 | 114 |
| GO:007121910 | Oral cavity | OSCC | cellular response to molecule of bacterial origin | 112/7305 | 221/18723 | 2.64e-04 | 1.69e-03 | 112 |
| GO:00019614 | Oral cavity | OSCC | positive regulation of cytokine-mediated signaling pathway | 32/7305 | 50/18723 | 3.02e-04 | 1.89e-03 | 32 |
| GO:000616320 | Oral cavity | OSCC | purine nucleotide metabolic process | 188/7305 | 396/18723 | 3.31e-04 | 2.04e-03 | 188 |
| GO:00182123 | Oral cavity | OSCC | peptidyl-tyrosine modification | 180/7305 | 378/18723 | 3.63e-04 | 2.22e-03 | 180 |
| GO:000268310 | Oral cavity | OSCC | negative regulation of immune system process | 204/7305 | 434/18723 | 3.72e-04 | 2.27e-03 | 204 |
| GO:005090010 | Oral cavity | OSCC | leukocyte migration | 176/7305 | 369/18723 | 3.80e-04 | 2.31e-03 | 176 |
| GO:004563720 | Oral cavity | OSCC | regulation of myeloid cell differentiation | 106/7305 | 210/18723 | 4.58e-04 | 2.76e-03 | 106 |
| Page: 1 2 3 4 5 6 7 8 9 10 11 12 13 14 15 16 17 |
| Pathway ID | Tissue | Disease Stage | Description | Gene Ratio | Bg Ratio | pvalue | p.adjust | qvalue | Count |
| hsa043806 | Oral cavity | OSCC | Osteoclast differentiation | 73/3704 | 128/8465 | 1.60e-03 | 4.44e-03 | 2.26e-03 | 73 |
| hsa0438011 | Oral cavity | OSCC | Osteoclast differentiation | 73/3704 | 128/8465 | 1.60e-03 | 4.44e-03 | 2.26e-03 | 73 |
| Page: 1 |
Top |
Cell-cell communication analysis |
| Identification of potential cell-cell interactions between two cell types and their ligand-receptor pairs for different disease states |
| Ligand | Receptor | LRpair | Pathway | Tissue | Disease Stage |
| Page: 1 |
Top |
Single-cell gene regulatory network inference analysis |
| Find out the significant the regulons (TFs) and the target genes of each regulon across cell types for different disease states |
| TF | Cell Type | Tissue | Disease Stage | Target Gene | RSS | Regulon Activity |
| ∗The dot plots of a searched regulon are shown for all cell subpopulations in each disease state of each tissue based on the regulon specific score inferred using pySCENIC and by calculating the average expression. |
| Page: 1 |
Top |
Somatic mutation of malignant transformation related genes |
| Annotation of somatic variants for genes involved in malignant transformation |
| Hugo Symbol | Variant Class | Variant Classification | dbSNP RS | HGVSc | HGVSp | HGVSp Short | SWISSPROT | BIOTYPE | SIFT | PolyPhen | Tumor Sample Barcode | Tissue | Histology | Sex | Age | Stage | Therapy Types | Drugs | Outcome |
| TREM2 | SNV | Missense_Mutation | novel | c.586N>T | p.Ala196Ser | p.A196S | Q9NZC2 | protein_coding | tolerated(0.05) | benign(0.081) | TCGA-VS-A952-01 | Cervix | cervical & endocervical cancer | Female | >=65 | I/II | Unknown | Unknown | SD |
| TREM2 | SNV | Missense_Mutation | c.523N>G | p.Ile175Val | p.I175V | Q9NZC2 | protein_coding | tolerated(0.59) | benign(0.015) | TCGA-D5-6929-01 | Colorectum | colon adenocarcinoma | Female | <65 | III/IV | Chemotherapy | oxaliplatinum+ | SD | |
| TREM2 | SNV | Missense_Mutation | c.101N>C | p.Val34Ala | p.V34A | Q9NZC2 | protein_coding | deleterious(0) | probably_damaging(0.953) | TCGA-G4-6586-01 | Colorectum | colon adenocarcinoma | Female | >=65 | I/II | Unknown | Unknown | SD | |
| TREM2 | SNV | Missense_Mutation | c.636N>A | p.Asp212Glu | p.D212E | Q9NZC2 | protein_coding | tolerated(0.1) | benign(0.012) | TCGA-AG-A023-01 | Colorectum | rectum adenocarcinoma | Female | <65 | III/IV | Unknown | Unknown | PD | |
| TREM2 | SNV | Missense_Mutation | c.538N>T | p.Ala180Ser | p.A180S | Q9NZC2 | protein_coding | deleterious(0.03) | possibly_damaging(0.669) | TCGA-AJ-A3BG-01 | Endometrium | uterine corpus endometrioid carcinoma | Female | >=65 | I/II | Chemotherapy | carboplatin | PD | |
| TREM2 | SNV | Missense_Mutation | rs764373520 | c.247G>A | p.Ala83Thr | p.A83T | Q9NZC2 | protein_coding | deleterious(0.04) | benign(0.158) | TCGA-AJ-A3EL-01 | Endometrium | uterine corpus endometrioid carcinoma | Female | <65 | I/II | Unknown | Unknown | SD |
| TREM2 | SNV | Missense_Mutation | c.550N>T | p.Leu184Phe | p.L184F | Q9NZC2 | protein_coding | tolerated(0.08) | benign(0.046) | TCGA-AP-A0LM-01 | Endometrium | uterine corpus endometrioid carcinoma | Female | <65 | III/IV | Chemotherapy | cisplatin | SD | |
| TREM2 | SNV | Missense_Mutation | novel | c.262A>C | p.Thr88Pro | p.T88P | Q9NZC2 | protein_coding | tolerated(0.11) | possibly_damaging(0.522) | TCGA-AP-A1DV-01 | Endometrium | uterine corpus endometrioid carcinoma | Female | <65 | I/II | Unknown | Unknown | SD |
| TREM2 | SNV | Missense_Mutation | c.319C>T | p.Leu107Phe | p.L107F | Q9NZC2 | protein_coding | tolerated(0.06) | benign(0.159) | TCGA-AX-A05Z-01 | Endometrium | uterine corpus endometrioid carcinoma | Female | <65 | III/IV | Chemotherapy | adriamycin | SD | |
| TREM2 | SNV | Missense_Mutation | c.335G>A | p.Ser112Asn | p.S112N | Q9NZC2 | protein_coding | deleterious(0.01) | possibly_damaging(0.455) | TCGA-B5-A11E-01 | Endometrium | uterine corpus endometrioid carcinoma | Female | <65 | I/II | Unknown | Unknown | SD |
| Page: 1 2 3 |
Top |
Related drugs of malignant transformation related genes |
| Identification of chemicals and drugs interact with genes involved in malignant transfromation |
| (DGIdb 4.0) |
| Entrez ID | Symbol | Category | Interaction Types | Drug Claim Name | Drug Name | PMIDs |
| Page: 1 |

Copyright 2023-Present -The University of Texas Health Science Center at Houston |