
|
|||||
|
 | |
| |
| |
| |
| |
| |
|
Gene: TEC |
Gene summary for TEC |
| Gene information | Species | Human | Gene symbol | TEC | Gene ID | 100124696 |
| Gene name | transient erythroblastopenia of childhood | |
| Gene Alias | TEC | |
| Cytomap | 19q13.2 | |
| Gene Type | unknown | GO ID | NA | UniProtAcc | NA |
Top |
Malignant transformation analysis |
| Identification of the aberrant gene expression in precancerous and cancerous lesions by comparing the gene expression of stem-like cells in diseased tissues with normal stem cells |
| Entrez ID | Symbol | Replicates | Species | Organ | Tissue | Adj P-value | Log2FC | Malignancy |
| 100124696 | TEC | AEH-subject1 | Human | Endometrium | AEH | 1.44e-17 | 4.52e-01 | -0.3059 |
| 100124696 | TEC | AEH-subject2 | Human | Endometrium | AEH | 7.74e-06 | 3.07e-01 | -0.2525 |
| 100124696 | TEC | AEH-subject3 | Human | Endometrium | AEH | 2.67e-03 | 2.52e-01 | -0.2576 |
| 100124696 | TEC | AEH-subject4 | Human | Endometrium | AEH | 2.15e-12 | 4.94e-01 | -0.2657 |
| 100124696 | TEC | AEH-subject5 | Human | Endometrium | AEH | 9.66e-36 | 8.13e-01 | -0.2953 |
| 100124696 | TEC | EEC-subject1 | Human | Endometrium | EEC | 5.14e-25 | 7.39e-01 | -0.2682 |
| 100124696 | TEC | EEC-subject2 | Human | Endometrium | EEC | 3.84e-05 | 3.05e-01 | -0.2607 |
| 100124696 | TEC | EEC-subject4 | Human | Endometrium | EEC | 3.51e-07 | 3.77e-01 | -0.2571 |
| 100124696 | TEC | EEC-subject5 | Human | Endometrium | EEC | 2.89e-21 | 5.69e-01 | -0.249 |
| 100124696 | TEC | RNA-P17T-P17T-2 | Human | Lung | IAC | 2.13e-03 | 6.56e-01 | 0.3371 |
| 100124696 | TEC | RNA-P17T-P17T-4 | Human | Lung | IAC | 4.71e-02 | 3.97e-01 | 0.343 |
| 100124696 | TEC | RNA-P17T-P17T-6 | Human | Lung | IAC | 1.48e-03 | 5.98e-01 | 0.3385 |
| 100124696 | TEC | RNA-P25T1-P25T1-1 | Human | Lung | AIS | 1.17e-04 | 3.49e-01 | -0.2116 |
| 100124696 | TEC | RNA-P25T1-P25T1-4 | Human | Lung | AIS | 3.15e-03 | 2.67e-01 | -0.2119 |
| 100124696 | TEC | RNA-P6T2-P6T2-1 | Human | Lung | IAC | 3.36e-06 | 3.02e-01 | -0.0166 |
| 100124696 | TEC | RNA-P6T2-P6T2-2 | Human | Lung | IAC | 9.57e-10 | 3.36e-01 | -0.0132 |
| 100124696 | TEC | RNA-P6T2-P6T2-3 | Human | Lung | IAC | 6.44e-09 | 3.14e-01 | -0.013 |
| 100124696 | TEC | RNA-P6T2-P6T2-4 | Human | Lung | IAC | 1.62e-06 | 2.95e-01 | -0.0121 |
| 100124696 | TEC | RNA-P7T1-P7T1-4 | Human | Lung | AIS | 6.30e-03 | 3.47e-01 | -0.0809 |
| 100124696 | TEC | PTC04 | Human | Thyroid | PTC | 9.41e-04 | 1.01e-01 | 0.1927 |
| Page: 1 2 |
| Tissue | Expression Dynamics | Abbreviation |
| Endometrium | 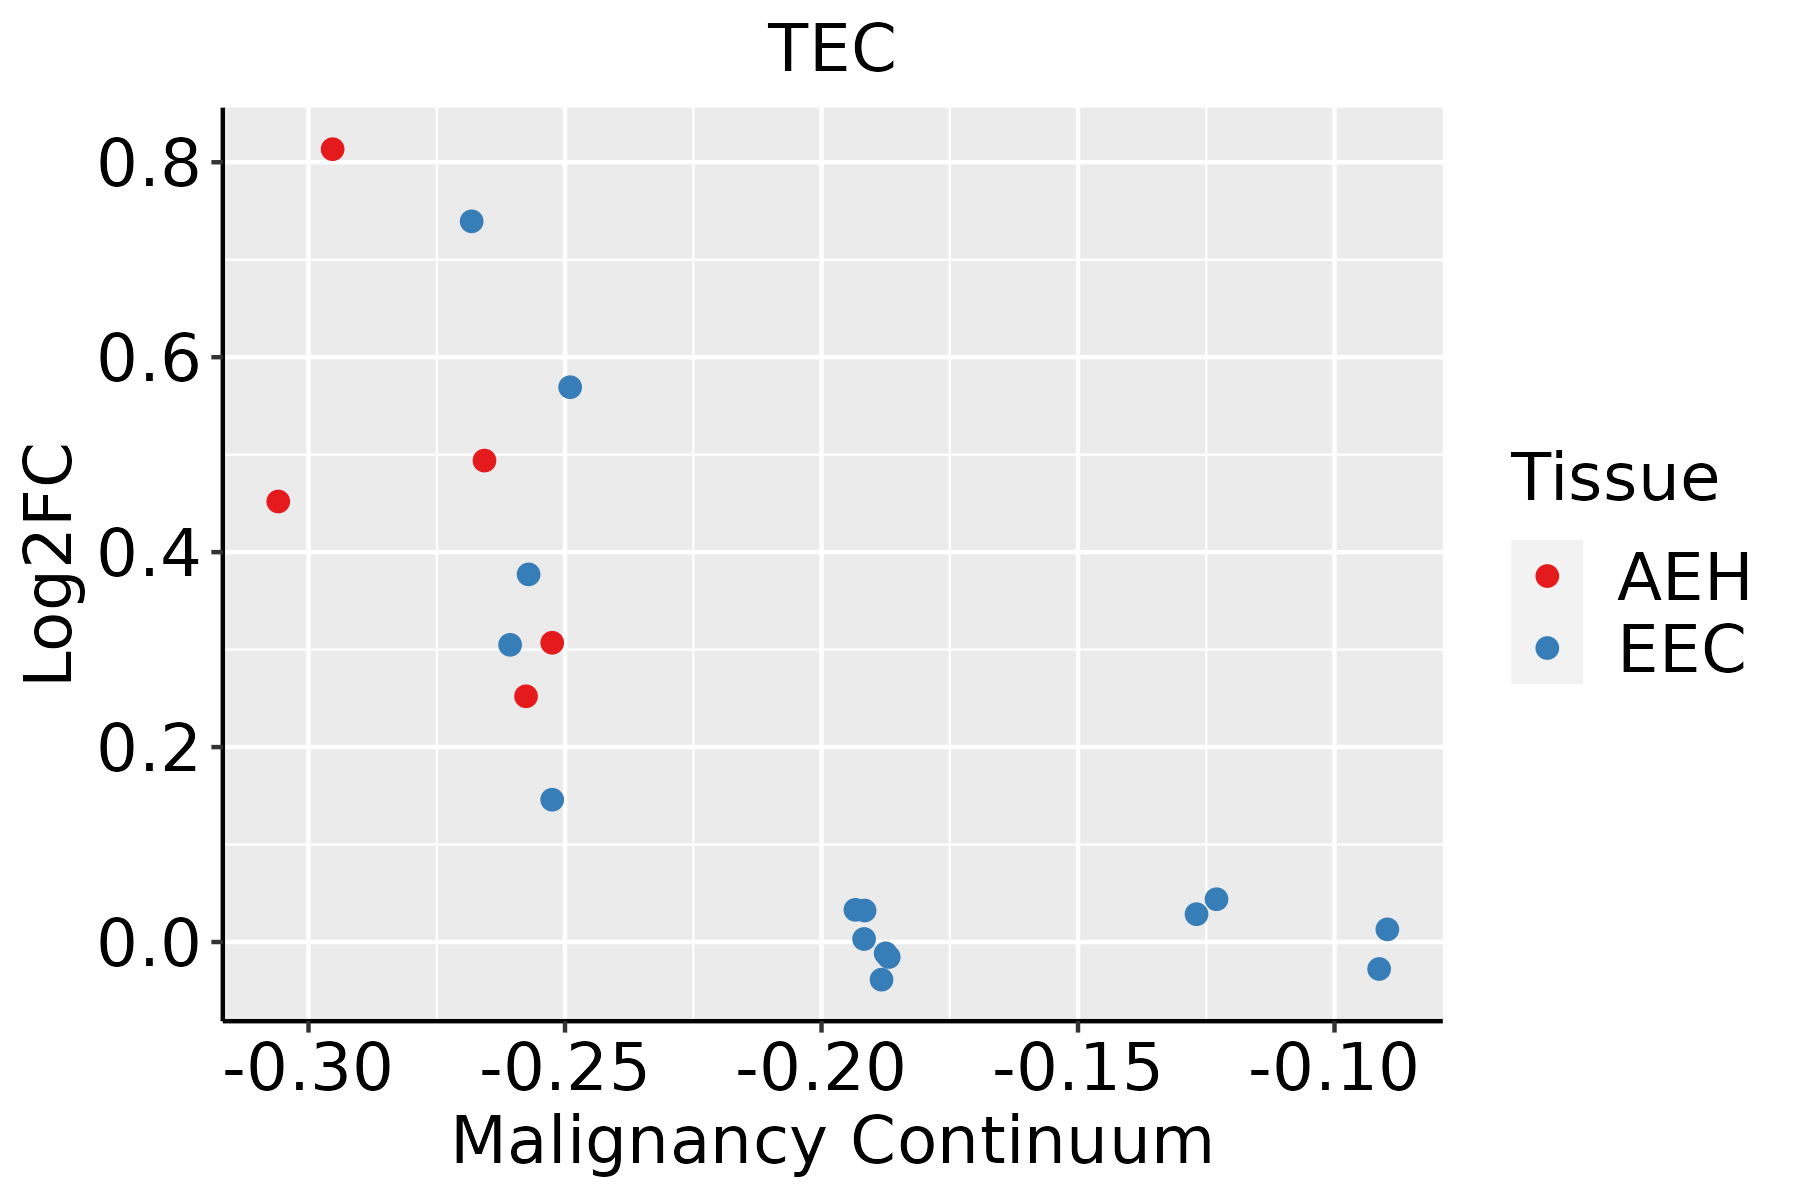 | AEH: Atypical endometrial hyperplasia |
| EEC: Endometrioid Cancer | ||
| Lung | 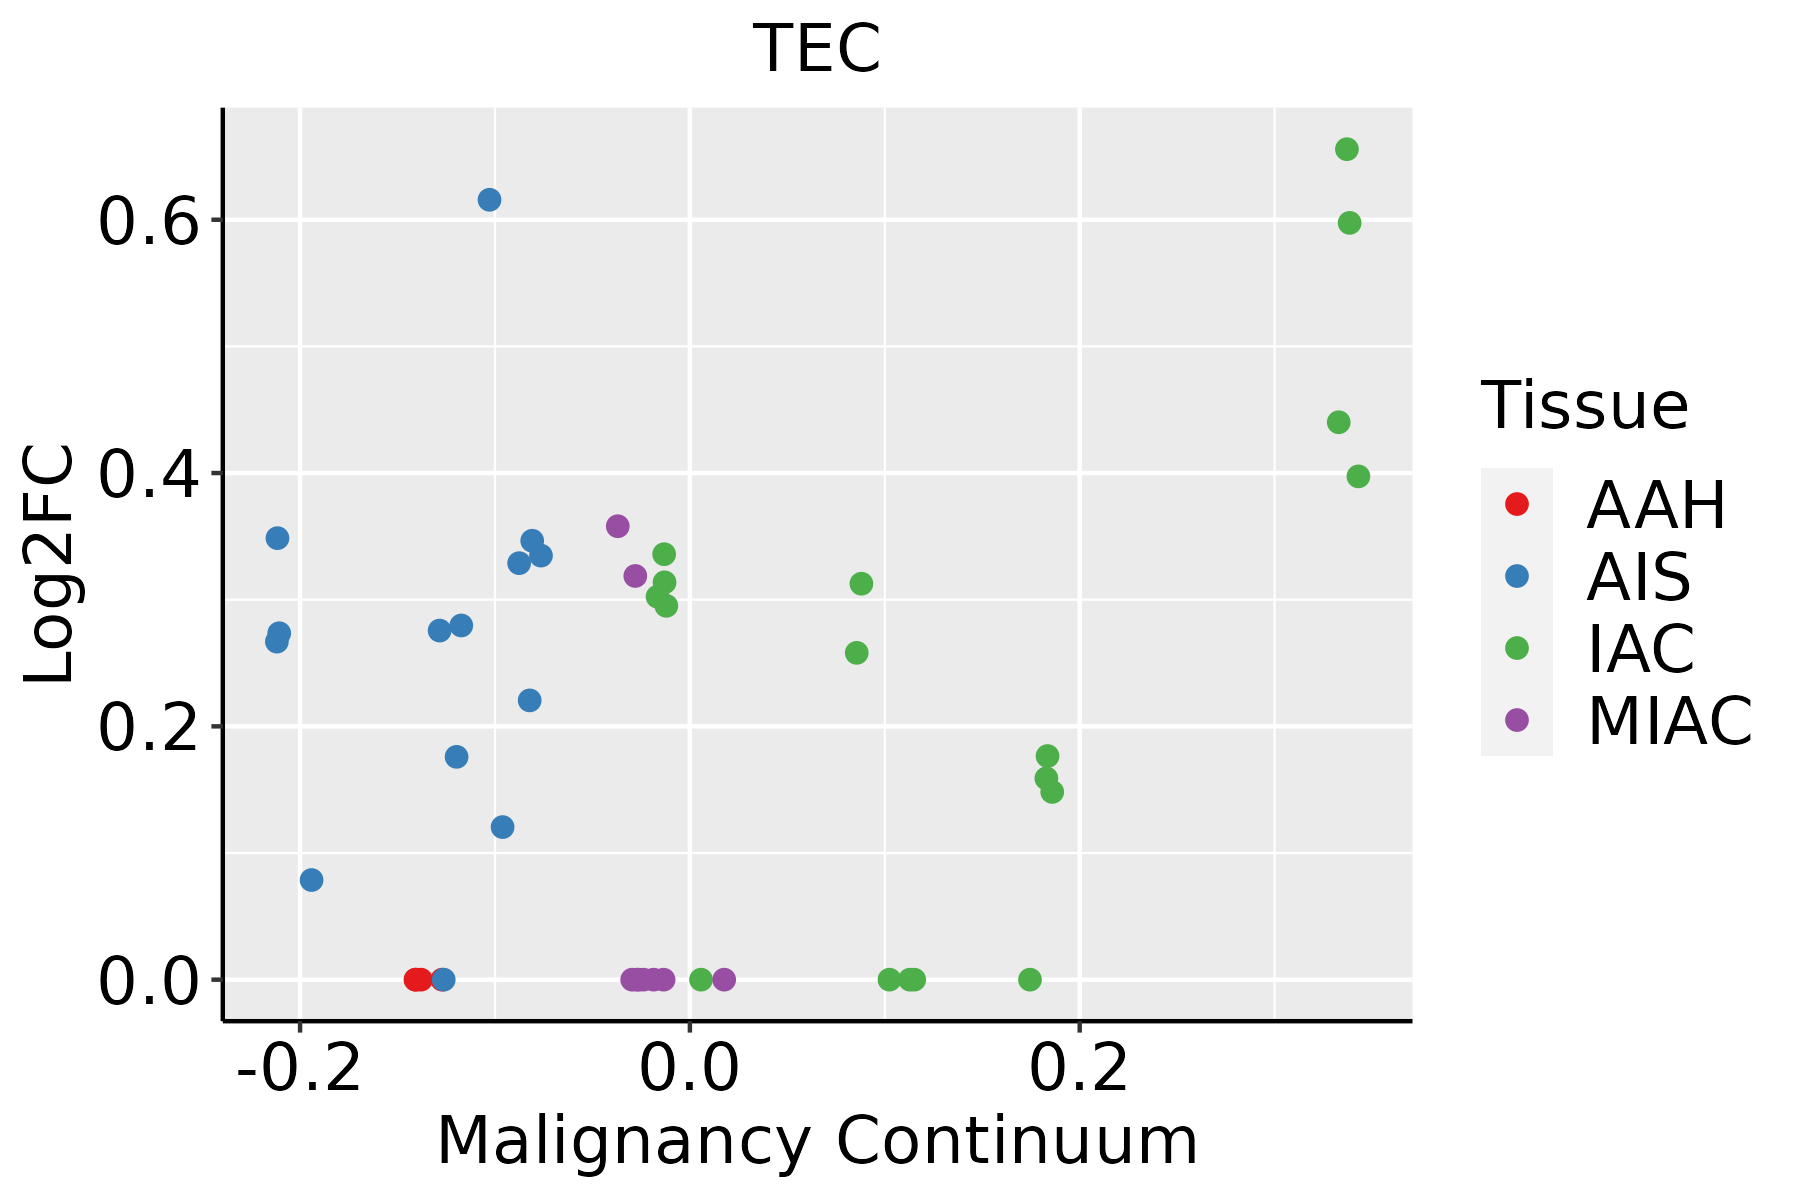 | AAH: Atypical adenomatous hyperplasia |
| AIS: Adenocarcinoma in situ | ||
| IAC: Invasive lung adenocarcinoma | ||
| MIA: Minimally invasive adenocarcinoma | ||
| Thyroid | 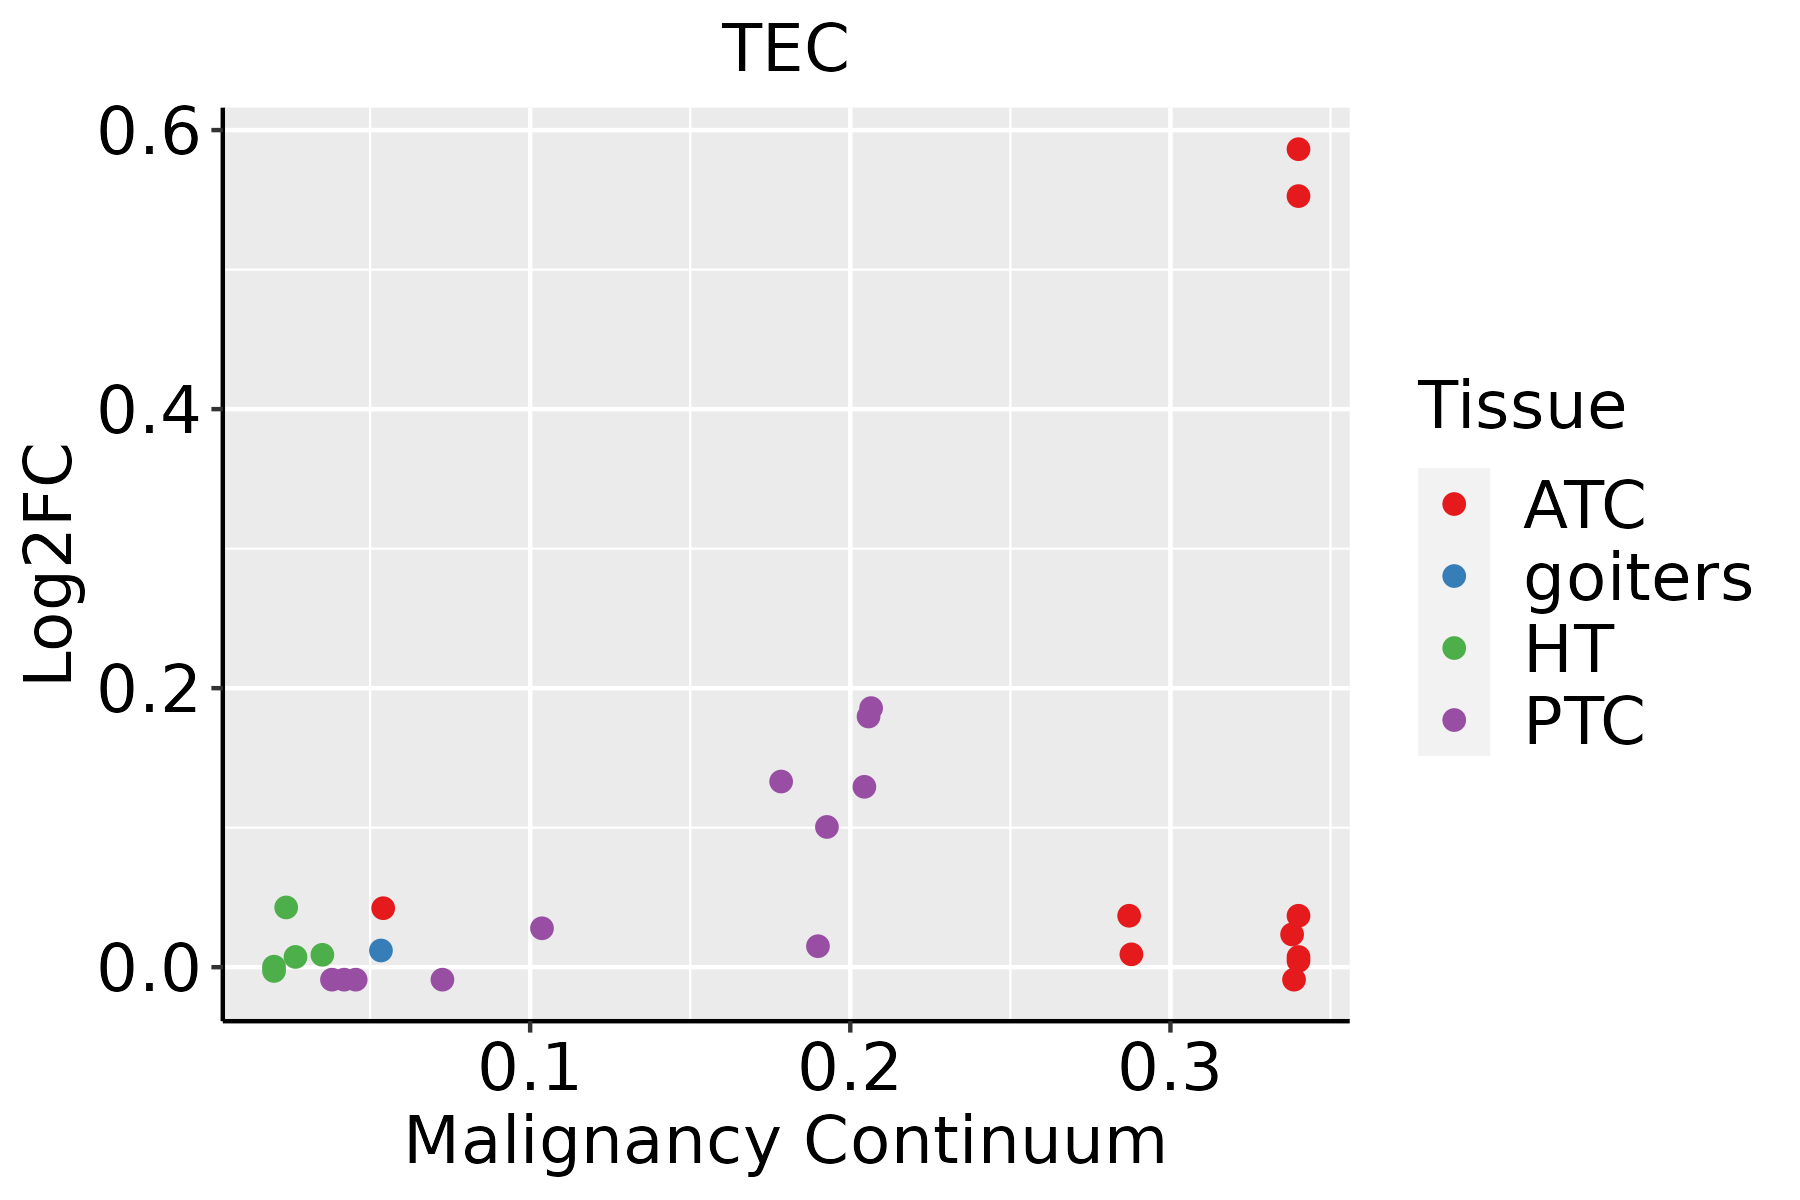 | ATC: Anaplastic thyroid cancer |
| HT: Hashimoto's thyroiditis | ||
| PTC: Papillary thyroid cancer |
| ∗log2FC in expression of this searched gene in stem-like cells from each diseased tissue sample relative to stem-like cells in normal samples in each tissue plotted against the malignancy continuum. Samples are colored based on if they are from different disease stage. |
Top |
Malignant transformation related pathway analysis |
| Find out the enriched GO biological processes and KEGG pathways involved in transition from healthy to precancer to cancer |
| Tissue | Disease Stage | Enriched GO biological Processes |
| Colorectum | AD |  |
| Colorectum | SER |  |
| Colorectum | MSS |  |
| Colorectum | MSI-H |  |
| Colorectum | FAP |  |
| ∗Top 15 enriched GO BP terms are showed in the bar plot of each disease state in each tissue. Each row represents a significant GO biological process which is colored according to the -log10(p.adjust). |
| Page: 1 2 3 4 5 6 7 8 9 |
| GO ID | Tissue | Disease Stage | Description | Gene Ratio | Bg Ratio | pvalue | p.adjust | Count |
| GO:00442724 | Oral cavity | OSCC | sulfur compound biosynthetic process | 82/7305 | 148/18723 | 3.71e-05 | 3.31e-04 | 82 |
| GO:00067905 | Oral cavity | OSCC | sulfur compound metabolic process | 168/7305 | 339/18723 | 4.50e-05 | 3.84e-04 | 168 |
| GO:00066651 | Oral cavity | OSCC | sphingolipid metabolic process | 84/7305 | 155/18723 | 8.64e-05 | 6.61e-04 | 84 |
| GO:007252120 | Oral cavity | OSCC | purine-containing compound metabolic process | 199/7305 | 416/18723 | 1.34e-04 | 9.53e-04 | 199 |
| GO:000915020 | Oral cavity | OSCC | purine ribonucleotide metabolic process | 178/7305 | 368/18723 | 1.45e-04 | 1.02e-03 | 178 |
| GO:00160537 | Oral cavity | OSCC | organic acid biosynthetic process | 155/7305 | 316/18723 | 1.64e-04 | 1.13e-03 | 155 |
| GO:00463947 | Oral cavity | OSCC | carboxylic acid biosynthetic process | 154/7305 | 314/18723 | 1.73e-04 | 1.19e-03 | 154 |
| GO:00066317 | Oral cavity | OSCC | fatty acid metabolic process | 186/7305 | 390/18723 | 2.65e-04 | 1.69e-03 | 186 |
| GO:000616320 | Oral cavity | OSCC | purine nucleotide metabolic process | 188/7305 | 396/18723 | 3.31e-04 | 2.04e-03 | 188 |
| GO:00338663 | Oral cavity | OSCC | nucleoside bisphosphate biosynthetic process | 36/7305 | 60/18723 | 7.94e-04 | 4.27e-03 | 36 |
| GO:00340303 | Oral cavity | OSCC | ribonucleoside bisphosphate biosynthetic process | 36/7305 | 60/18723 | 7.94e-04 | 4.27e-03 | 36 |
| GO:00340333 | Oral cavity | OSCC | purine nucleoside bisphosphate biosynthetic process | 36/7305 | 60/18723 | 7.94e-04 | 4.27e-03 | 36 |
| GO:19012938 | Oral cavity | OSCC | nucleoside phosphate biosynthetic process | 125/7305 | 256/18723 | 8.32e-04 | 4.41e-03 | 125 |
| GO:00091658 | Oral cavity | OSCC | nucleotide biosynthetic process | 124/7305 | 254/18723 | 8.79e-04 | 4.63e-03 | 124 |
| GO:004639017 | Oral cavity | OSCC | ribose phosphate biosynthetic process | 95/7305 | 190/18723 | 1.30e-03 | 6.46e-03 | 95 |
| GO:00353843 | Oral cavity | OSCC | thioester biosynthetic process | 28/7305 | 45/18723 | 1.36e-03 | 6.62e-03 | 28 |
| GO:00716163 | Oral cavity | OSCC | acyl-CoA biosynthetic process | 28/7305 | 45/18723 | 1.36e-03 | 6.62e-03 | 28 |
| GO:00338654 | Oral cavity | OSCC | nucleoside bisphosphate metabolic process | 66/7305 | 128/18723 | 2.58e-03 | 1.13e-02 | 66 |
| GO:00338754 | Oral cavity | OSCC | ribonucleoside bisphosphate metabolic process | 66/7305 | 128/18723 | 2.58e-03 | 1.13e-02 | 66 |
| GO:00340324 | Oral cavity | OSCC | purine nucleoside bisphosphate metabolic process | 66/7305 | 128/18723 | 2.58e-03 | 1.13e-02 | 66 |
| Page: 1 2 3 4 5 6 7 8 9 10 11 12 13 14 15 16 17 18 19 20 21 22 |
| Pathway ID | Tissue | Disease Stage | Description | Gene Ratio | Bg Ratio | pvalue | p.adjust | qvalue | Count |
| Page: 1 |
Top |
Cell-cell communication analysis |
| Identification of potential cell-cell interactions between two cell types and their ligand-receptor pairs for different disease states |
| Ligand | Receptor | LRpair | Pathway | Tissue | Disease Stage |
| Page: 1 |
Top |
Single-cell gene regulatory network inference analysis |
| Find out the significant the regulons (TFs) and the target genes of each regulon across cell types for different disease states |
| TF | Cell Type | Tissue | Disease Stage | Target Gene | RSS | Regulon Activity |
| ∗The dot plots of a searched regulon are shown for all cell subpopulations in each disease state of each tissue based on the regulon specific score inferred using pySCENIC and by calculating the average expression. |
| Page: 1 |
Top |
Somatic mutation of malignant transformation related genes |
| Annotation of somatic variants for genes involved in malignant transformation |
| Hugo Symbol | Variant Class | Variant Classification | dbSNP RS | HGVSc | HGVSp | HGVSp Short | SWISSPROT | BIOTYPE | SIFT | PolyPhen | Tumor Sample Barcode | Tissue | Histology | Sex | Age | Stage | Therapy Types | Drugs | Outcome |
| TEC | SNV | Missense_Mutation | c.1117A>T | p.Met373Leu | p.M373L | P42680 | protein_coding | tolerated(1) | benign(0.037) | TCGA-A8-A09K-01 | Breast | breast invasive carcinoma | Female | >=65 | I/II | Unknown | Unknown | SD | |
| TEC | SNV | Missense_Mutation | rs780984861 | c.1393N>A | p.Val465Ile | p.V465I | P42680 | protein_coding | tolerated(0.23) | benign(0.001) | TCGA-AO-A12A-01 | Breast | breast invasive carcinoma | Female | <65 | I/II | Chemotherapy | cyclophosphamide | SD |
| TEC | SNV | Missense_Mutation | c.1564T>G | p.Ser522Ala | p.S522A | P42680 | protein_coding | deleterious(0) | probably_damaging(0.997) | TCGA-C8-A1HM-01 | Breast | breast invasive carcinoma | Female | >=65 | I/II | Chemotherapy | doxorubicin | CR | |
| TEC | SNV | Missense_Mutation | c.1191C>G | p.Ile397Met | p.I397M | P42680 | protein_coding | deleterious(0) | probably_damaging(1) | TCGA-C8-A26Y-01 | Breast | breast invasive carcinoma | Female | >=65 | I/II | Unknown | Unknown | SD | |
| TEC | SNV | Missense_Mutation | c.700N>T | p.Val234Leu | p.V234L | P42680 | protein_coding | tolerated(0.4) | probably_damaging(0.997) | TCGA-C8-A278-01 | Breast | breast invasive carcinoma | Female | <65 | III/IV | Hormone Therapy | tamoxiphen | SD | |
| TEC | SNV | Missense_Mutation | rs761984494 | c.806N>A | p.Gly269Asp | p.G269D | P42680 | protein_coding | deleterious(0) | benign(0.403) | TCGA-D8-A1J8-01 | Breast | breast invasive carcinoma | Female | >=65 | I/II | Hormone Therapy | nolvadex | SD |
| TEC | insertion | In_Frame_Ins | novel | c.587_588insAAATATAAAATTTAATTTCCCTCAAGGTCAAAATAATCACATTAAACA | p.Gly195_His196insGlnAsnIleLysPheAsnPheProGlnGlyGlnAsnAsnHisIleLys | p.G195_H196insQNIKFNFPQGQNNHIK | P42680 | protein_coding | TCGA-AO-A128-01 | Breast | breast invasive carcinoma | Female | <65 | I/II | Chemotherapy | doxorubicin | SD | ||
| TEC | deletion | Frame_Shift_Del | novel | c.1348delN | p.Leu450PhefsTer2 | p.L450Ffs*2 | P42680 | protein_coding | TCGA-D8-A27V-01 | Breast | breast invasive carcinoma | Female | <65 | I/II | Hormone Therapy | tamoxiphen | SD | ||
| TEC | SNV | Missense_Mutation | rs750190240 | c.700N>A | p.Val234Ile | p.V234I | P42680 | protein_coding | tolerated(0.08) | probably_damaging(0.994) | TCGA-ZJ-AAXB-01 | Cervix | cervical & endocervical cancer | Female | <65 | I/II | Unknown | Unknown | SD |
| TEC | SNV | Missense_Mutation | rs539573453 | c.550N>A | p.Val184Ile | p.V184I | P42680 | protein_coding | deleterious(0.05) | benign(0.039) | TCGA-A6-6780-01 | Colorectum | colon adenocarcinoma | Male | >=65 | I/II | Unknown | Unknown | SD |
| Page: 1 2 3 4 5 6 |
Top |
Related drugs of malignant transformation related genes |
| Identification of chemicals and drugs interact with genes involved in malignant transfromation |
| (DGIdb 4.0) |
| Entrez ID | Symbol | Category | Interaction Types | Drug Claim Name | Drug Name | PMIDs |
| Page: 1 |

Copyright 2023-Present -The University of Texas Health Science Center at Houston |