
|
|||||
|
 | |
| |
| |
| |
| |
| |
|
Gene: STYX |
Gene summary for STYX |
| Gene information | Species | Human | Gene symbol | STYX | Gene ID | 6815 |
| Gene name | serine/threonine/tyrosine interacting protein | |
| Gene Alias | STYX | |
| Cytomap | 14q22.1 | |
| Gene Type | protein-coding | GO ID | GO:0000165 | UniProtAcc | A0A024R641 |
Top |
Malignant transformation analysis |
| Identification of the aberrant gene expression in precancerous and cancerous lesions by comparing the gene expression of stem-like cells in diseased tissues with normal stem cells |
| Entrez ID | Symbol | Replicates | Species | Organ | Tissue | Adj P-value | Log2FC | Malignancy |
| 6815 | STYX | LZE4T | Human | Esophagus | ESCC | 7.73e-12 | 3.53e-01 | 0.0811 |
| 6815 | STYX | LZE5T | Human | Esophagus | ESCC | 1.29e-03 | 2.18e-01 | 0.0514 |
| 6815 | STYX | LZE20T | Human | Esophagus | ESCC | 3.86e-05 | 1.46e-01 | 0.0662 |
| 6815 | STYX | LZE22T | Human | Esophagus | ESCC | 1.92e-04 | 1.90e-01 | 0.068 |
| 6815 | STYX | LZE24T | Human | Esophagus | ESCC | 4.58e-14 | 2.68e-01 | 0.0596 |
| 6815 | STYX | LZE21T | Human | Esophagus | ESCC | 1.00e-02 | 1.20e-01 | 0.0655 |
| 6815 | STYX | LZE6T | Human | Esophagus | ESCC | 1.05e-02 | 1.10e-01 | 0.0845 |
| 6815 | STYX | P1T-E | Human | Esophagus | ESCC | 2.69e-02 | 8.34e-02 | 0.0875 |
| 6815 | STYX | P2T-E | Human | Esophagus | ESCC | 2.89e-10 | 1.41e-01 | 0.1177 |
| 6815 | STYX | P4T-E | Human | Esophagus | ESCC | 1.17e-18 | 3.30e-01 | 0.1323 |
| 6815 | STYX | P5T-E | Human | Esophagus | ESCC | 1.60e-15 | 1.63e-01 | 0.1327 |
| 6815 | STYX | P8T-E | Human | Esophagus | ESCC | 3.67e-09 | 1.47e-01 | 0.0889 |
| 6815 | STYX | P9T-E | Human | Esophagus | ESCC | 5.85e-08 | 1.00e-01 | 0.1131 |
| 6815 | STYX | P10T-E | Human | Esophagus | ESCC | 4.74e-08 | 1.82e-01 | 0.116 |
| 6815 | STYX | P11T-E | Human | Esophagus | ESCC | 1.78e-11 | 2.87e-01 | 0.1426 |
| 6815 | STYX | P12T-E | Human | Esophagus | ESCC | 2.40e-12 | 2.37e-01 | 0.1122 |
| 6815 | STYX | P15T-E | Human | Esophagus | ESCC | 5.74e-25 | 3.72e-01 | 0.1149 |
| 6815 | STYX | P16T-E | Human | Esophagus | ESCC | 1.10e-08 | 1.08e-01 | 0.1153 |
| 6815 | STYX | P17T-E | Human | Esophagus | ESCC | 8.48e-05 | 1.44e-01 | 0.1278 |
| 6815 | STYX | P20T-E | Human | Esophagus | ESCC | 4.53e-12 | 2.11e-01 | 0.1124 |
| Page: 1 2 3 4 5 |
| Tissue | Expression Dynamics | Abbreviation |
| Esophagus | 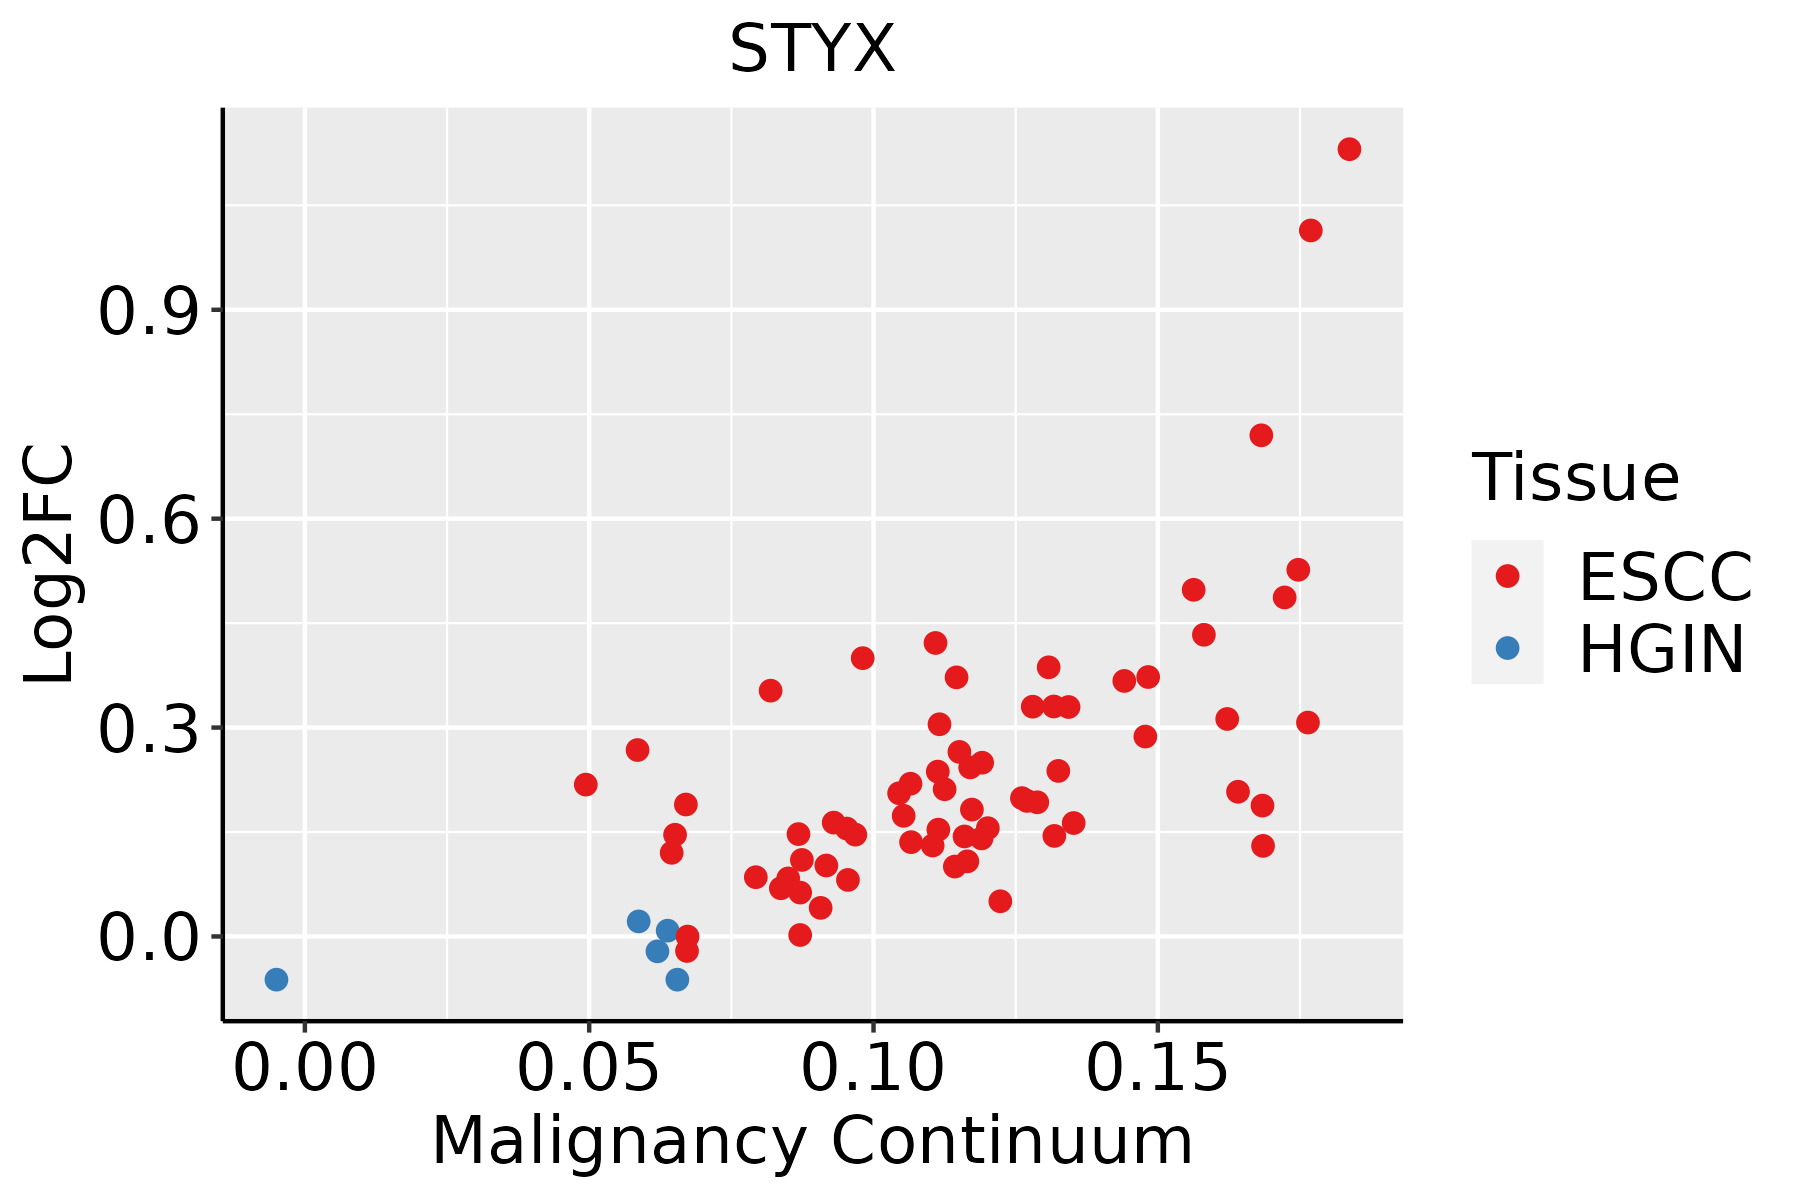 | ESCC: Esophageal squamous cell carcinoma |
| HGIN: High-grade intraepithelial neoplasias | ||
| LGIN: Low-grade intraepithelial neoplasias | ||
| Liver | 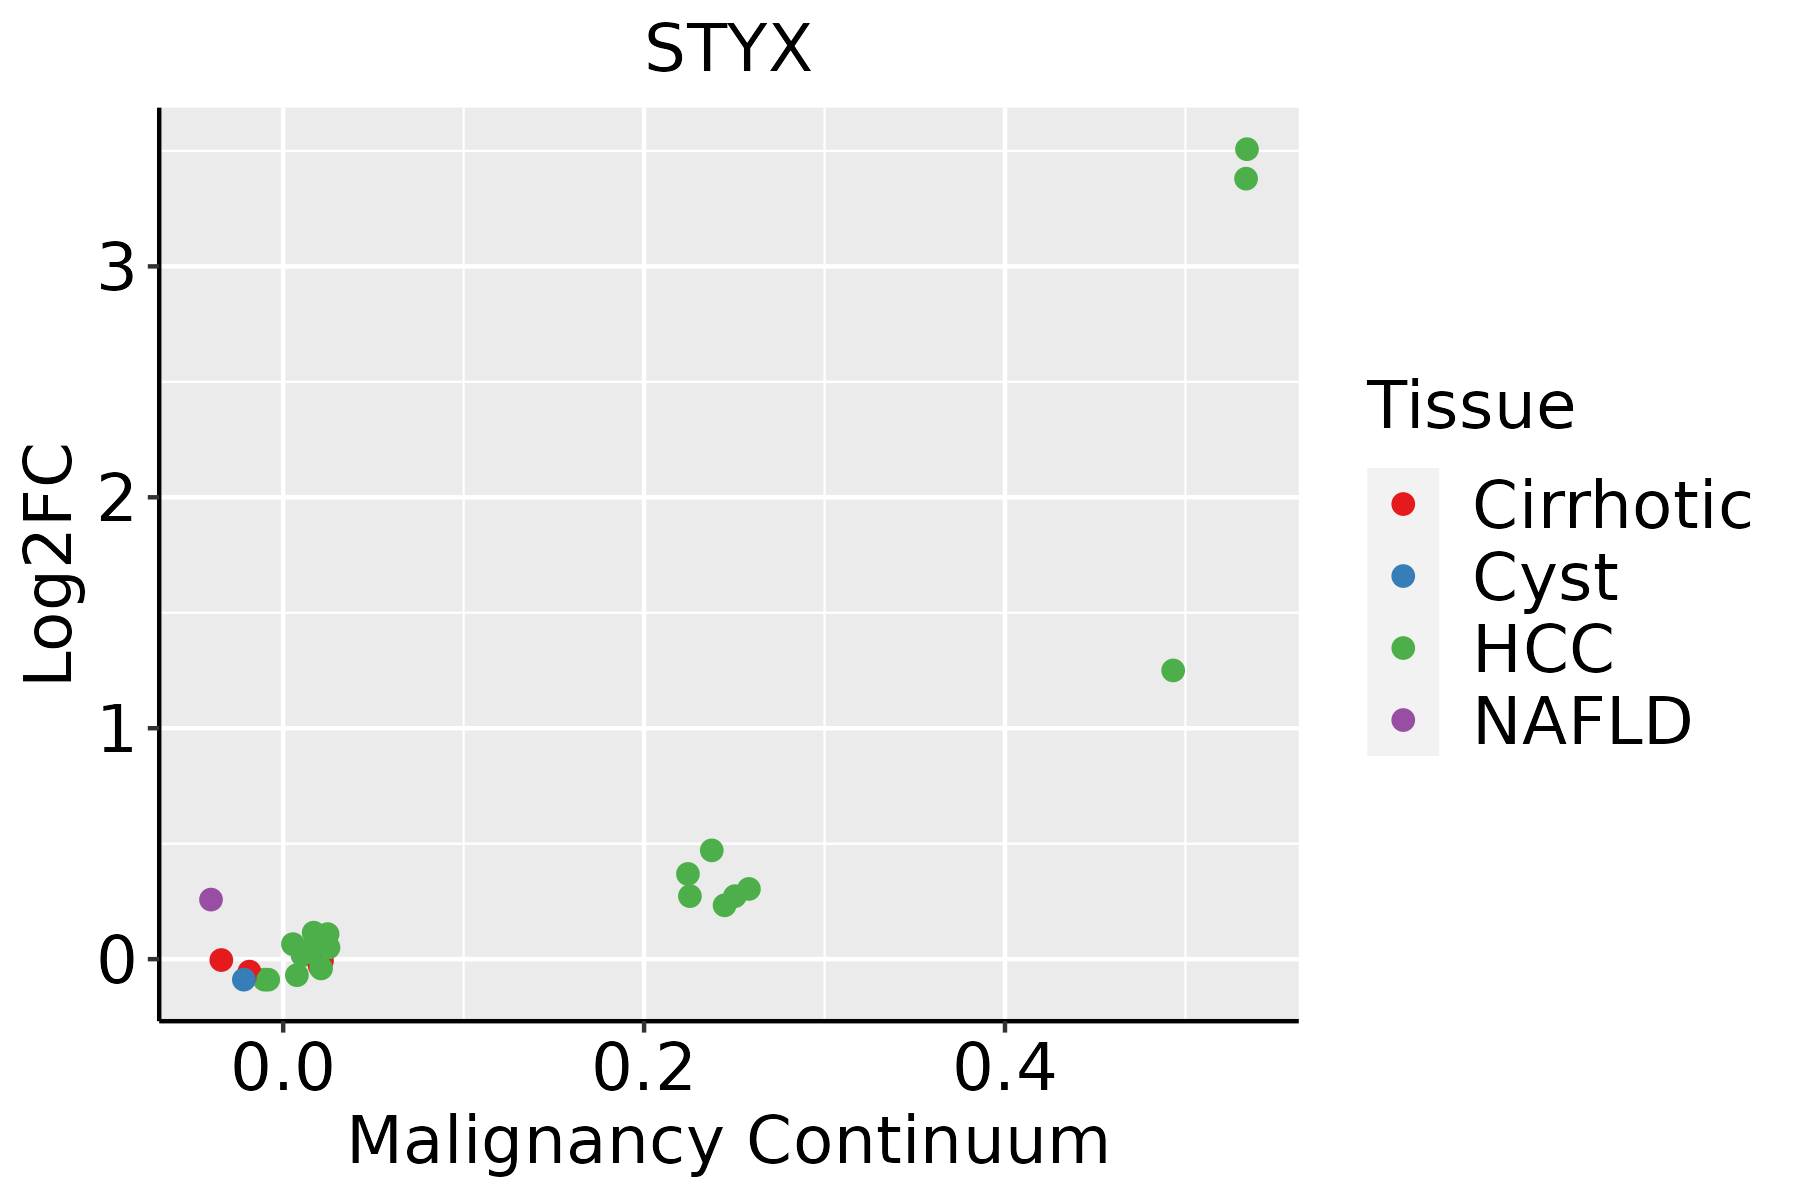 | HCC: Hepatocellular carcinoma |
| NAFLD: Non-alcoholic fatty liver disease | ||
| Oral Cavity | 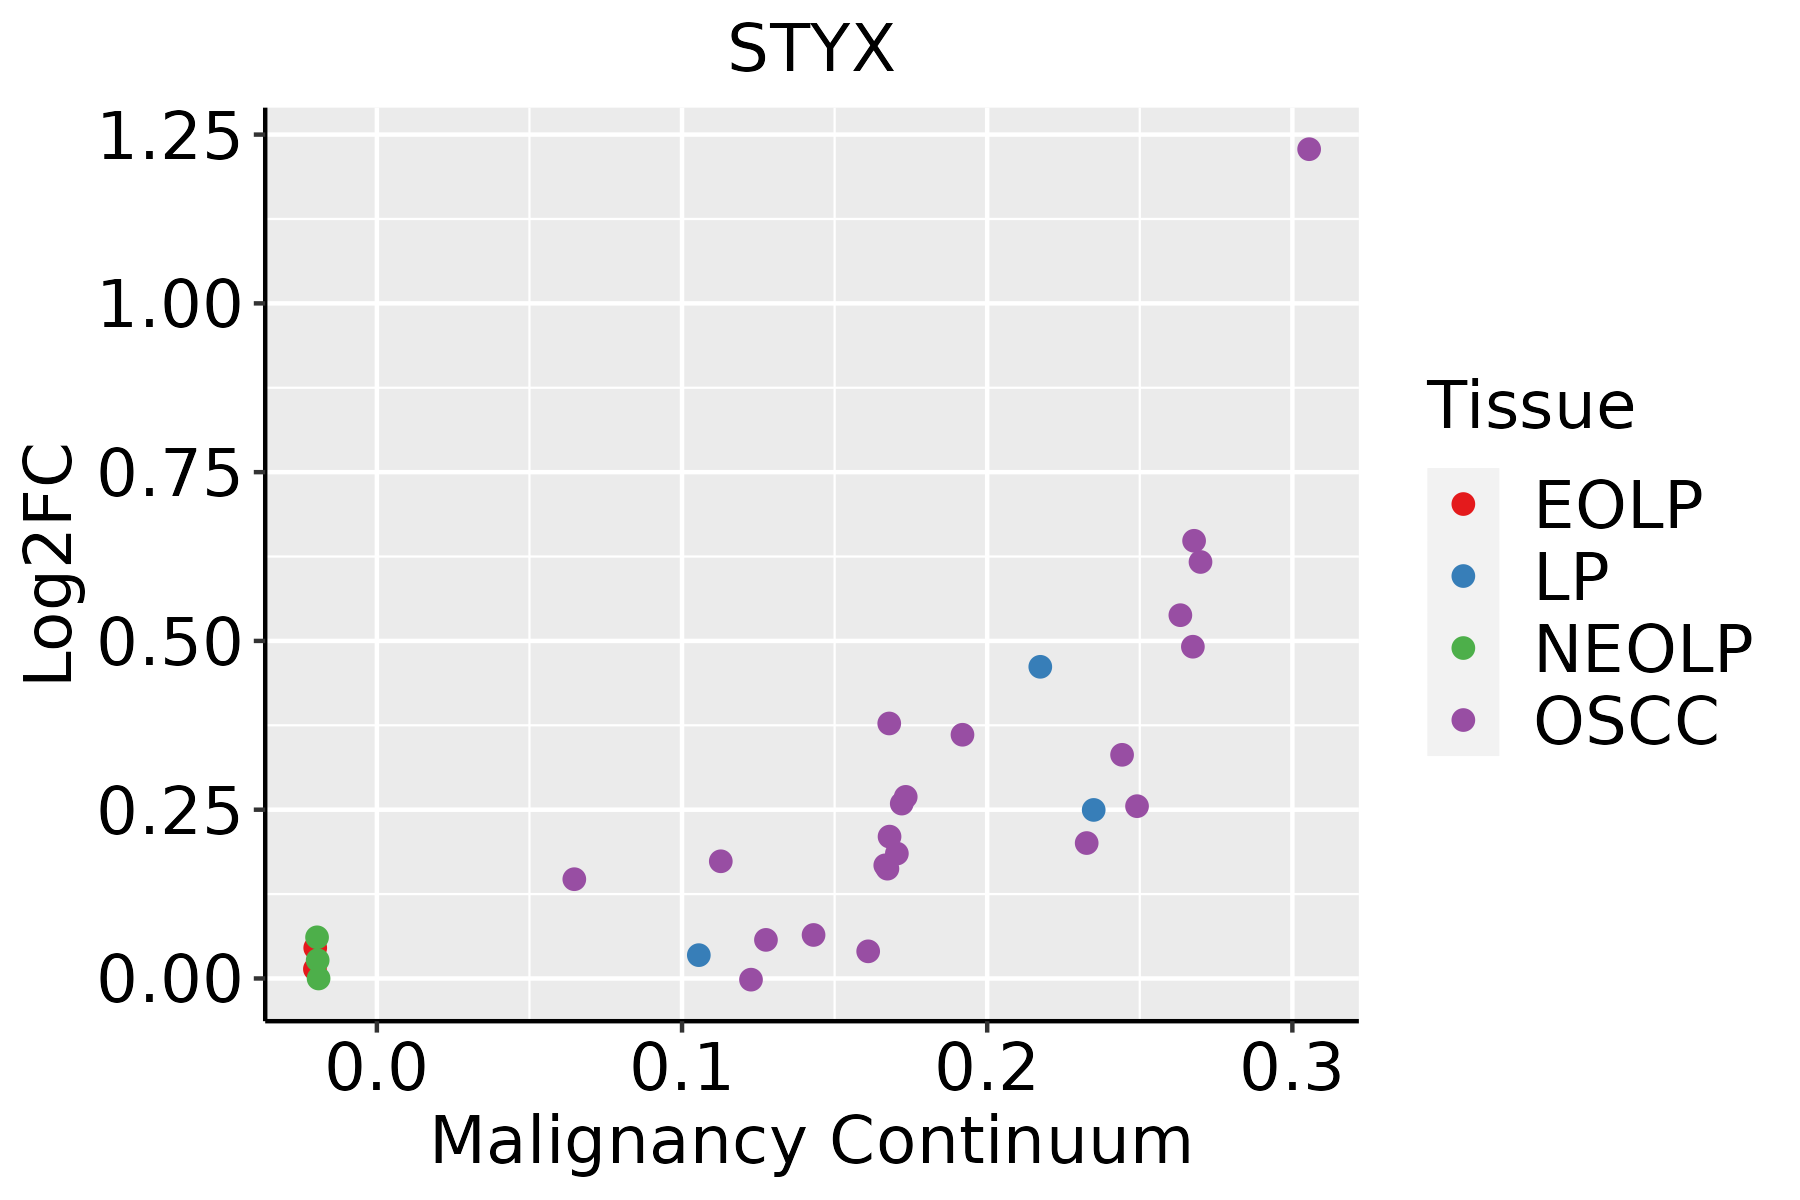 | EOLP: Erosive Oral lichen planus |
| LP: leukoplakia | ||
| NEOLP: Non-erosive oral lichen planus | ||
| OSCC: Oral squamous cell carcinoma | ||
| Skin |  | AK: Actinic keratosis |
| cSCC: Cutaneous squamous cell carcinoma | ||
| SCCIS:squamous cell carcinoma in situ |
| ∗log2FC in expression of this searched gene in stem-like cells from each diseased tissue sample relative to stem-like cells in normal samples in each tissue plotted against the malignancy continuum. Samples are colored based on if they are from different disease stage. |
Top |
Malignant transformation related pathway analysis |
| Find out the enriched GO biological processes and KEGG pathways involved in transition from healthy to precancer to cancer |
| Tissue | Disease Stage | Enriched GO biological Processes |
| Colorectum | AD |  |
| Colorectum | SER |  |
| Colorectum | MSS |  |
| Colorectum | MSI-H |  |
| Colorectum | FAP |  |
| ∗Top 15 enriched GO BP terms are showed in the bar plot of each disease state in each tissue. Each row represents a significant GO biological process which is colored according to the -log10(p.adjust). |
| Page: 1 2 3 4 5 6 7 8 9 |
| GO ID | Tissue | Disease Stage | Description | Gene Ratio | Bg Ratio | pvalue | p.adjust | Count |
| GO:003209117 | Skin | cSCC | negative regulation of protein binding | 43/4864 | 94/18723 | 2.68e-05 | 3.03e-04 | 43 |
| GO:003406316 | Skin | cSCC | stress granule assembly | 17/4864 | 26/18723 | 2.77e-05 | 3.11e-04 | 17 |
| GO:0035304112 | Skin | cSCC | regulation of protein dephosphorylation | 41/4864 | 90/18723 | 4.61e-05 | 4.80e-04 | 41 |
| GO:190179913 | Skin | cSCC | negative regulation of proteasomal protein catabolic process | 26/4864 | 49/18723 | 4.78e-05 | 4.96e-04 | 26 |
| GO:190211515 | Skin | cSCC | regulation of organelle assembly | 72/4864 | 186/18723 | 8.90e-05 | 8.35e-04 | 72 |
| GO:005134627 | Skin | cSCC | negative regulation of hydrolase activity | 130/4864 | 379/18723 | 1.74e-04 | 1.49e-03 | 130 |
| GO:003530818 | Skin | cSCC | negative regulation of protein dephosphorylation | 19/4864 | 34/18723 | 2.03e-04 | 1.69e-03 | 19 |
| GO:003134622 | Skin | cSCC | positive regulation of cell projection organization | 120/4864 | 353/18723 | 4.49e-04 | 3.44e-03 | 120 |
| GO:003530514 | Skin | cSCC | negative regulation of dephosphorylation | 22/4864 | 45/18723 | 8.01e-04 | 5.55e-03 | 22 |
| GO:0035303112 | Skin | cSCC | regulation of dephosphorylation | 49/4864 | 128/18723 | 1.46e-03 | 9.17e-03 | 49 |
| GO:001631115 | Skin | cSCC | dephosphorylation | 134/4864 | 417/18723 | 2.65e-03 | 1.50e-02 | 134 |
| GO:001097522 | Skin | cSCC | regulation of neuron projection development | 141/4864 | 445/18723 | 3.72e-03 | 1.99e-02 | 141 |
| GO:001097613 | Skin | cSCC | positive regulation of neuron projection development | 57/4864 | 163/18723 | 6.66e-03 | 3.24e-02 | 57 |
| Page: 1 2 3 4 5 6 7 8 9 10 11 12 13 |
| Pathway ID | Tissue | Disease Stage | Description | Gene Ratio | Bg Ratio | pvalue | p.adjust | qvalue | Count |
| Page: 1 |
Top |
Cell-cell communication analysis |
| Identification of potential cell-cell interactions between two cell types and their ligand-receptor pairs for different disease states |
| Ligand | Receptor | LRpair | Pathway | Tissue | Disease Stage |
| Page: 1 |
Top |
Single-cell gene regulatory network inference analysis |
| Find out the significant the regulons (TFs) and the target genes of each regulon across cell types for different disease states |
| TF | Cell Type | Tissue | Disease Stage | Target Gene | RSS | Regulon Activity |
| ∗The dot plots of a searched regulon are shown for all cell subpopulations in each disease state of each tissue based on the regulon specific score inferred using pySCENIC and by calculating the average expression. |
| Page: 1 |
Top |
Somatic mutation of malignant transformation related genes |
| Annotation of somatic variants for genes involved in malignant transformation |
| Hugo Symbol | Variant Class | Variant Classification | dbSNP RS | HGVSc | HGVSp | HGVSp Short | SWISSPROT | BIOTYPE | SIFT | PolyPhen | Tumor Sample Barcode | Tissue | Histology | Sex | Age | Stage | Therapy Types | Drugs | Outcome |
| STYX | SNV | Missense_Mutation | c.599G>A | p.Gly200Asp | p.G200D | Q8WUJ0 | protein_coding | deleterious(0.03) | possibly_damaging(0.832) | TCGA-A8-A09Z-01 | Breast | breast invasive carcinoma | Female | >=65 | I/II | Unknown | Unknown | SD | |
| STYX | SNV | Missense_Mutation | c.87N>A | p.Met29Ile | p.M29I | Q8WUJ0 | protein_coding | tolerated(0.16) | benign(0.149) | TCGA-C8-A12P-01 | Breast | breast invasive carcinoma | Female | <65 | I/II | Unknown | Unknown | SD | |
| STYX | SNV | Missense_Mutation | novel | c.451N>G | p.Gln151Glu | p.Q151E | Q8WUJ0 | protein_coding | deleterious(0.04) | possibly_damaging(0.729) | TCGA-VS-A9UP-01 | Cervix | cervical & endocervical cancer | Female | <65 | I/II | Chemotherapy | cisplatin | PD |
| STYX | SNV | Missense_Mutation | novel | c.349C>A | p.Leu117Ile | p.L117I | Q8WUJ0 | protein_coding | deleterious(0) | probably_damaging(1) | TCGA-AG-A002-01 | Colorectum | rectum adenocarcinoma | Male | <65 | I/II | Unknown | Unknown | SD |
| STYX | insertion | Frame_Shift_Ins | rs769509399 | c.290_291insT | p.Met101TyrfsTer3 | p.M101Yfs*3 | Q8WUJ0 | protein_coding | TCGA-WS-AB45-01 | Colorectum | colon adenocarcinoma | Female | <65 | I/II | Unknown | Unknown | SD | ||
| STYX | SNV | Missense_Mutation | novel | c.428N>G | p.Tyr143Cys | p.Y143C | Q8WUJ0 | protein_coding | tolerated(0.06) | benign(0.333) | TCGA-AJ-A3EL-01 | Endometrium | uterine corpus endometrioid carcinoma | Female | <65 | I/II | Unknown | Unknown | SD |
| STYX | SNV | Missense_Mutation | c.80N>A | p.Arg27Gln | p.R27Q | Q8WUJ0 | protein_coding | deleterious(0) | possibly_damaging(0.499) | TCGA-AP-A0LM-01 | Endometrium | uterine corpus endometrioid carcinoma | Female | <65 | III/IV | Chemotherapy | cisplatin | SD | |
| STYX | SNV | Missense_Mutation | c.289N>T | p.Arg97Cys | p.R97C | Q8WUJ0 | protein_coding | tolerated(0.06) | benign(0.031) | TCGA-AP-A1DV-01 | Endometrium | uterine corpus endometrioid carcinoma | Female | <65 | I/II | Unknown | Unknown | SD | |
| STYX | SNV | Missense_Mutation | novel | c.377N>T | p.Arg126Ile | p.R126I | Q8WUJ0 | protein_coding | deleterious(0.02) | probably_damaging(0.987) | TCGA-AX-A2HC-01 | Endometrium | uterine corpus endometrioid carcinoma | Female | <65 | III/IV | Chemotherapy | paclitaxel | PD |
| STYX | SNV | Missense_Mutation | c.665N>C | p.Asn222Thr | p.N222T | Q8WUJ0 | protein_coding | tolerated_low_confidence(0.08) | benign(0.19) | TCGA-B5-A11E-01 | Endometrium | uterine corpus endometrioid carcinoma | Female | <65 | I/II | Unknown | Unknown | SD |
| Page: 1 2 |
Top |
Related drugs of malignant transformation related genes |
| Identification of chemicals and drugs interact with genes involved in malignant transfromation |
| (DGIdb 4.0) |
| Entrez ID | Symbol | Category | Interaction Types | Drug Claim Name | Drug Name | PMIDs |
| Page: 1 |

Copyright 2023-Present -The University of Texas Health Science Center at Houston |