| Tissue | Expression Dynamics | Abbreviation |
| Cervix | 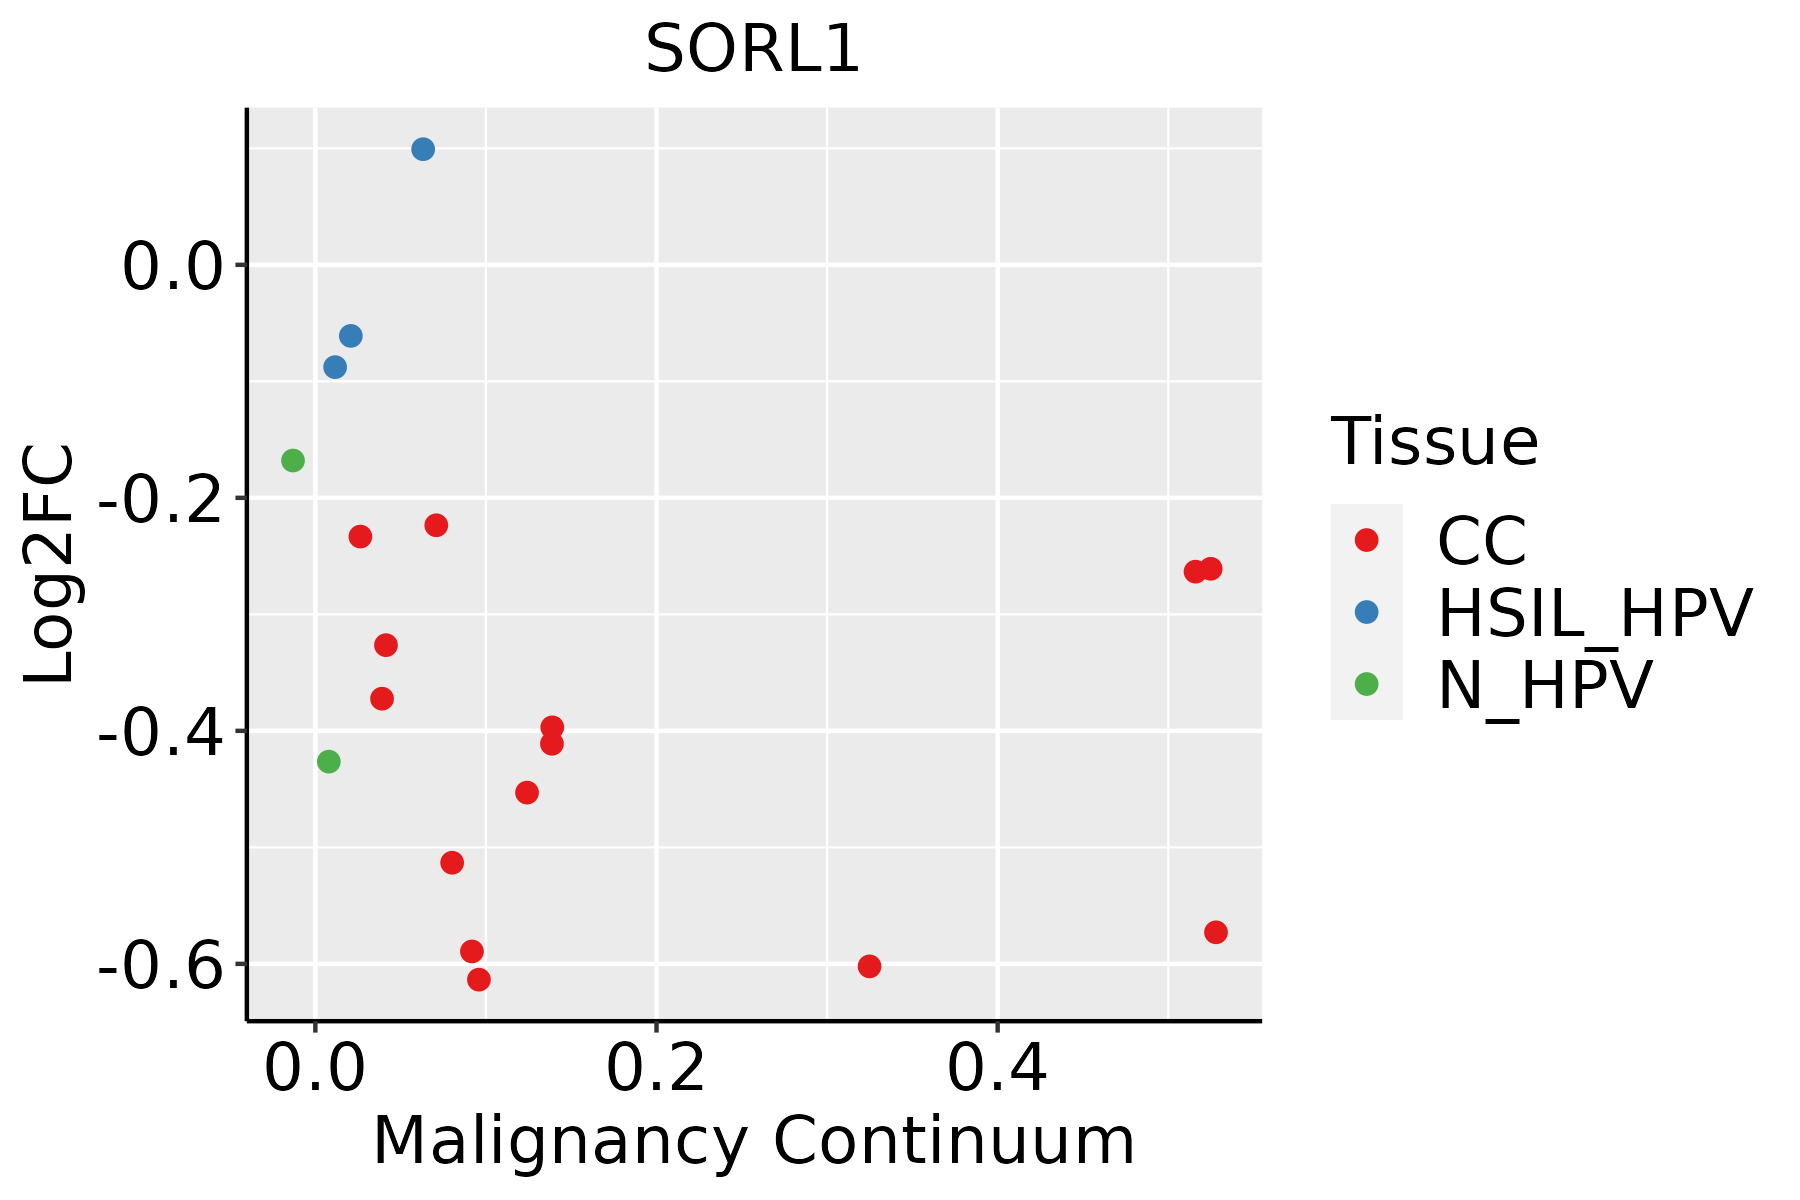 | CC: Cervix cancer |
| HSIL_HPV: HPV-infected high-grade squamous intraepithelial lesions |
| N_HPV: HPV-infected normal cervix |
| Colorectum (GSE201348) | 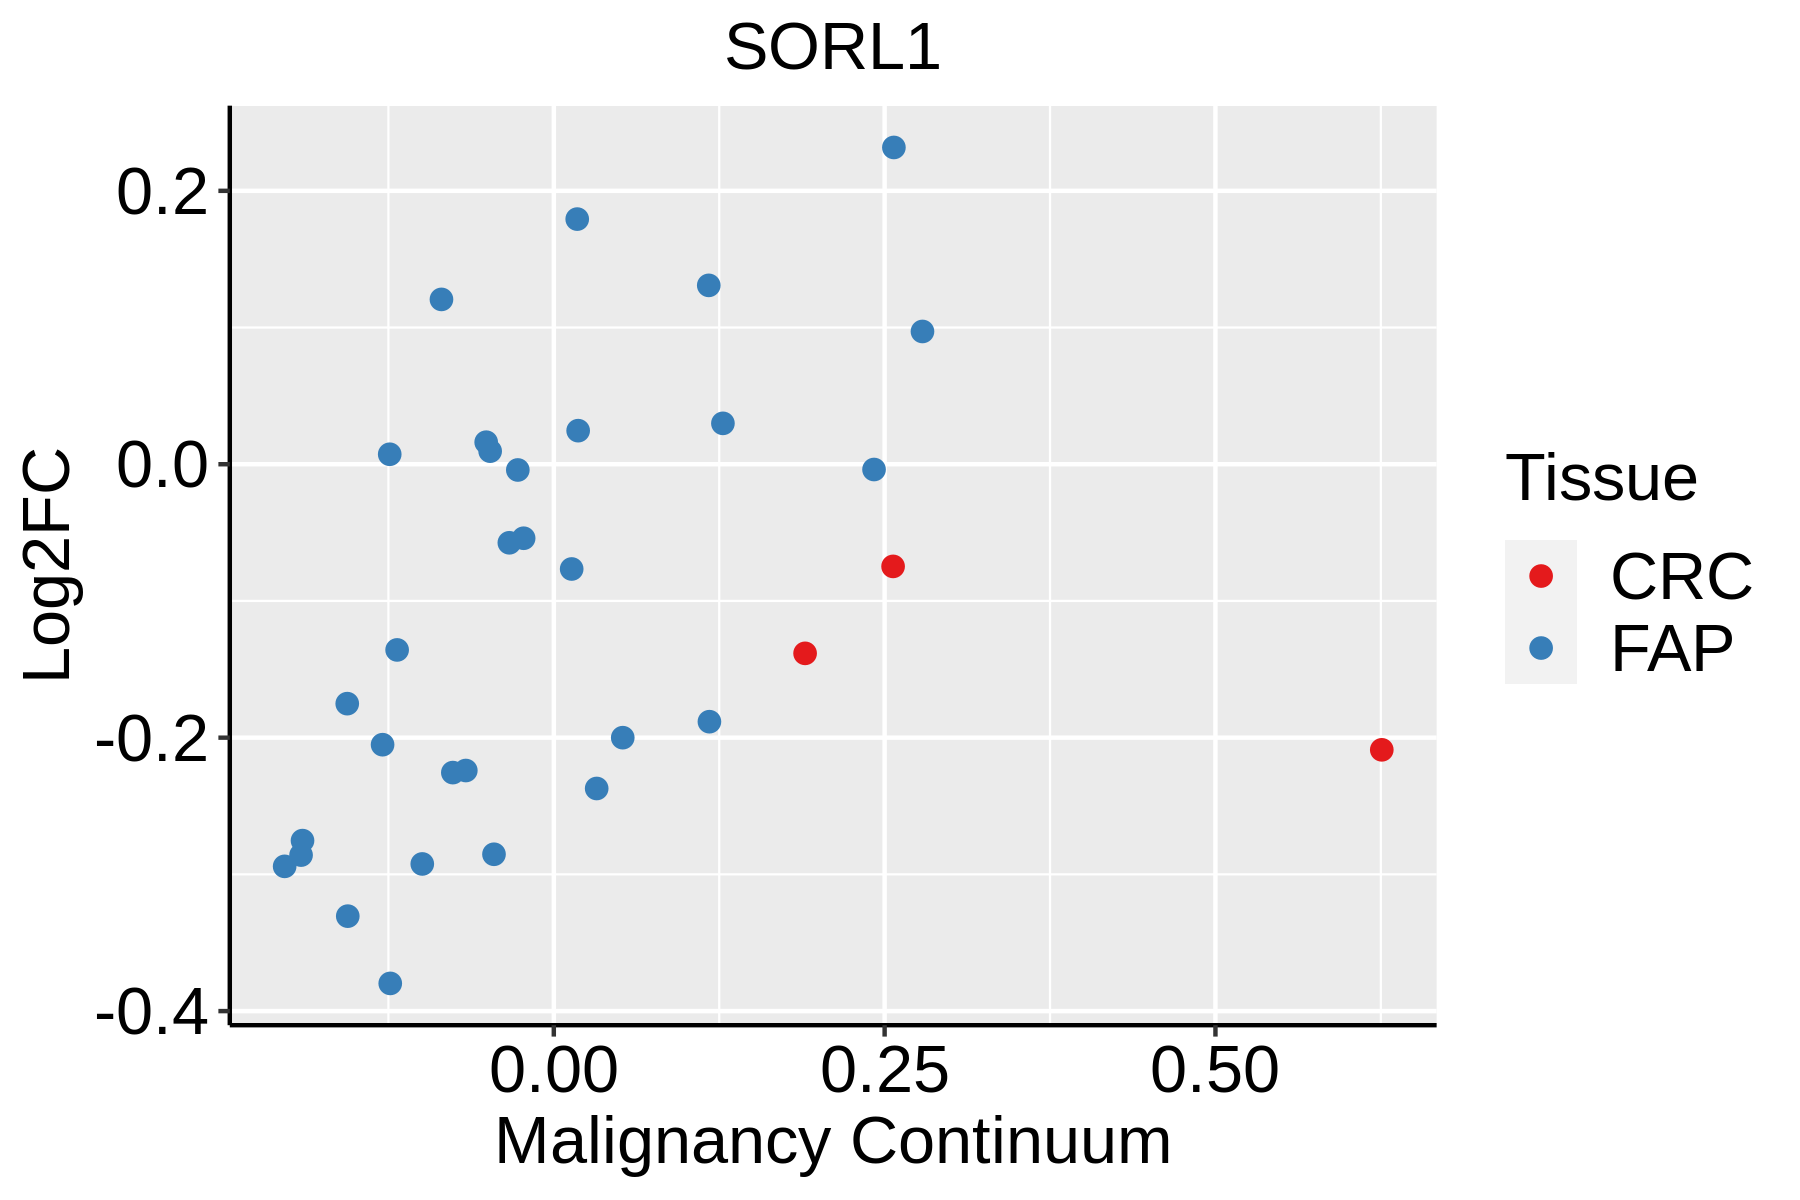 | FAP: Familial adenomatous polyposis |
| CRC: Colorectal cancer |
| Colorectum (HTA11) |  | AD: Adenomas |
| SER: Sessile serrated lesions |
| MSI-H: Microsatellite-high colorectal cancer |
| MSS: Microsatellite stable colorectal cancer |
| Esophagus | 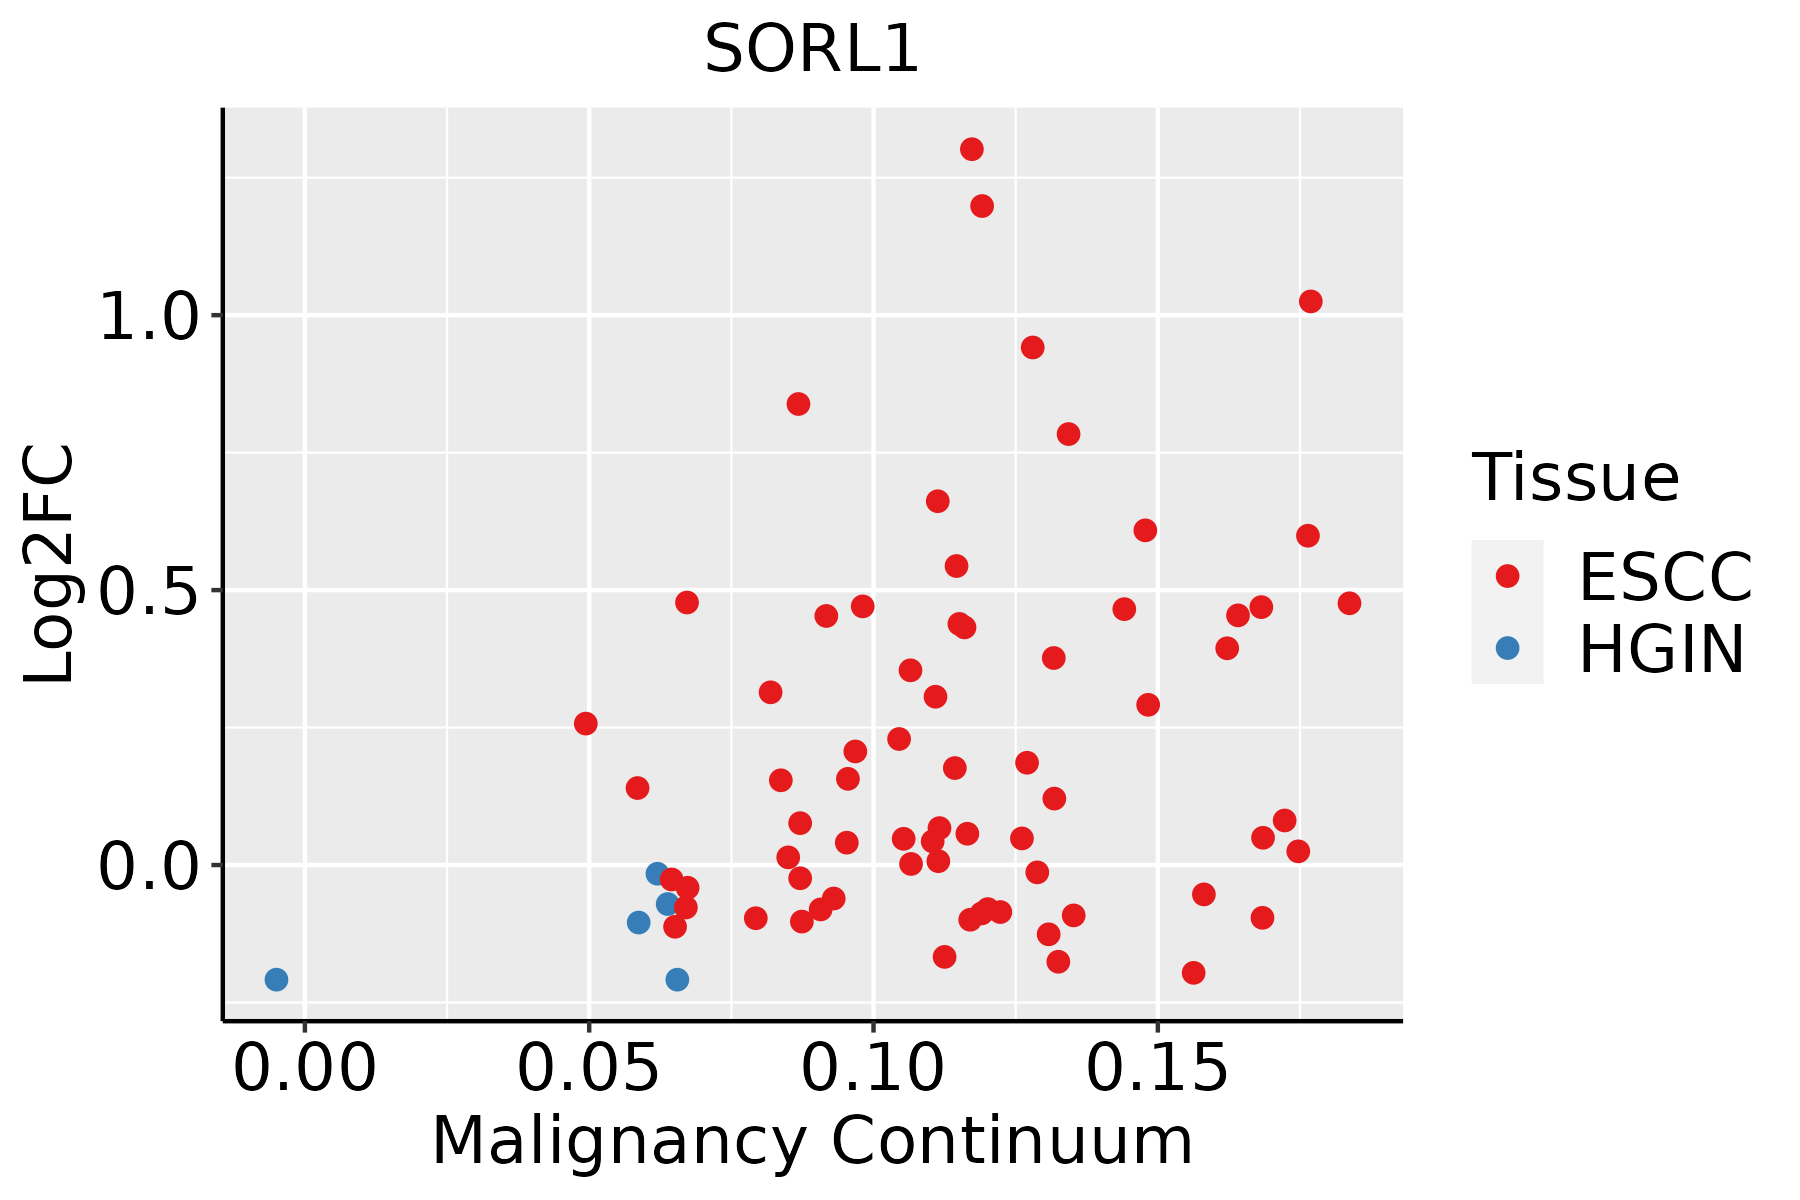 | ESCC: Esophageal squamous cell carcinoma |
| HGIN: High-grade intraepithelial neoplasias |
| LGIN: Low-grade intraepithelial neoplasias |
| Liver |  | HCC: Hepatocellular carcinoma |
| NAFLD: Non-alcoholic fatty liver disease |
| Lung | 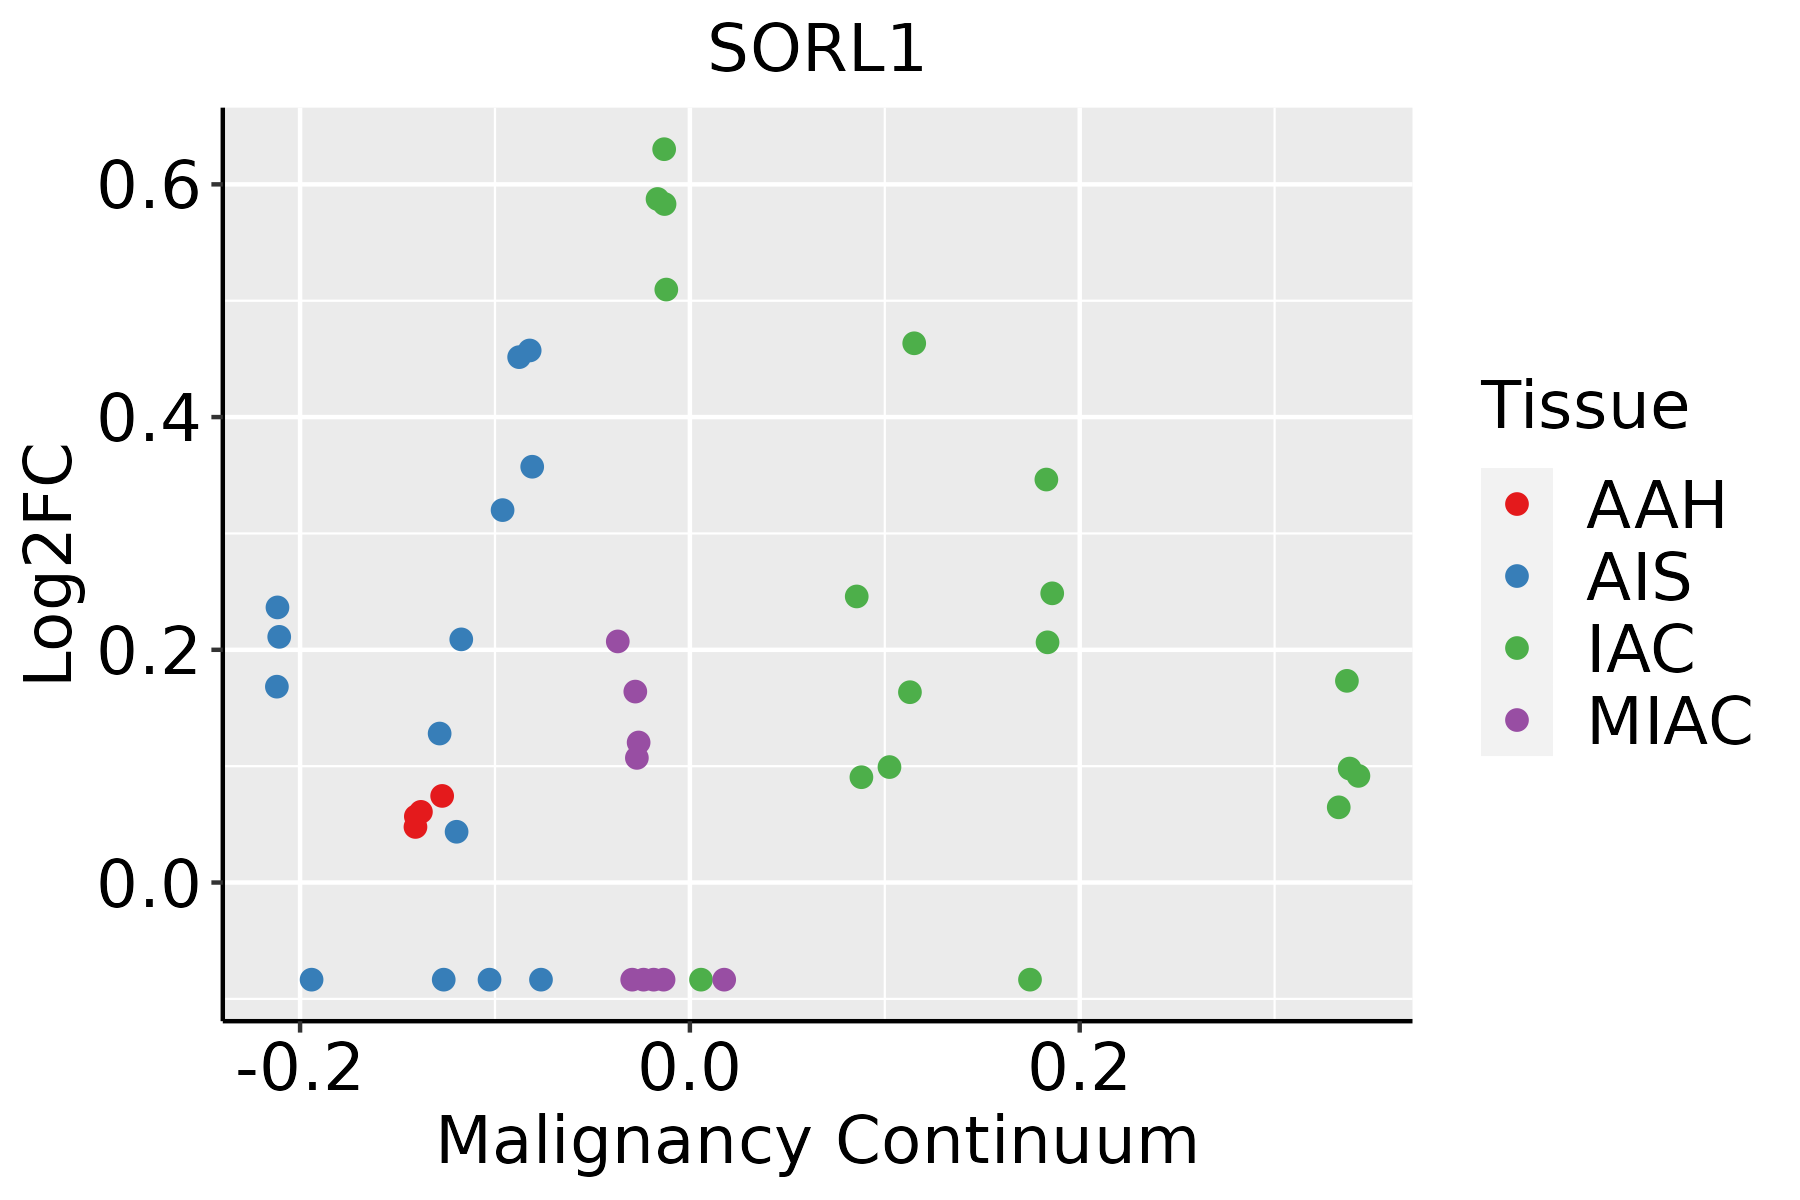 | AAH: Atypical adenomatous hyperplasia |
| AIS: Adenocarcinoma in situ |
| IAC: Invasive lung adenocarcinoma |
| MIA: Minimally invasive adenocarcinoma |
| Oral Cavity | 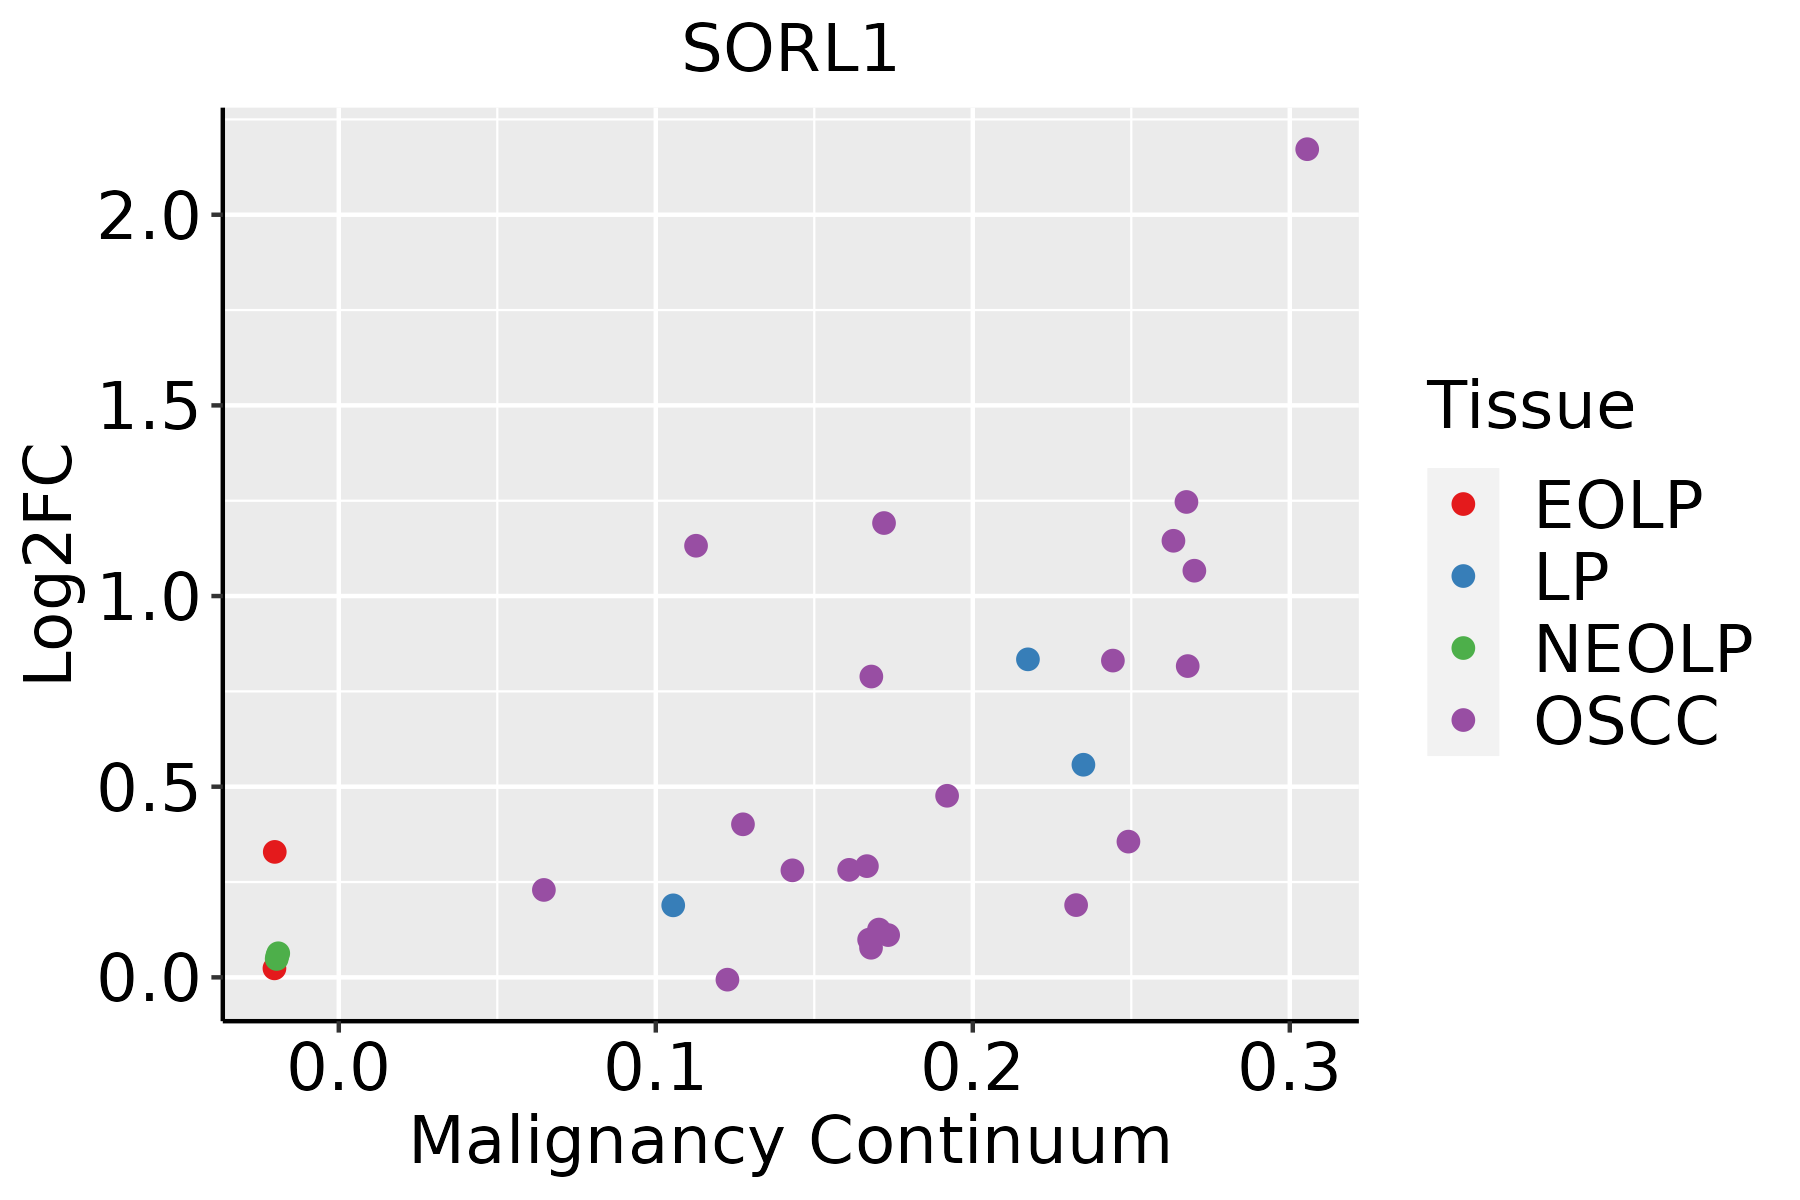 | EOLP: Erosive Oral lichen planus |
| LP: leukoplakia |
| NEOLP: Non-erosive oral lichen planus |
| OSCC: Oral squamous cell carcinoma |
| Prostate | 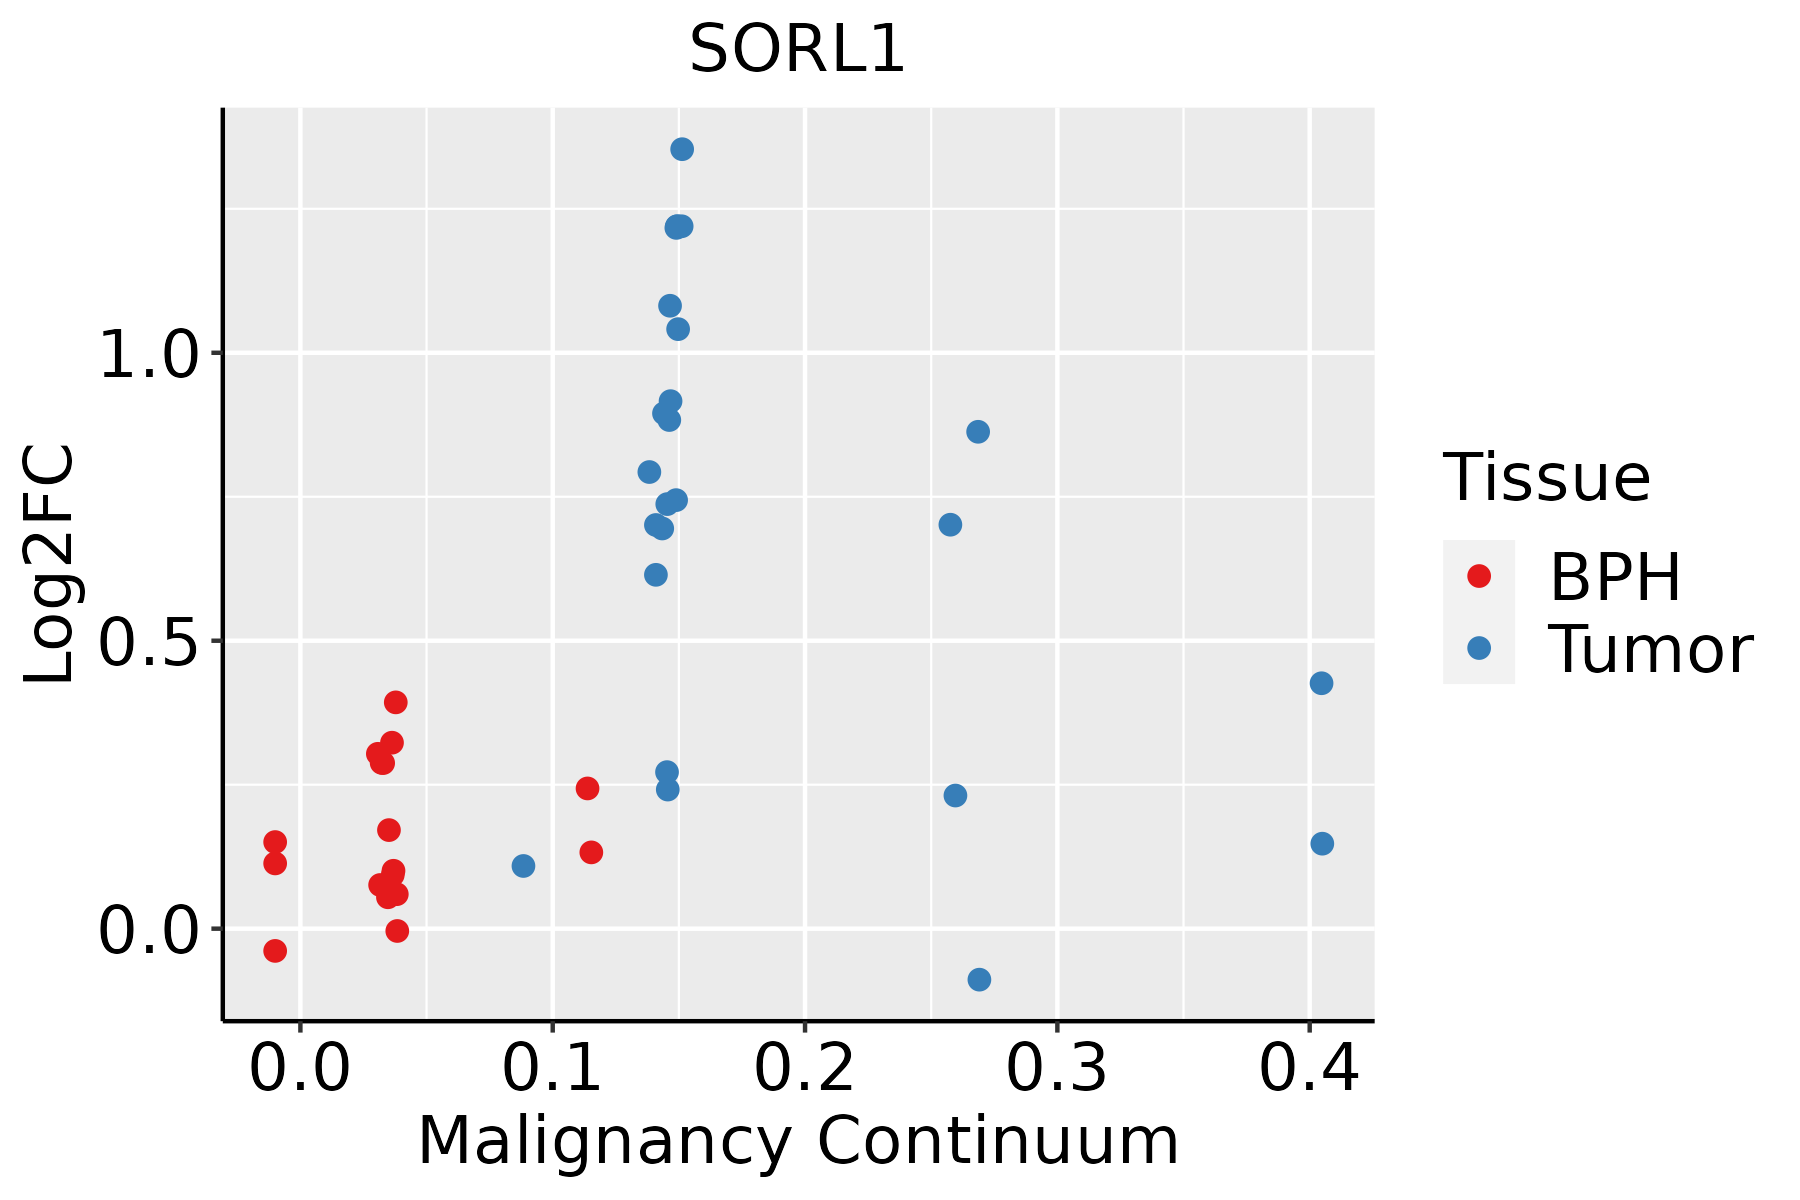 | BPH: Benign Prostatic Hyperplasia |
| Skin | 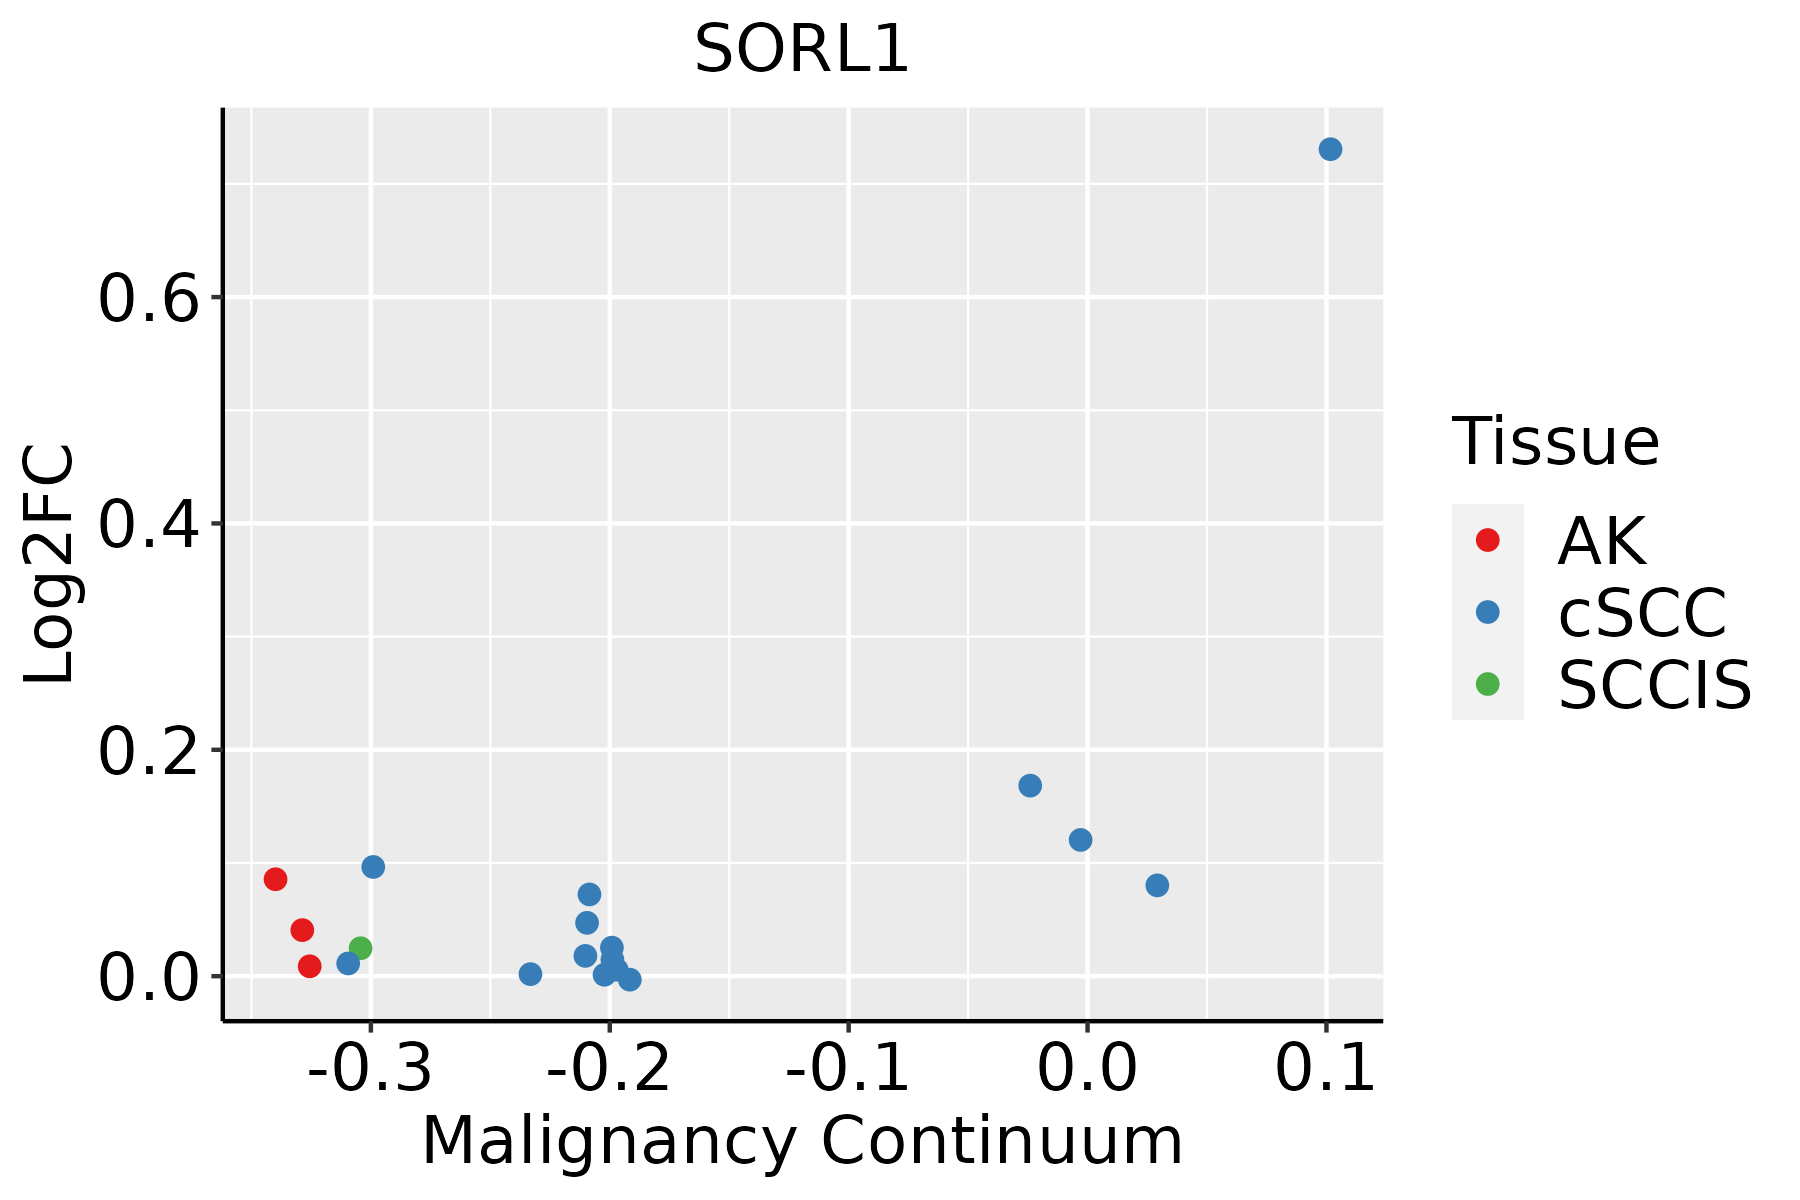 | AK: Actinic keratosis |
| cSCC: Cutaneous squamous cell carcinoma |
| SCCIS:squamous cell carcinoma in situ |
| GO ID | Tissue | Disease Stage | Description | Gene Ratio | Bg Ratio | pvalue | p.adjust | Count |
| GO:00434091 | Colorectum | SER | negative regulation of MAPK cascade | 45/2897 | 180/18723 | 5.81e-04 | 7.98e-03 | 45 |
| GO:19012141 | Colorectum | SER | regulation of neuron death | 71/2897 | 319/18723 | 7.95e-04 | 1.00e-02 | 71 |
| GO:0051346 | Colorectum | SER | negative regulation of hydrolase activity | 82/2897 | 379/18723 | 8.19e-04 | 1.01e-02 | 82 |
| GO:00442421 | Colorectum | SER | cellular lipid catabolic process | 51/2897 | 214/18723 | 8.60e-04 | 1.05e-02 | 51 |
| GO:00068881 | Colorectum | SER | endoplasmic reticulum to Golgi vesicle-mediated transport | 34/2897 | 130/18723 | 1.13e-03 | 1.29e-02 | 34 |
| GO:19012151 | Colorectum | SER | negative regulation of neuron death | 49/2897 | 208/18723 | 1.40e-03 | 1.53e-02 | 49 |
| GO:00511001 | Colorectum | SER | negative regulation of binding | 40/2897 | 162/18723 | 1.46e-03 | 1.59e-02 | 40 |
| GO:00320911 | Colorectum | SER | negative regulation of protein binding | 26/2897 | 94/18723 | 1.76e-03 | 1.81e-02 | 26 |
| GO:00451851 | Colorectum | SER | maintenance of protein location | 26/2897 | 94/18723 | 1.76e-03 | 1.81e-02 | 26 |
| GO:19036491 | Colorectum | SER | regulation of cytoplasmic transport | 11/2897 | 28/18723 | 1.98e-03 | 1.98e-02 | 11 |
| GO:0046486 | Colorectum | SER | glycerolipid metabolic process | 82/2897 | 392/18723 | 2.26e-03 | 2.17e-02 | 82 |
| GO:0010466 | Colorectum | SER | negative regulation of peptidase activity | 57/2897 | 262/18723 | 4.15e-03 | 3.38e-02 | 57 |
| GO:0032527 | Colorectum | SER | protein exit from endoplasmic reticulum | 15/2897 | 48/18723 | 4.60e-03 | 3.64e-02 | 15 |
| GO:00726651 | Colorectum | SER | protein localization to vacuole | 19/2897 | 67/18723 | 5.14e-03 | 3.93e-02 | 19 |
| GO:00719001 | Colorectum | SER | regulation of protein serine/threonine kinase activity | 74/2897 | 359/18723 | 5.22e-03 | 3.96e-02 | 74 |
| GO:00360101 | Colorectum | SER | protein localization to endosome | 9/2897 | 24/18723 | 7.19e-03 | 4.99e-02 | 9 |
| GO:00516511 | Colorectum | SER | maintenance of location in cell | 47/2897 | 214/18723 | 7.20e-03 | 4.99e-02 | 47 |
| GO:00421762 | Colorectum | MSS | regulation of protein catabolic process | 145/3467 | 391/18723 | 2.03e-18 | 1.17e-15 | 145 |
| GO:00098962 | Colorectum | MSS | positive regulation of catabolic process | 163/3467 | 492/18723 | 3.10e-15 | 9.22e-13 | 163 |
| GO:19038292 | Colorectum | MSS | positive regulation of cellular protein localization | 103/3467 | 276/18723 | 1.12e-13 | 2.67e-11 | 103 |
| Hugo Symbol | Variant Class | Variant Classification | dbSNP RS | HGVSc | HGVSp | HGVSp Short | SWISSPROT | BIOTYPE | SIFT | PolyPhen | Tumor Sample Barcode | Tissue | Histology | Sex | Age | Stage | Therapy Types | Drugs | Outcome |
| SORL1 | SNV | Missense_Mutation | novel | c.1999N>A | p.Asp667Asn | p.D667N | Q92673 | protein_coding | deleterious(0) | probably_damaging(0.997) | TCGA-A8-A08H-01 | Breast | breast invasive carcinoma | Female | >=65 | I/II | Unknown | Unknown | SD |
| SORL1 | SNV | Missense_Mutation | | c.883N>A | p.Glu295Lys | p.E295K | Q92673 | protein_coding | deleterious(0.02) | probably_damaging(0.989) | TCGA-AO-A0JC-01 | Breast | breast invasive carcinoma | Female | <65 | I/II | Chemotherapy | fluorouracil | SD |
| SORL1 | SNV | Missense_Mutation | novel | c.3388A>T | p.Thr1130Ser | p.T1130S | Q92673 | protein_coding | tolerated(0.71) | benign(0.007) | TCGA-BH-A0E2-01 | Breast | breast invasive carcinoma | Female | <65 | III/IV | Chemotherapy | doxorubicin | SD |
| SORL1 | SNV | Missense_Mutation | novel | c.529N>C | p.Tyr177His | p.Y177H | Q92673 | protein_coding | deleterious(0) | probably_damaging(0.996) | TCGA-BH-A18G-01 | Breast | breast invasive carcinoma | Female | >=65 | I/II | Unknown | Unknown | SD |
| SORL1 | SNV | Missense_Mutation | | c.1426C>T | p.His476Tyr | p.H476Y | Q92673 | protein_coding | deleterious(0) | possibly_damaging(0.852) | TCGA-D8-A1XM-01 | Breast | breast invasive carcinoma | Female | <65 | I/II | Unknown | Unknown | SD |
| SORL1 | SNV | Missense_Mutation | rs149445303 | c.5627N>T | p.Thr1876Met | p.T1876M | Q92673 | protein_coding | deleterious(0.01) | probably_damaging(0.997) | TCGA-E9-A243-01 | Breast | breast invasive carcinoma | Female | <65 | I/II | Chemotherapy | 5-fluorouracil | PD |
| SORL1 | insertion | Frame_Shift_Ins | novel | c.4917_4918insATTGTTGGGATTCATCTCATTGTTATTTCTGTTACTCAAACCA | p.Asp1640IlefsTer60 | p.D1640Ifs*60 | Q92673 | protein_coding | | | TCGA-A8-A07R-01 | Breast | breast invasive carcinoma | Female | >=65 | III/IV | Ancillary | zoledronic | SD |
| SORL1 | insertion | Frame_Shift_Ins | novel | c.2838_2839insTATTA | p.Thr947TyrfsTer2 | p.T947Yfs*2 | Q92673 | protein_coding | | | TCGA-A8-A07U-01 | Breast | breast invasive carcinoma | Female | >=65 | III/IV | Chemotherapy | 5-fluorouracil | SD |
| SORL1 | insertion | In_Frame_Ins | novel | c.4008_4009insCTGTATCAGATGGCACTCCCAGCGTGCCGTAGCCCCTTACCC | p.Val1336_Cys1337insLeuTyrGlnMetAlaLeuProAlaCysArgSerProLeuPro | p.V1336_C1337insLYQMALPACRSPLP | Q92673 | protein_coding | | | TCGA-A8-A097-01 | Breast | breast invasive carcinoma | Female | >=65 | I/II | Hormone Therapy | tamoxiphen | SD |
| SORL1 | insertion | Frame_Shift_Ins | novel | c.5847_5848insTTTTGCAAATGTTCCGGTGCCCCTGCTGCTCTTGGAT | p.Ile1950PhefsTer20 | p.I1950Ffs*20 | Q92673 | protein_coding | | | TCGA-B6-A0IM-01 | Breast | breast invasive carcinoma | Female | >=65 | I/II | Unknown | Unknown | SD |


