Schematic overview of the cellular and molecular mechanisms involved in the cancer progression, including the proposed cellular and molecular mechanisms in cancer cells trajectory. AT1: alveolar type 1 cells; AT2: alveolar type 2 cells; AAH: atypical adenomatous hyperplasia; AIS: adenocarcinoma in situ; MIA: minimally invasive adenocarcinoma; IA: invasive adenocarcinoma; EMT: epithelial-mesenchymal transition

Home

Download

Statistics

Help

Contact

Center for Computational Systems Medicine
leaf

Gene summary

leaf

Malignant transformation analysis

leaf

Malignant transformation related pathway analysis

leaf

Cell-cell communication analysis

leaf

Single-cell gene regulatory network inference analysis

leaf

Somatic mutation of malignant transformation related genes

leaf

Related drugs of malignant transformation related genes

Gene: SON

Gene summary for SON

check button Gene summary.

Gene informationSpeciesHuman
Gene symbol

SON

Gene ID

6651

Gene nameSON DNA and RNA binding protein
Gene AliasBASS1
Cytomap21q22.11
Gene Typeprotein-coding
GO ID

GO:0000226

UniProtAcc

P18583


Top

Malignant transformation analysis

check button Identification of the aberrant gene expression in precancerous and cancerous lesions by comparing the gene expression of stem-like cells in diseased tissues with normal stem cells
check button Malignant transformation involving gene list.
Entrez IDSymbolReplicatesSpeciesOrganTissueAdj P-valueLog2FCMalignancy
6651SONHTA11_3410_2000001011HumanColorectumAD5.81e-09-4.21e-010.0155
6651SONHTA11_347_2000001011HumanColorectumAD2.45e-084.38e-01-0.1954
6651SONHTA11_99999965104_69814HumanColorectumMSS2.60e-137.54e-010.281
6651SONA002-C-010HumanColorectumFAP3.02e-06-1.11e-010.242
6651SONA001-C-207HumanColorectumFAP3.39e-041.93e-010.1278
6651SONA015-C-203HumanColorectumFAP1.47e-341.61e-01-0.1294
6651SONA015-C-204HumanColorectumFAP2.10e-072.04e-01-0.0228
6651SONA014-C-040HumanColorectumFAP7.23e-052.69e-01-0.1184
6651SONA002-C-201HumanColorectumFAP1.25e-152.66e-010.0324
6651SONA002-C-203HumanColorectumFAP4.32e-062.69e-010.2786
6651SONA001-C-119HumanColorectumFAP6.21e-071.23e-01-0.1557
6651SONA001-C-108HumanColorectumFAP1.89e-264.21e-01-0.0272
6651SONA002-C-021HumanColorectumFAP6.28e-063.75e-010.1171
6651SONA002-C-205HumanColorectumFAP8.06e-303.34e-01-0.1236
6651SONA001-C-104HumanColorectumFAP7.57e-083.24e-010.0184
6651SONA015-C-005HumanColorectumFAP1.11e-073.42e-01-0.0336
6651SONA015-C-006HumanColorectumFAP1.80e-161.37e-01-0.0994
6651SONA015-C-106HumanColorectumFAP3.21e-152.47e-01-0.0511
6651SONA002-C-114HumanColorectumFAP7.35e-232.83e-01-0.1561
6651SONA015-C-104HumanColorectumFAP9.82e-423.09e-01-0.1899
Page: 1 2 3 4 5 6 7 8 9 10 11 12 

check button Transcriptomic changes along malignancy continuum.
TissueExpression DynamicsAbbreviation
Colorectum (GSE201348)The image shows the transcriptomic changes along malignancy continuum.log2FC in expression of this searched gene in stem-like cells from each diseased tissue sample relative to stem-like cells in normal samples in each tissue plotted against the malignancy continuum. Samples are colored based on if they are from different disease stage.FAP: Familial adenomatous polyposis
CRC: Colorectal cancer
Colorectum (HTA11)The image shows the transcriptomic changes along malignancy continuum.log2FC in expression of this searched gene in stem-like cells from each diseased tissue sample relative to stem-like cells in normal samples in each tissue plotted against the malignancy continuum. Samples are colored based on if they are from different disease stage.AD: Adenomas
SER: Sessile serrated lesions
MSI-H: Microsatellite-high colorectal cancer
MSS: Microsatellite stable colorectal cancer
EndometriumThe image shows the transcriptomic changes along malignancy continuum.log2FC in expression of this searched gene in stem-like cells from each diseased tissue sample relative to stem-like cells in normal samples in each tissue plotted against the malignancy continuum. Samples are colored based on if they are from different disease stage.
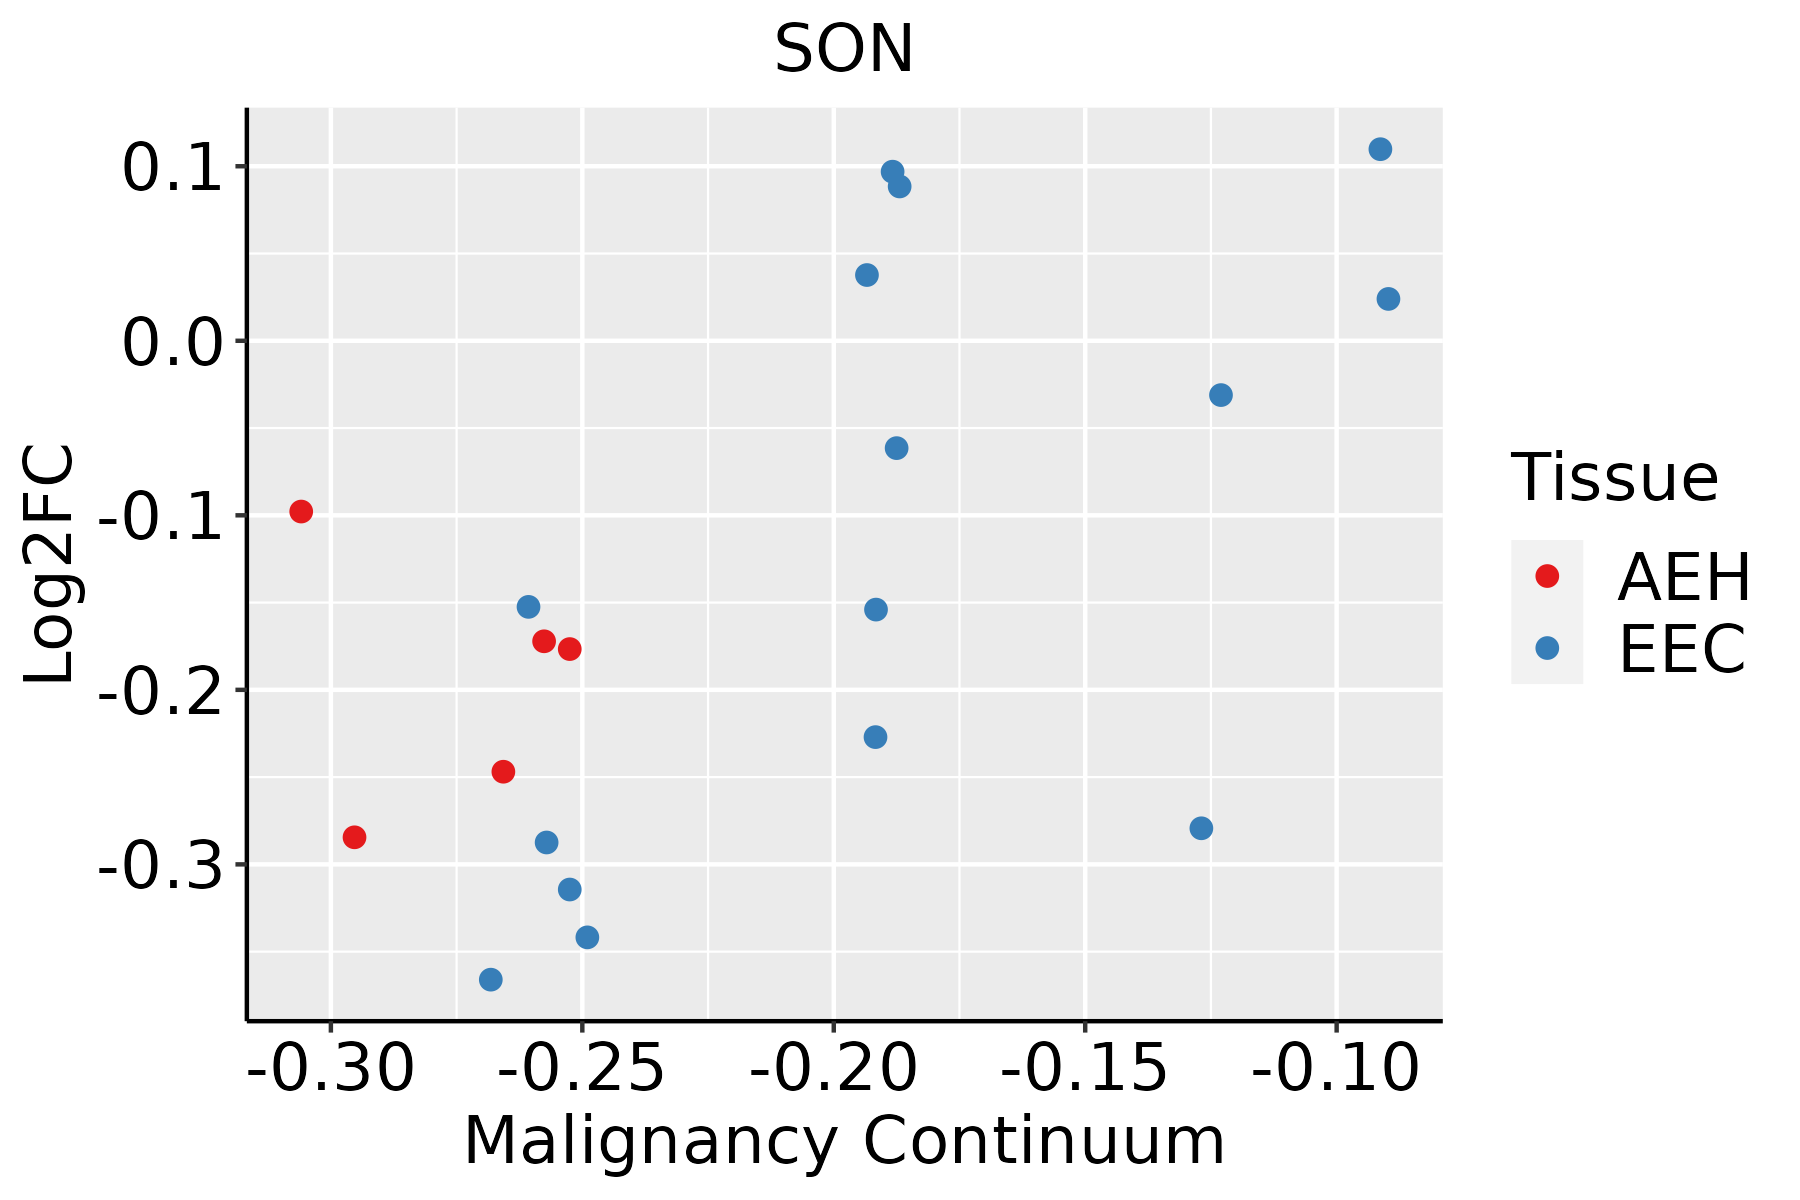
AEH: Atypical endometrial hyperplasia
EEC: Endometrioid Cancer
EsophagusThe image shows the transcriptomic changes along malignancy continuum.log2FC in expression of this searched gene in stem-like cells from each diseased tissue sample relative to stem-like cells in normal samples in each tissue plotted against the malignancy continuum. Samples are colored based on if they are from different disease stage.
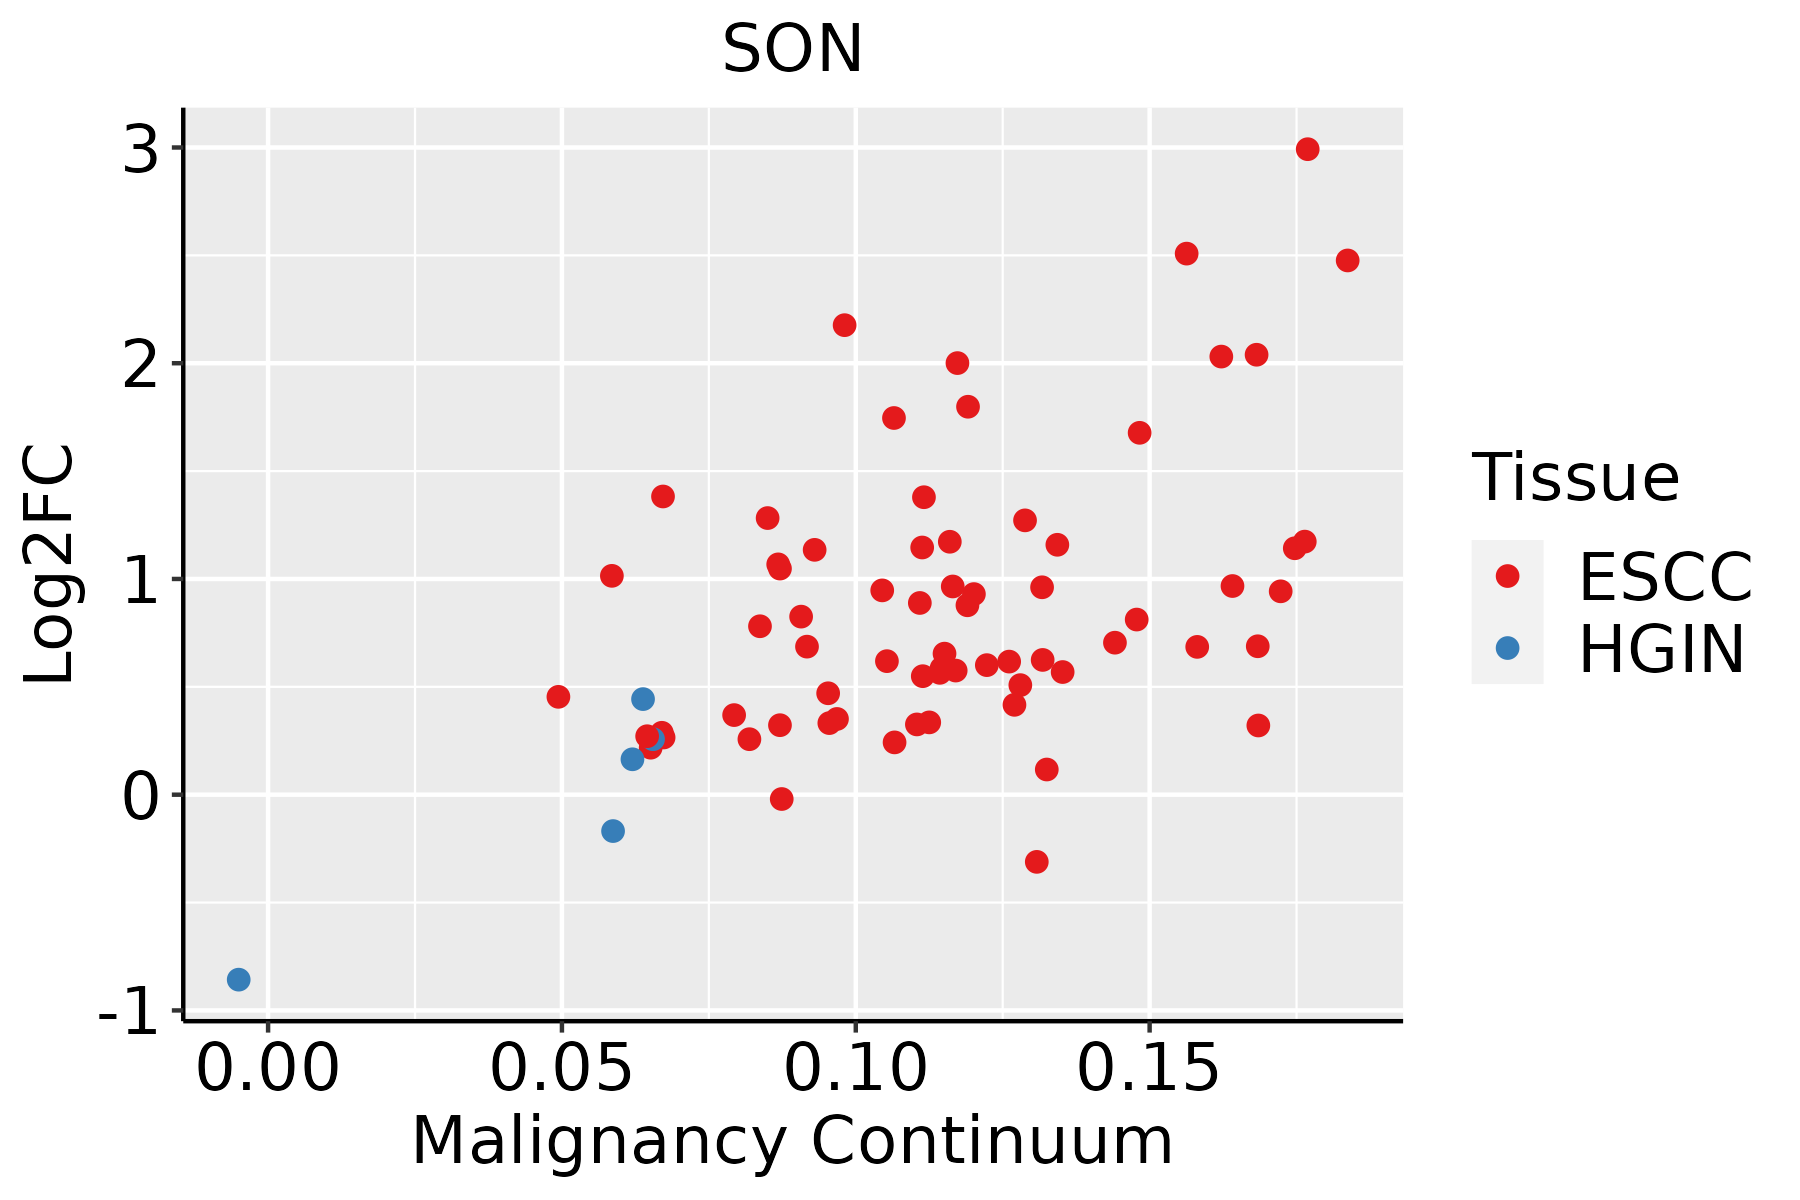
ESCC: Esophageal squamous cell carcinoma
HGIN: High-grade intraepithelial neoplasias
LGIN: Low-grade intraepithelial neoplasias
LiverThe image shows the transcriptomic changes along malignancy continuum.log2FC in expression of this searched gene in stem-like cells from each diseased tissue sample relative to stem-like cells in normal samples in each tissue plotted against the malignancy continuum. Samples are colored based on if they are from different disease stage.HCC: Hepatocellular carcinoma
NAFLD: Non-alcoholic fatty liver disease
Oral CavityThe image shows the transcriptomic changes along malignancy continuum.log2FC in expression of this searched gene in stem-like cells from each diseased tissue sample relative to stem-like cells in normal samples in each tissue plotted against the malignancy continuum. Samples are colored based on if they are from different disease stage.
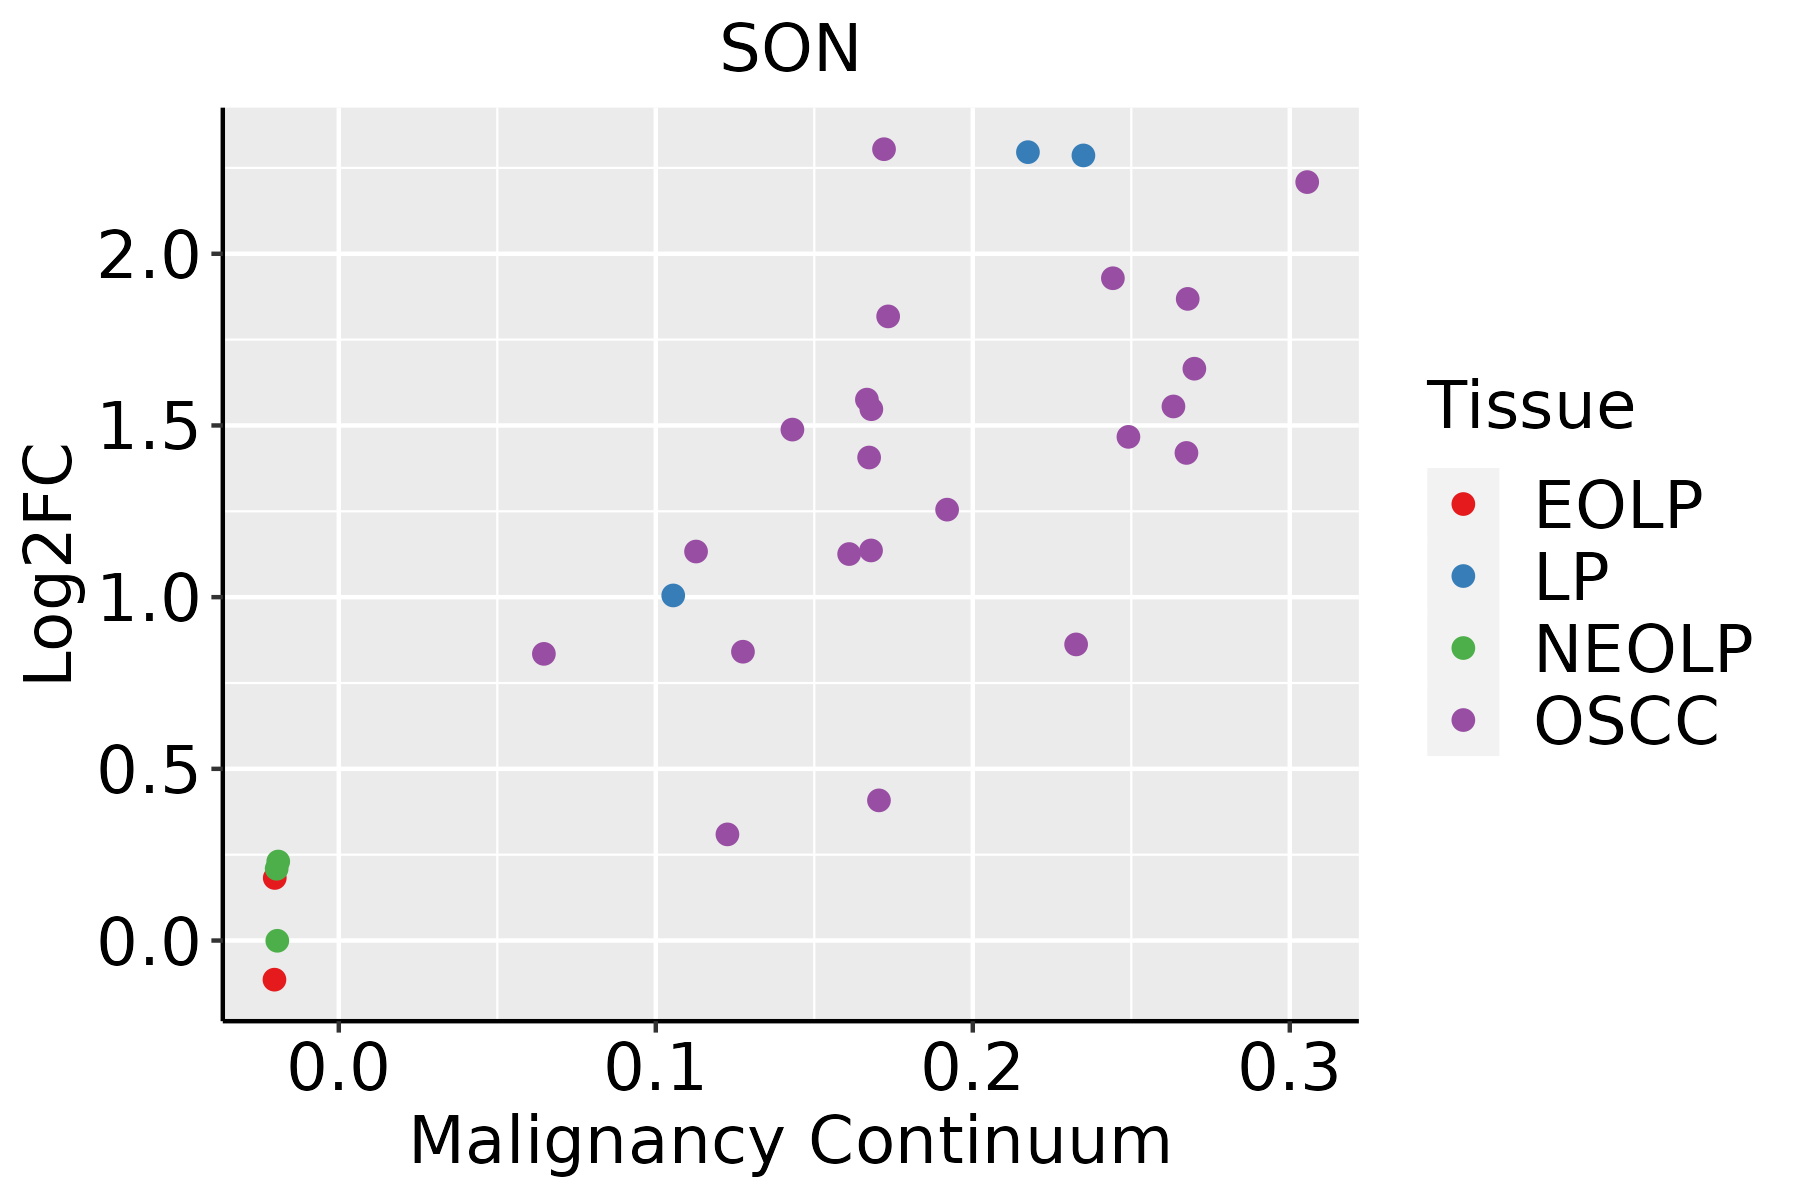
EOLP: Erosive Oral lichen planus
LP: leukoplakia
NEOLP: Non-erosive oral lichen planus
OSCC: Oral squamous cell carcinoma
ProstateThe image shows the transcriptomic changes along malignancy continuum.log2FC in expression of this searched gene in stem-like cells from each diseased tissue sample relative to stem-like cells in normal samples in each tissue plotted against the malignancy continuum. Samples are colored based on if they are from different disease stage.
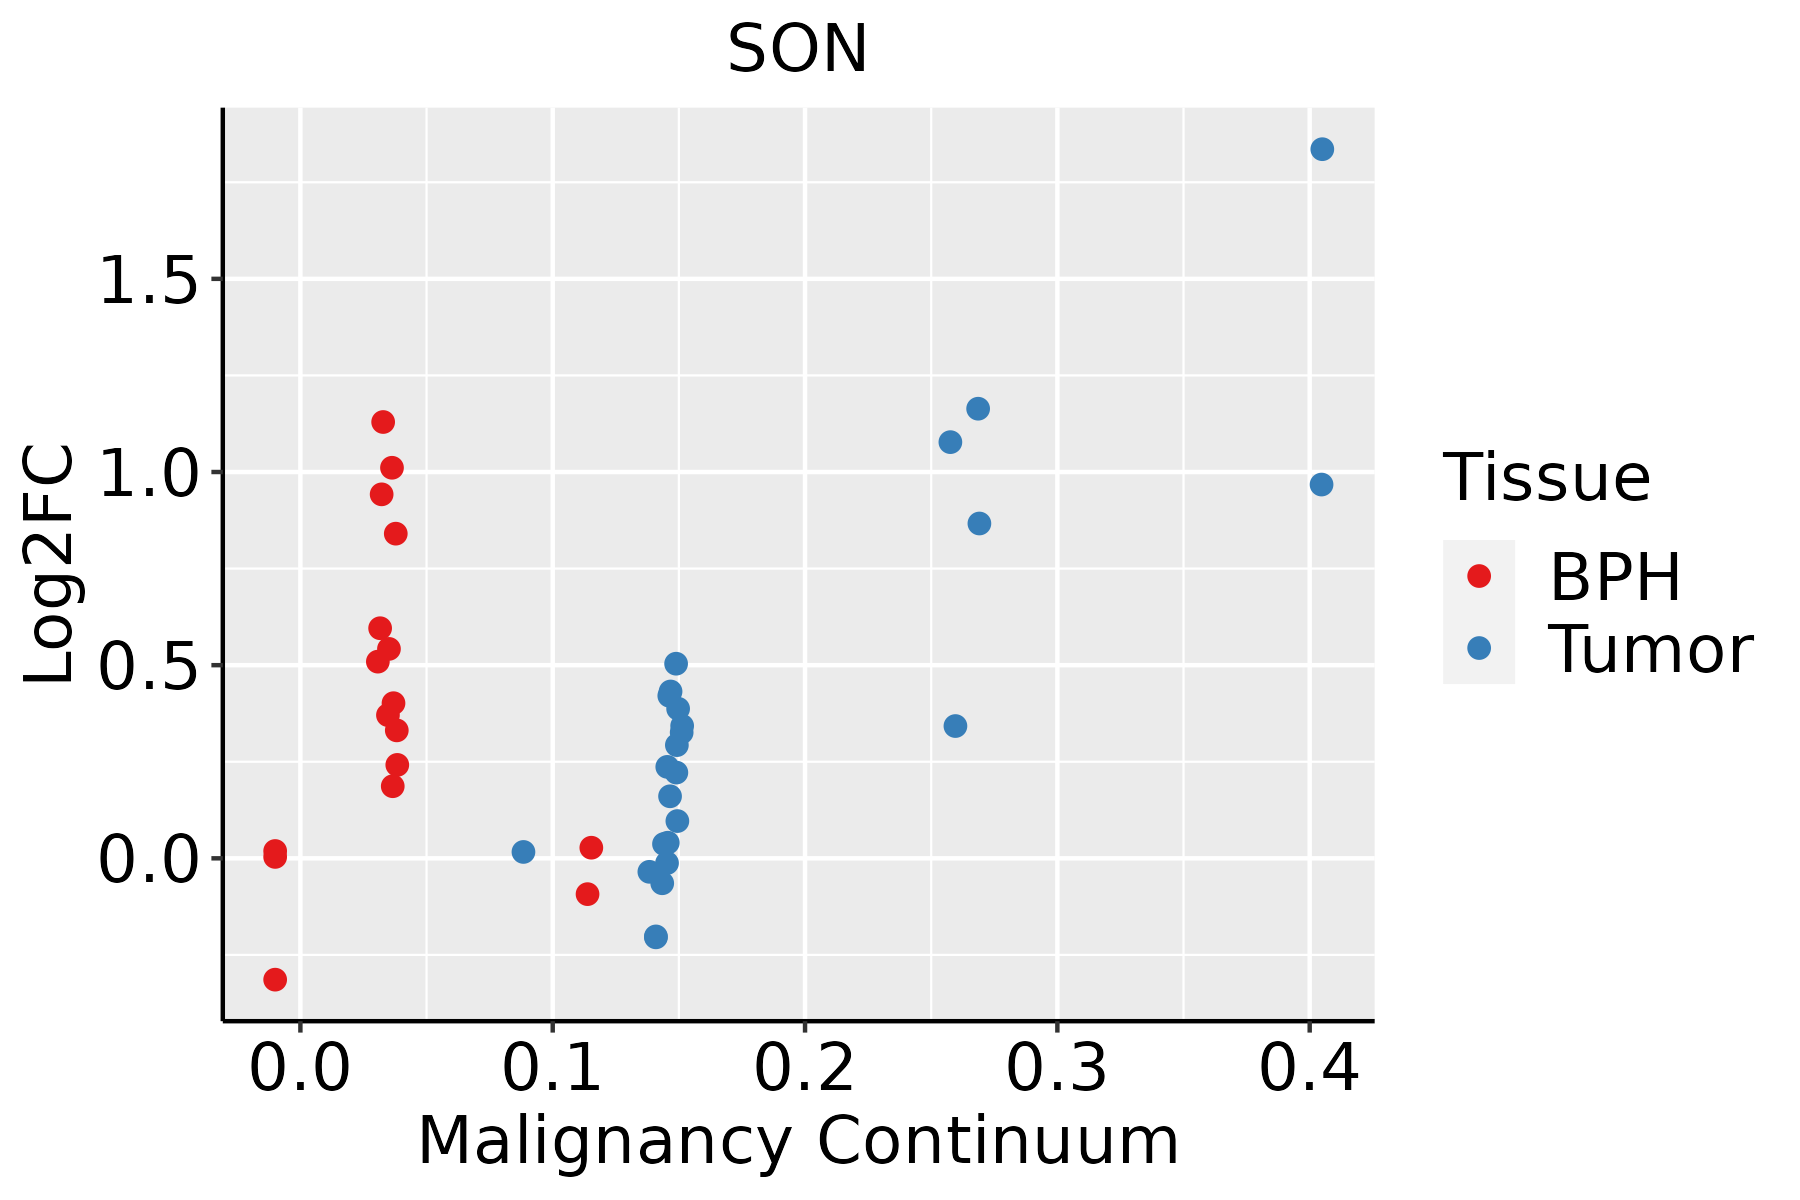
BPH: Benign Prostatic Hyperplasia
SkinThe image shows the transcriptomic changes along malignancy continuum.log2FC in expression of this searched gene in stem-like cells from each diseased tissue sample relative to stem-like cells in normal samples in each tissue plotted against the malignancy continuum. Samples are colored based on if they are from different disease stage.
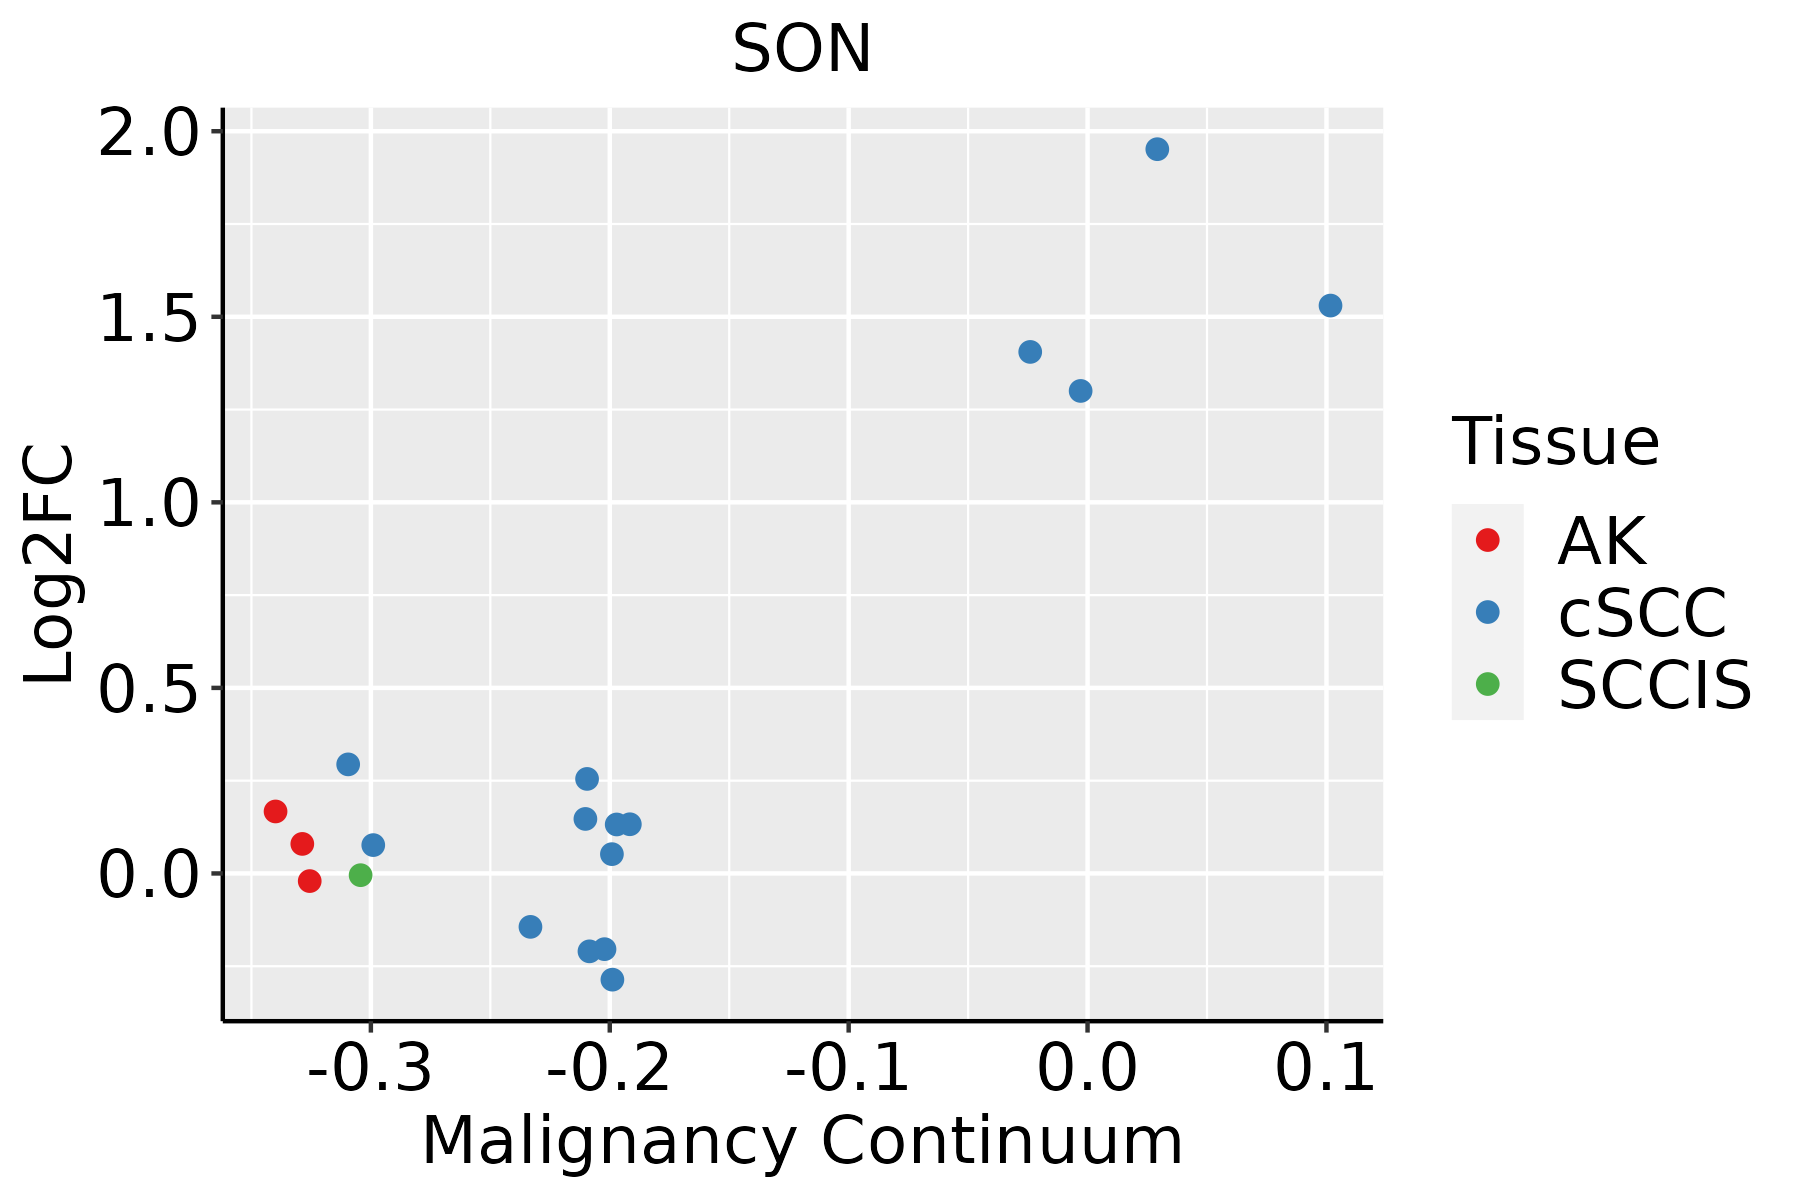
AK: Actinic keratosis
cSCC: Cutaneous squamous cell carcinoma
SCCIS:squamous cell carcinoma in situ
ThyroidThe image shows the transcriptomic changes along malignancy continuum.log2FC in expression of this searched gene in stem-like cells from each diseased tissue sample relative to stem-like cells in normal samples in each tissue plotted against the malignancy continuum. Samples are colored based on if they are from different disease stage.
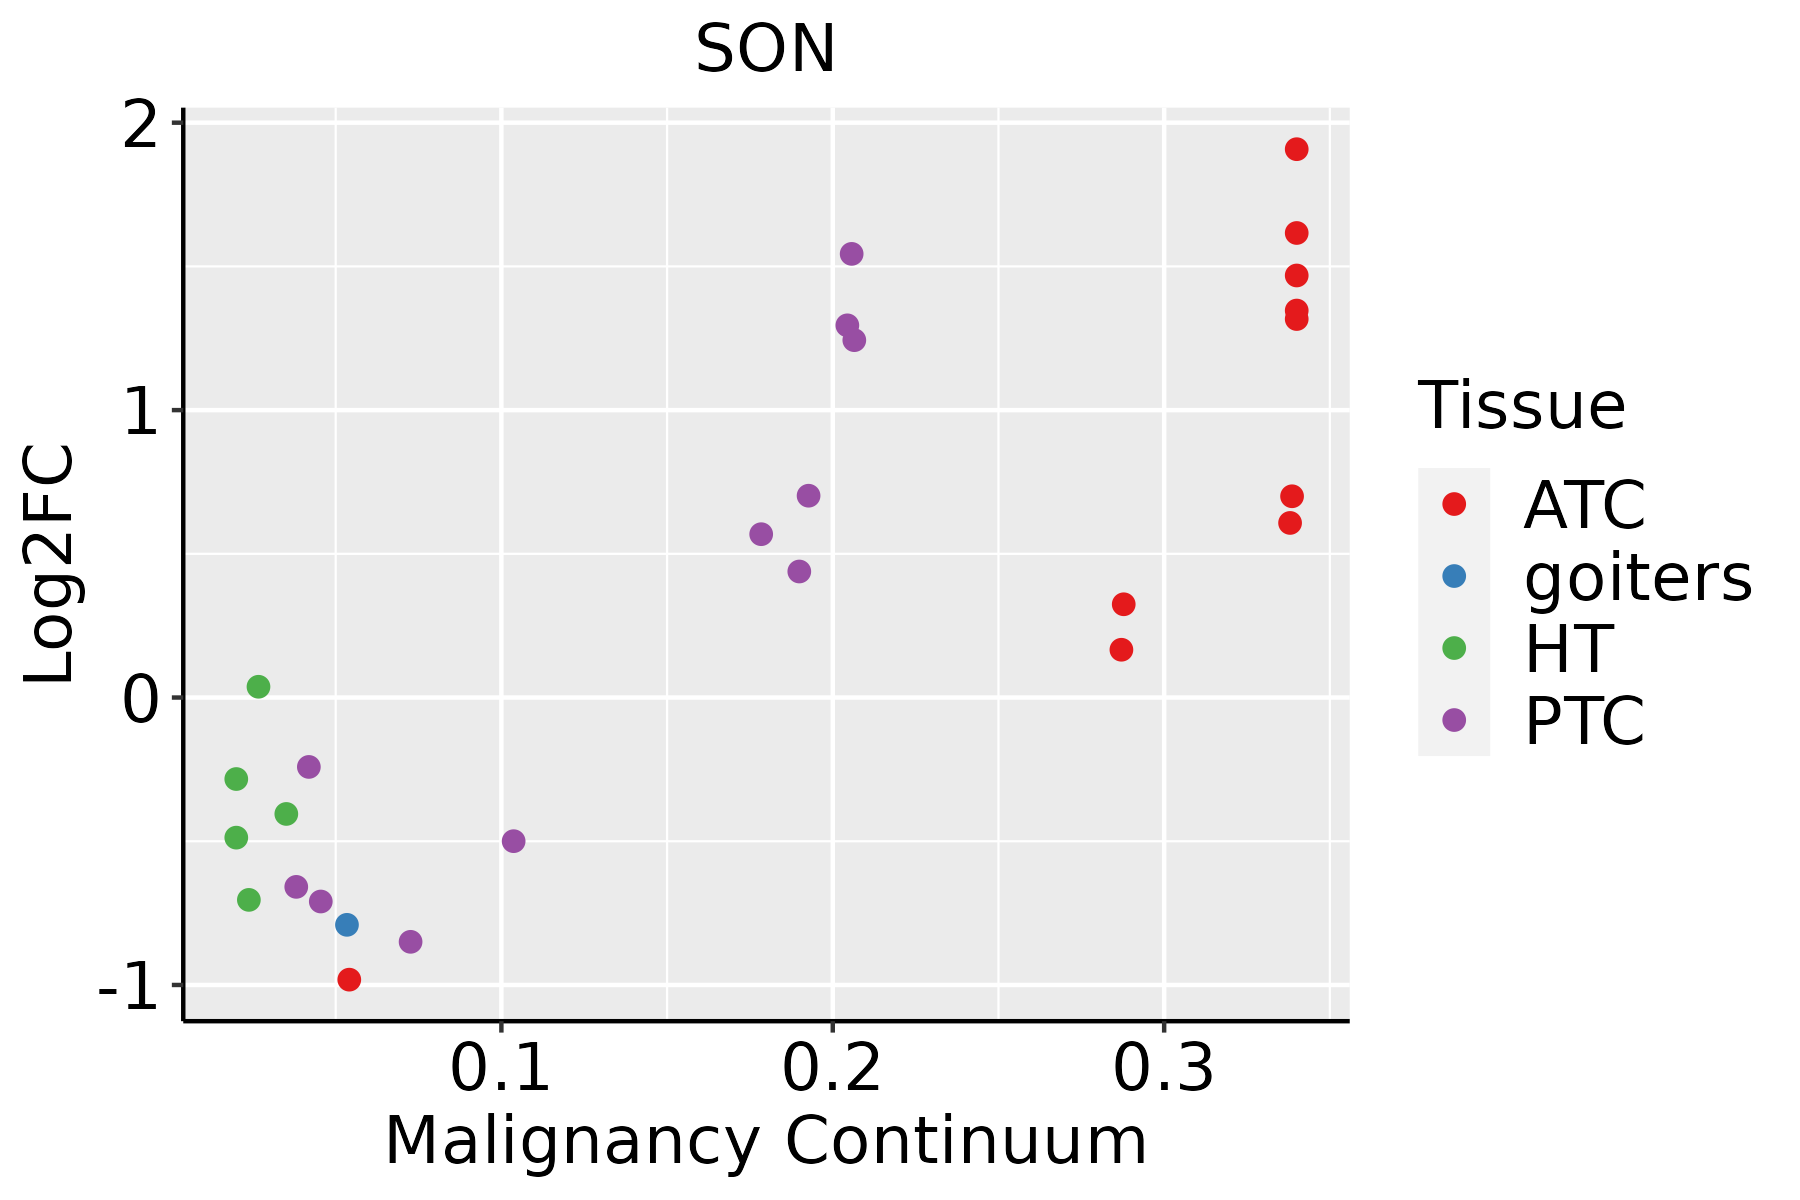
ATC: Anaplastic thyroid cancer
HT: Hashimoto's thyroiditis
PTC: Papillary thyroid cancer
∗log2FC in expression of this searched gene in stem-like cells from each diseased tissue sample relative to stem-like cells in normal samples in each tissue plotted against the malignancy continuum. Samples are colored based on if they are from different disease stage.

Top

Malignant transformation related pathway analysis

check buttonFind out the enriched GO biological processes and KEGG pathways involved in transition from healthy to precancer to cancer
check button Figure of enriched GO biological processes.
TissueDisease StageEnriched GO biological Processes
ColorectumADGO analysis - Figure of enriched GO biological processes: Top 15 enriched GO BP terms are showed in the bar plot of each disease state in each tissue. Each row represents a significant GO biological process which is colored according to the -log10(p.adjust).
ColorectumSERGO analysis - Figure of enriched GO biological processes: Top 15 enriched GO BP terms are showed in the bar plot of each disease state in each tissue. Each row represents a significant GO biological process which is colored according to the -log10(p.adjust).
ColorectumMSSGO analysis - Figure of enriched GO biological processes: Top 15 enriched GO BP terms are showed in the bar plot of each disease state in each tissue. Each row represents a significant GO biological process which is colored according to the -log10(p.adjust).
ColorectumMSI-HGO analysis - Figure of enriched GO biological processes: Top 15 enriched GO BP terms are showed in the bar plot of each disease state in each tissue. Each row represents a significant GO biological process which is colored according to the -log10(p.adjust).
ColorectumFAPGO analysis - Figure of enriched GO biological processes: Top 15 enriched GO BP terms are showed in the bar plot of each disease state in each tissue. Each row represents a significant GO biological process which is colored according to the -log10(p.adjust).
∗Top 15 enriched GO BP terms are showed in the bar plot of each disease state in each tissue. Each row represents a significant GO biological process which is colored according to the -log10(p.adjust).
Page: 1 2 3 4 5 6 7 8 9 

check button Enriched GO biological processes.
GO IDTissueDisease StageDescriptionGene RatioBg Ratiopvaluep.adjustCount
GO:004277031Oral cavityNEOLPsignal transduction in response to DNA damage30/2005172/187234.92e-032.67e-0230
GO:190331116ProstateBPHregulation of mRNA metabolic process111/3107288/187232.28e-191.17e-16111
GO:000838018ProstateBPHRNA splicing147/3107434/187235.17e-192.29e-16147
GO:004348418ProstateBPHregulation of RNA splicing71/3107148/187236.14e-192.53e-1671
GO:005068415ProstateBPHregulation of mRNA processing64/3107137/187231.73e-163.82e-1464
GO:000037517ProstateBPHRNA splicing, via transesterification reactions114/3107324/187232.19e-164.53e-14114
GO:000037717ProstateBPHRNA splicing, via transesterification reactions with bulged adenosine as nucleophile112/3107320/187236.21e-161.07e-13112
GO:000039817ProstateBPHmRNA splicing, via spliceosome112/3107320/187236.21e-161.07e-13112
GO:004802418ProstateBPHregulation of mRNA splicing, via spliceosome51/3107101/187233.74e-155.26e-1351
GO:00009109ProstateBPHcytokinesis55/3107173/187235.81e-071.15e-0555
GO:00616404ProstateBPHcytoskeleton-dependent cytokinesis31/3107100/187232.63e-042.06e-0331
GO:00002814ProstateBPHmitotic cytokinesis23/310771/187237.95e-045.21e-0323
GO:000838019ProstateTumorRNA splicing153/3246434/187239.15e-205.79e-17153
GO:190331117ProstateTumorregulation of mRNA metabolic process111/3246288/187236.66e-182.30e-15111
GO:004348419ProstateTumorregulation of RNA splicing70/3246148/187233.22e-171.05e-1470
GO:000037518ProstateTumorRNA splicing, via transesterification reactions119/3246324/187233.40e-171.06e-14119
GO:000037718ProstateTumorRNA splicing, via transesterification reactions with bulged adenosine as nucleophile117/3246320/187239.31e-172.22e-14117
GO:000039818ProstateTumormRNA splicing, via spliceosome117/3246320/187239.31e-172.22e-14117
GO:005068416ProstateTumorregulation of mRNA processing64/3246137/187231.55e-152.75e-1364
GO:004802419ProstateTumorregulation of mRNA splicing, via spliceosome51/3246101/187232.29e-142.97e-1251
Page: 1 2 3 4 5 6 7 8 9 10 11 12 13 14 15 16 

check button Enriched KEGG pathways.
Pathway IDTissueDisease StageDescriptionGene RatioBg Ratiopvaluep.adjustqvalueCount
Page: 1 

Top

Cell-cell communication analysis

check buttonIdentification of potential cell-cell interactions between two cell types and their ligand-receptor pairs for different disease states
LigandReceptorLRpairPathwayTissueDisease Stage
Page: 1 

Top

Single-cell gene regulatory network inference analysis

check buttonFind out the significant the regulons (TFs) and the target genes of each regulon across cell types for different disease states
TFCell TypeTissueDisease StageTarget GeneRSSRegulon Activity
∗The dot plots of a searched regulon are shown for all cell subpopulations in each disease state of each tissue based on the regulon specific score inferred using pySCENIC and by calculating the average expression.
Page: 1 

Top

Somatic mutation of malignant transformation related genes

check buttonAnnotation of somatic variants for genes involved in malignant transformation
Hugo SymbolVariant ClassVariant ClassificationdbSNP RSHGVScHGVSpHGVSp ShortSWISSPROTBIOTYPESIFTPolyPhenTumor Sample BarcodeTissueHistologySexAgeStageTherapy TypesDrugsOutcome
SONSNVMissense_Mutationnovelc.220N>Cp.Asp74Hisp.D74HP18583protein_codingdeleterious_low_confidence(0)probably_damaging(0.999)TCGA-3C-AALI-01Breastbreast invasive carcinomaFemale<65I/IIUnspecificPoly EComplete Response
SONSNVMissense_Mutationc.7184A>Gp.Asp2395Glyp.D2395GP18583protein_codingdeleterious_low_confidence(0)probably_damaging(0.972)TCGA-A7-A0CE-01Breastbreast invasive carcinomaFemale<65I/IIChemotherapyadriamycinSD
SONSNVMissense_Mutationc.2183C>Ap.Ser728Tyrp.S728YP18583protein_codingdeleterious_low_confidence(0)probably_damaging(0.993)TCGA-AC-A23H-01Breastbreast invasive carcinomaFemale>=65I/IIUnknownUnknownPD
SONSNVMissense_Mutationnovelc.1003N>Ap.Glu335Lysp.E335KP18583protein_codingdeleterious_low_confidence(0)possibly_damaging(0.704)TCGA-AC-A8OS-01Breastbreast invasive carcinomaFemale>=65I/IIUnknownUnknownSD
SONSNVMissense_Mutationc.496N>Ap.Ala166Thrp.A166TP18583protein_codingdeleterious_low_confidence(0)possibly_damaging(0.843)TCGA-AN-A0AK-01Breastbreast invasive carcinomaFemale>=65I/IIUnknownUnknownSD
SONSNVMissense_Mutationrs200910529c.5510N>Ap.Arg1837Hisp.R1837HP18583protein_codingdeleterious_low_confidence(0)probably_damaging(0.948)TCGA-AN-A0AK-01Breastbreast invasive carcinomaFemale>=65I/IIUnknownUnknownSD
SONSNVMissense_Mutationc.5519C>Tp.Thr1840Ilep.T1840IP18583protein_codingdeleterious_low_confidence(0)possibly_damaging(0.86)TCGA-BH-A0HF-01Breastbreast invasive carcinomaFemale>=65I/IIHormone TherapyarimidexSD
SONSNVMissense_Mutationc.5680N>Cp.Ser1894Prop.S1894PP18583protein_codingdeleterious_low_confidence(0)probably_damaging(0.994)TCGA-BH-A18V-01Breastbreast invasive carcinomaFemale<65I/IIUnknownUnknownSD
SONSNVMissense_Mutationc.2268N>Tp.Leu756Phep.L756FP18583protein_codingdeleterious_low_confidence(0)probably_damaging(0.994)TCGA-C8-A12U-01Breastbreast invasive carcinomaFemale<65I/IIUnknownUnknownSD
SONSNVMissense_Mutationc.1169N>Gp.Ser390Cysp.S390CP18583protein_codingdeleterious_low_confidence(0)probably_damaging(0.963)TCGA-C8-A26Y-01Breastbreast invasive carcinomaFemale>=65I/IIUnknownUnknownSD
Page: 1 2 3 4 5 6 7 8 9 10 11 12 13 14 15 16 17 18 19 20 

Top

Related drugs of malignant transformation related genes

check buttonIdentification of chemicals and drugs interact with genes involved in malignant transfromation
(DGIdb 4.0)
Entrez IDSymbolCategoryInteraction TypesDrug Claim NameDrug NamePMIDs
Page: 1