
|
|||||
|
 | |
| |
| |
| |
| |
| |
|
Gene: RAB27A |
Gene summary for RAB27A |
| Gene information | Species | Human | Gene symbol | RAB27A | Gene ID | 5873 |
| Gene name | RAB27A, member RAS oncogene family | |
| Gene Alias | GS2 | |
| Cytomap | 15q21.3 | |
| Gene Type | protein-coding | GO ID | GO:0001775 | UniProtAcc | A2RU94 |
Top |
Malignant transformation analysis |
| Identification of the aberrant gene expression in precancerous and cancerous lesions by comparing the gene expression of stem-like cells in diseased tissues with normal stem cells |
| Entrez ID | Symbol | Replicates | Species | Organ | Tissue | Adj P-value | Log2FC | Malignancy |
| 5873 | RAB27A | HTA11_3410_2000001011 | Human | Colorectum | AD | 1.40e-03 | -2.99e-01 | 0.0155 |
| 5873 | RAB27A | HTA11_2112_2000001011 | Human | Colorectum | SER | 2.86e-04 | 9.66e-01 | -0.2196 |
| 5873 | RAB27A | HTA11_99999971662_82457 | Human | Colorectum | MSS | 9.37e-10 | -3.31e-01 | 0.3859 |
| 5873 | RAB27A | HTA11_99999974143_84620 | Human | Colorectum | MSS | 8.25e-10 | -3.29e-01 | 0.3005 |
| 5873 | RAB27A | A002-C-010 | Human | Colorectum | FAP | 8.73e-06 | -1.57e-01 | 0.242 |
| 5873 | RAB27A | A015-C-203 | Human | Colorectum | FAP | 3.02e-15 | -3.22e-01 | -0.1294 |
| 5873 | RAB27A | A015-C-204 | Human | Colorectum | FAP | 1.87e-02 | -2.27e-01 | -0.0228 |
| 5873 | RAB27A | A002-C-201 | Human | Colorectum | FAP | 9.56e-08 | -2.53e-01 | 0.0324 |
| 5873 | RAB27A | A002-C-203 | Human | Colorectum | FAP | 8.53e-04 | -2.11e-01 | 0.2786 |
| 5873 | RAB27A | A001-C-119 | Human | Colorectum | FAP | 2.64e-03 | -2.44e-01 | -0.1557 |
| 5873 | RAB27A | A001-C-108 | Human | Colorectum | FAP | 2.27e-12 | -2.92e-01 | -0.0272 |
| 5873 | RAB27A | A002-C-205 | Human | Colorectum | FAP | 3.41e-11 | -3.16e-01 | -0.1236 |
| 5873 | RAB27A | A001-C-104 | Human | Colorectum | FAP | 6.45e-07 | -2.39e-01 | 0.0184 |
| 5873 | RAB27A | A015-C-005 | Human | Colorectum | FAP | 1.01e-02 | -1.88e-01 | -0.0336 |
| 5873 | RAB27A | A015-C-006 | Human | Colorectum | FAP | 5.00e-05 | -2.50e-01 | -0.0994 |
| 5873 | RAB27A | A015-C-106 | Human | Colorectum | FAP | 2.46e-07 | -2.27e-01 | -0.0511 |
| 5873 | RAB27A | A002-C-114 | Human | Colorectum | FAP | 6.25e-10 | -3.31e-01 | -0.1561 |
| 5873 | RAB27A | A015-C-104 | Human | Colorectum | FAP | 9.53e-15 | -3.04e-01 | -0.1899 |
| 5873 | RAB27A | A001-C-014 | Human | Colorectum | FAP | 1.17e-08 | -2.23e-01 | 0.0135 |
| 5873 | RAB27A | A002-C-016 | Human | Colorectum | FAP | 9.47e-10 | -2.39e-01 | 0.0521 |
| Page: 1 2 3 4 5 6 7 |
| Tissue | Expression Dynamics | Abbreviation |
| Colorectum (GSE201348) |  | FAP: Familial adenomatous polyposis |
| CRC: Colorectal cancer | ||
| Colorectum (HTA11) | 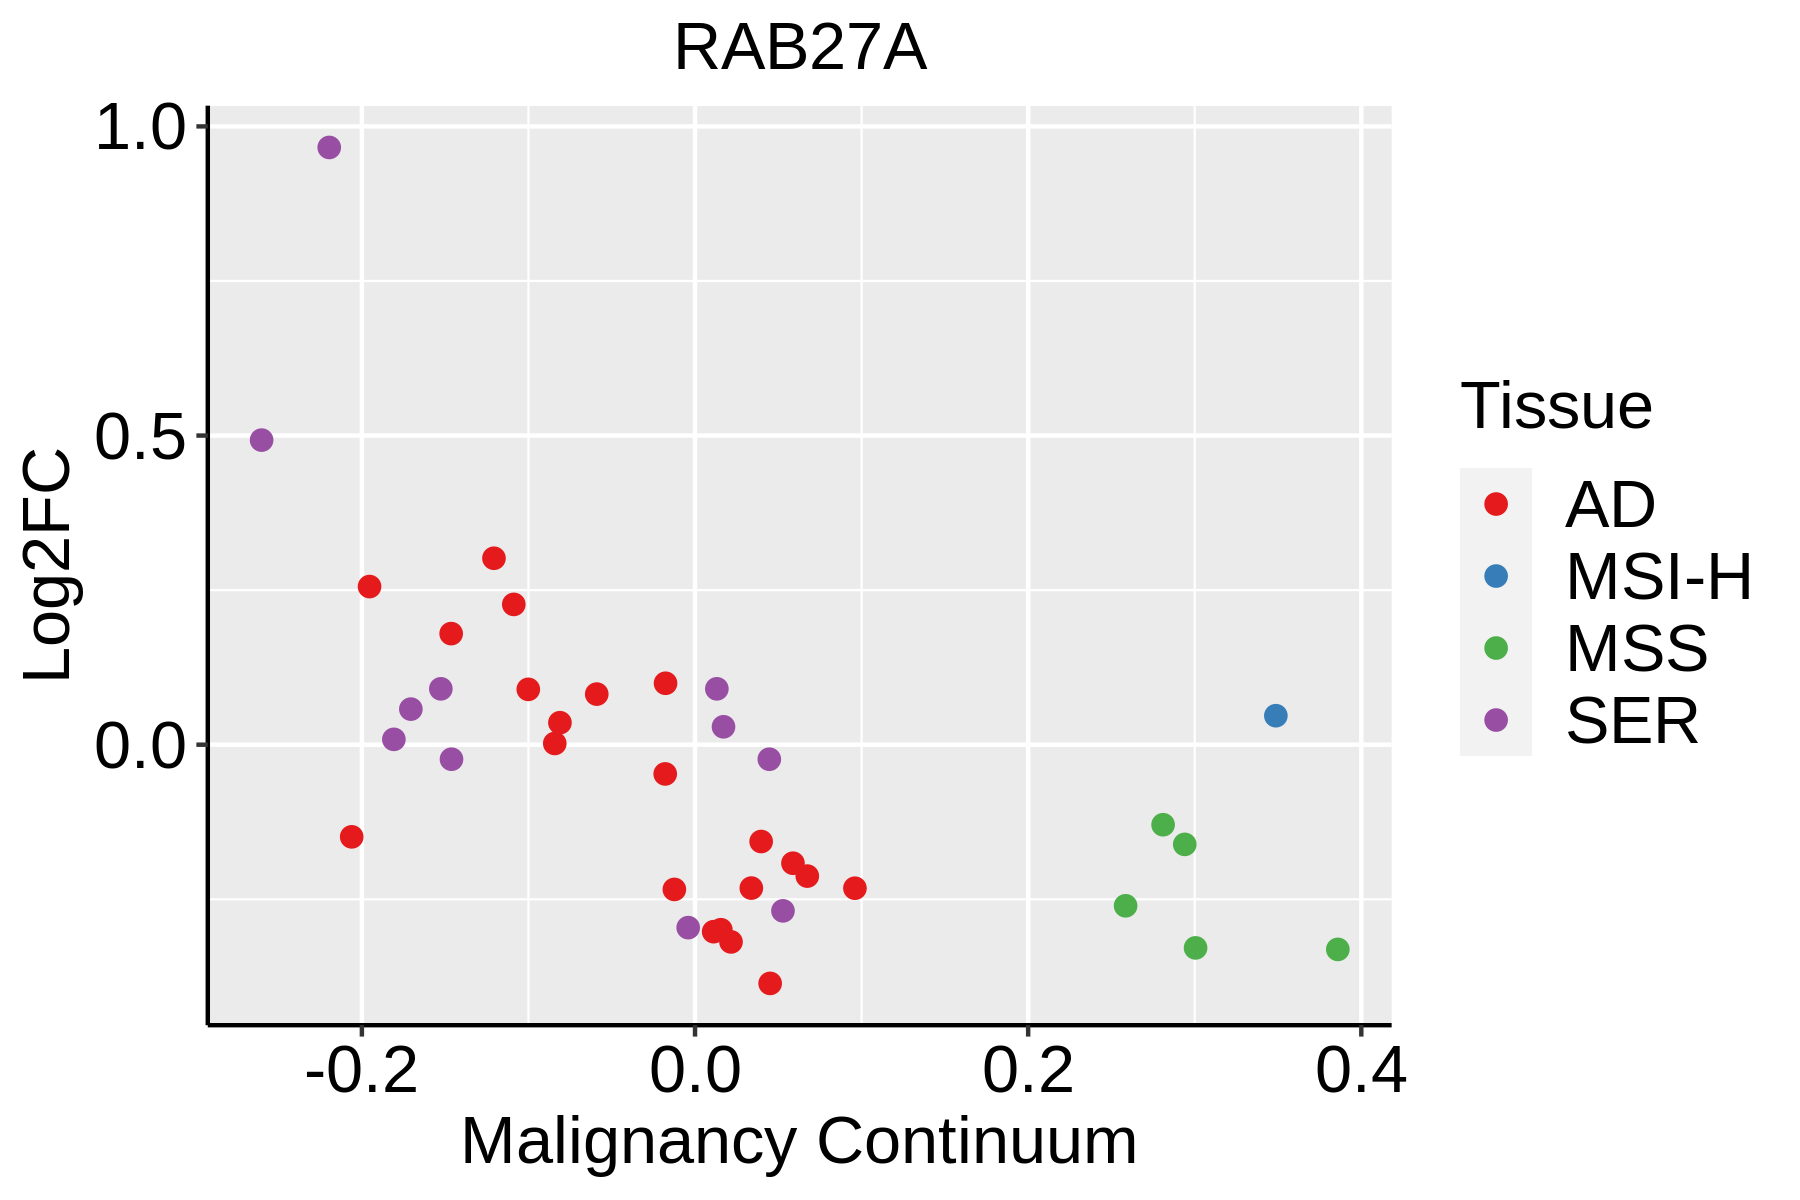 | AD: Adenomas |
| SER: Sessile serrated lesions | ||
| MSI-H: Microsatellite-high colorectal cancer | ||
| MSS: Microsatellite stable colorectal cancer | ||
| Esophagus | 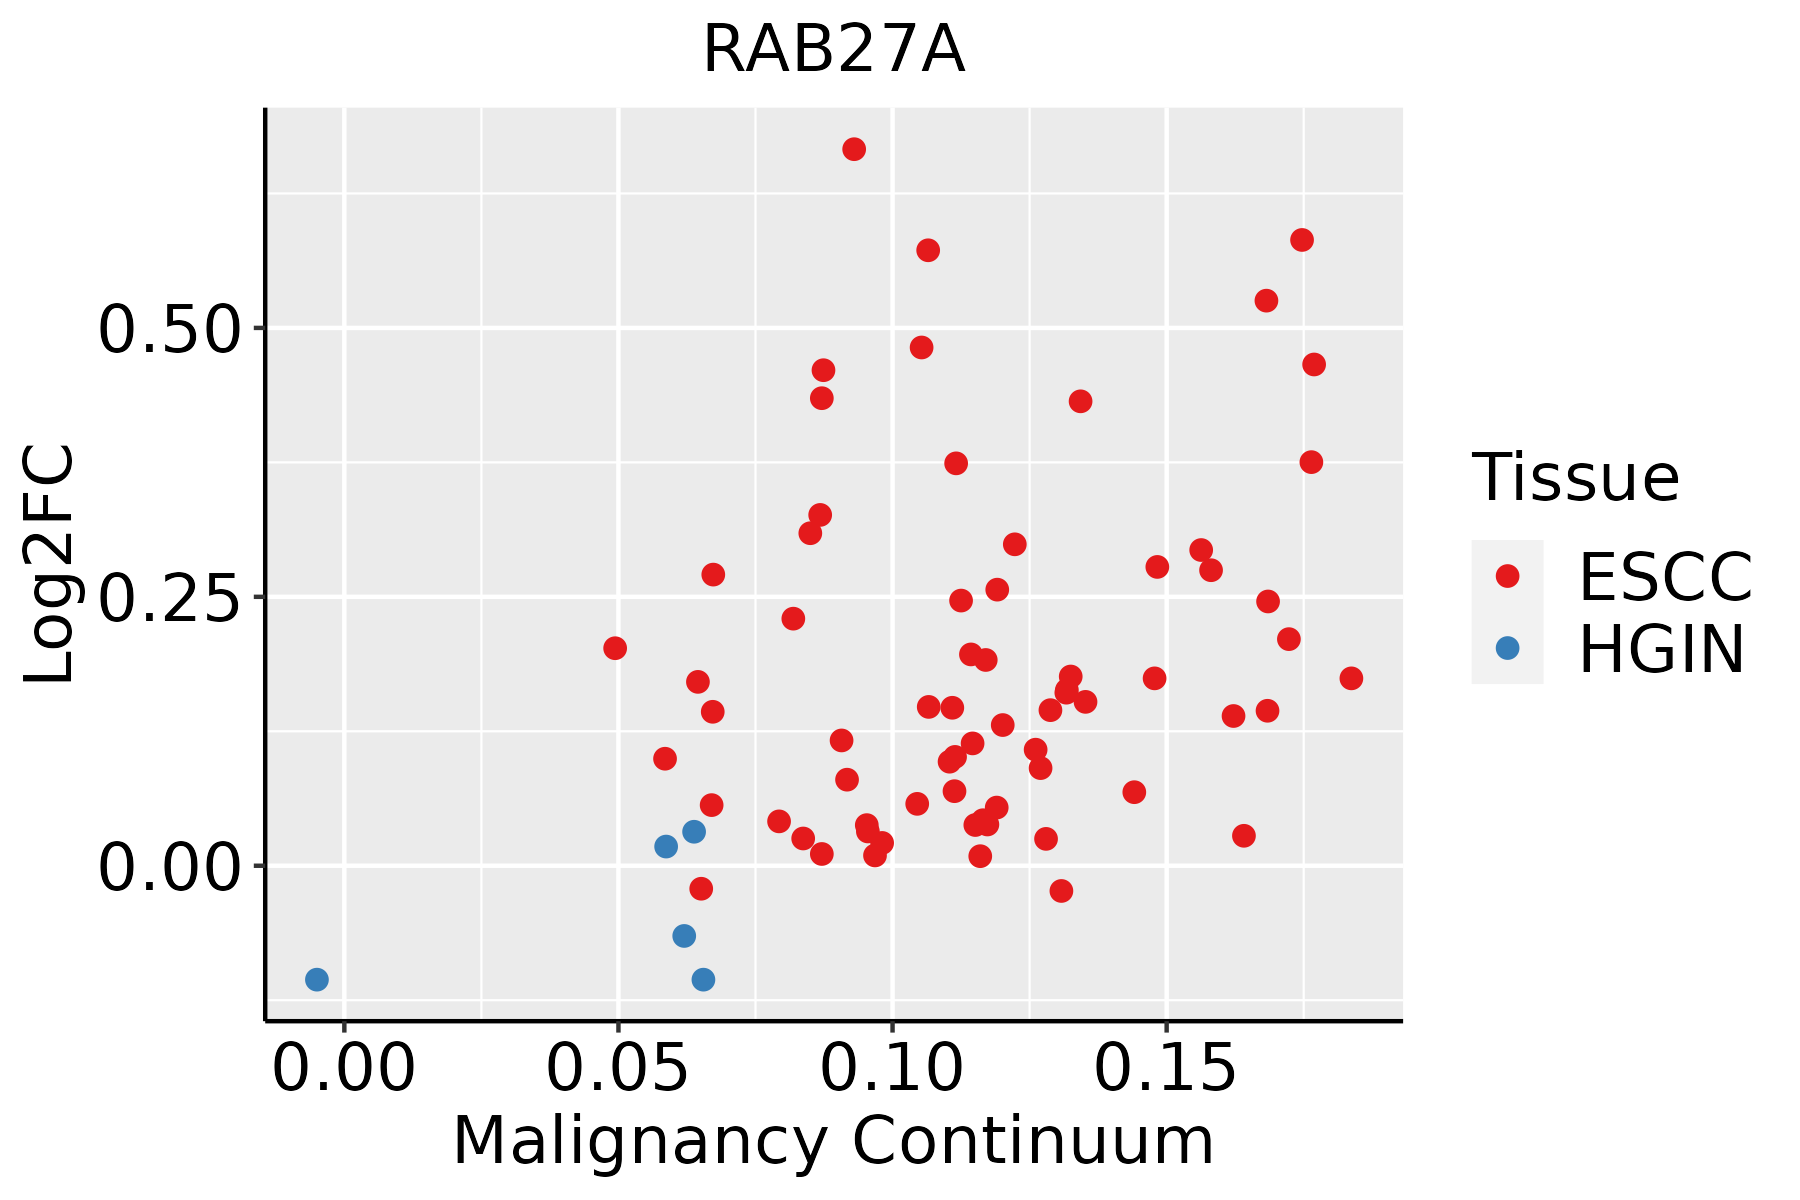 | ESCC: Esophageal squamous cell carcinoma |
| HGIN: High-grade intraepithelial neoplasias | ||
| LGIN: Low-grade intraepithelial neoplasias | ||
| Liver | 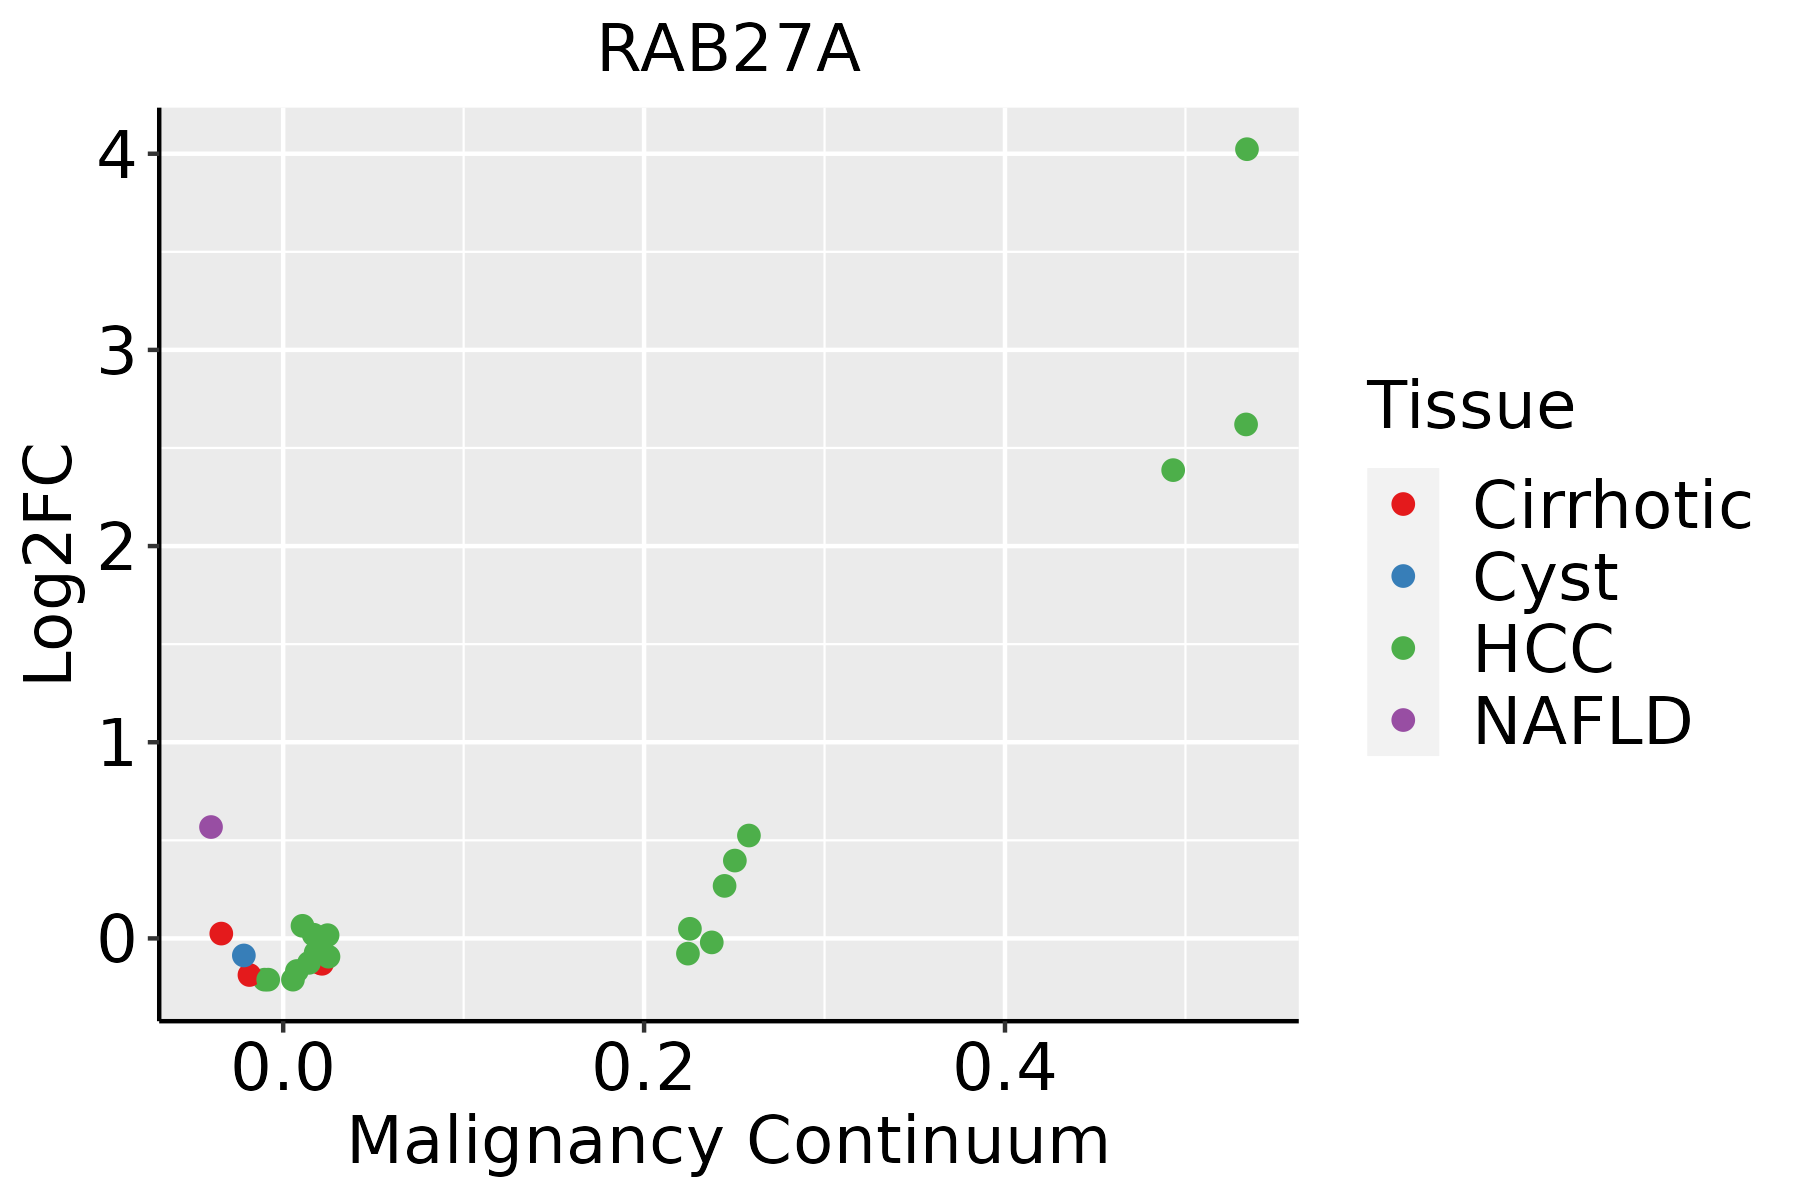 | HCC: Hepatocellular carcinoma |
| NAFLD: Non-alcoholic fatty liver disease | ||
| Lung | 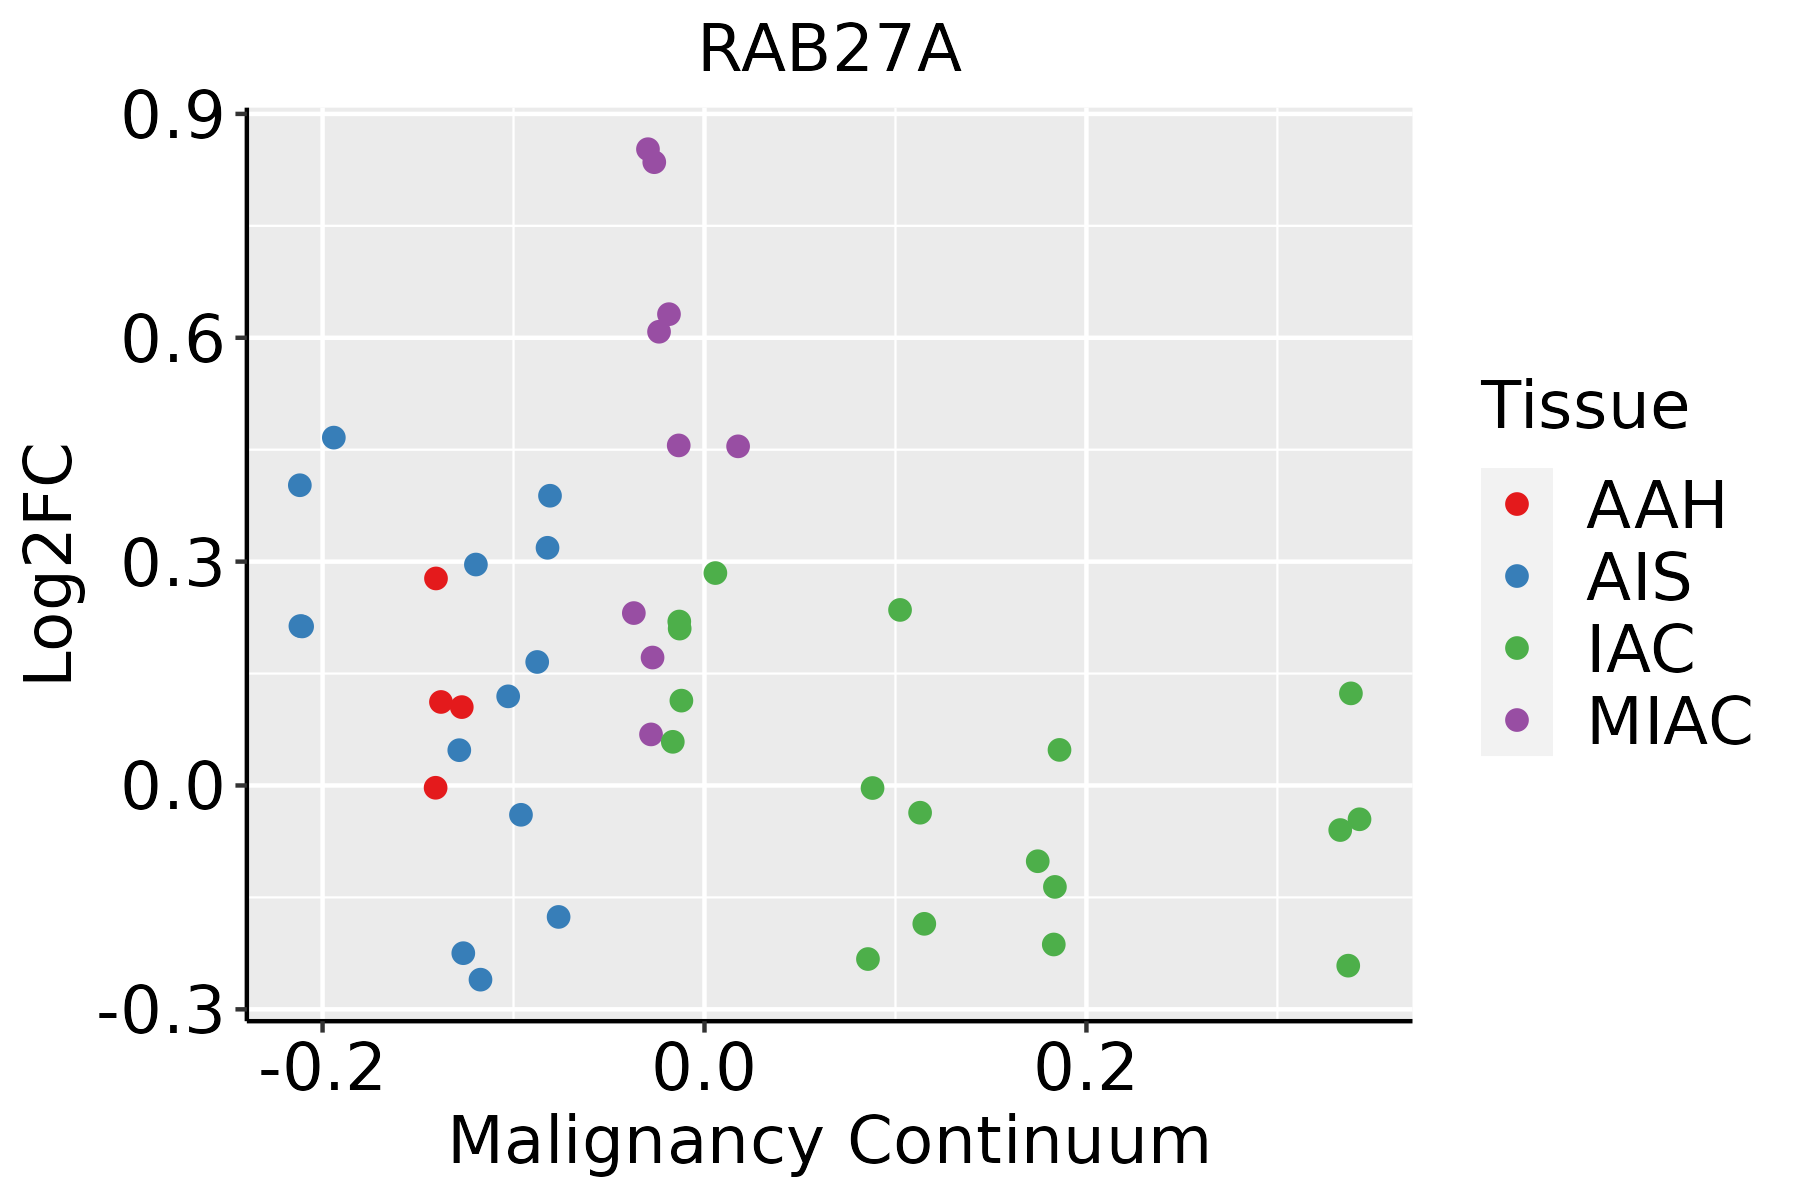 | AAH: Atypical adenomatous hyperplasia |
| AIS: Adenocarcinoma in situ | ||
| IAC: Invasive lung adenocarcinoma | ||
| MIA: Minimally invasive adenocarcinoma | ||
| Oral Cavity | 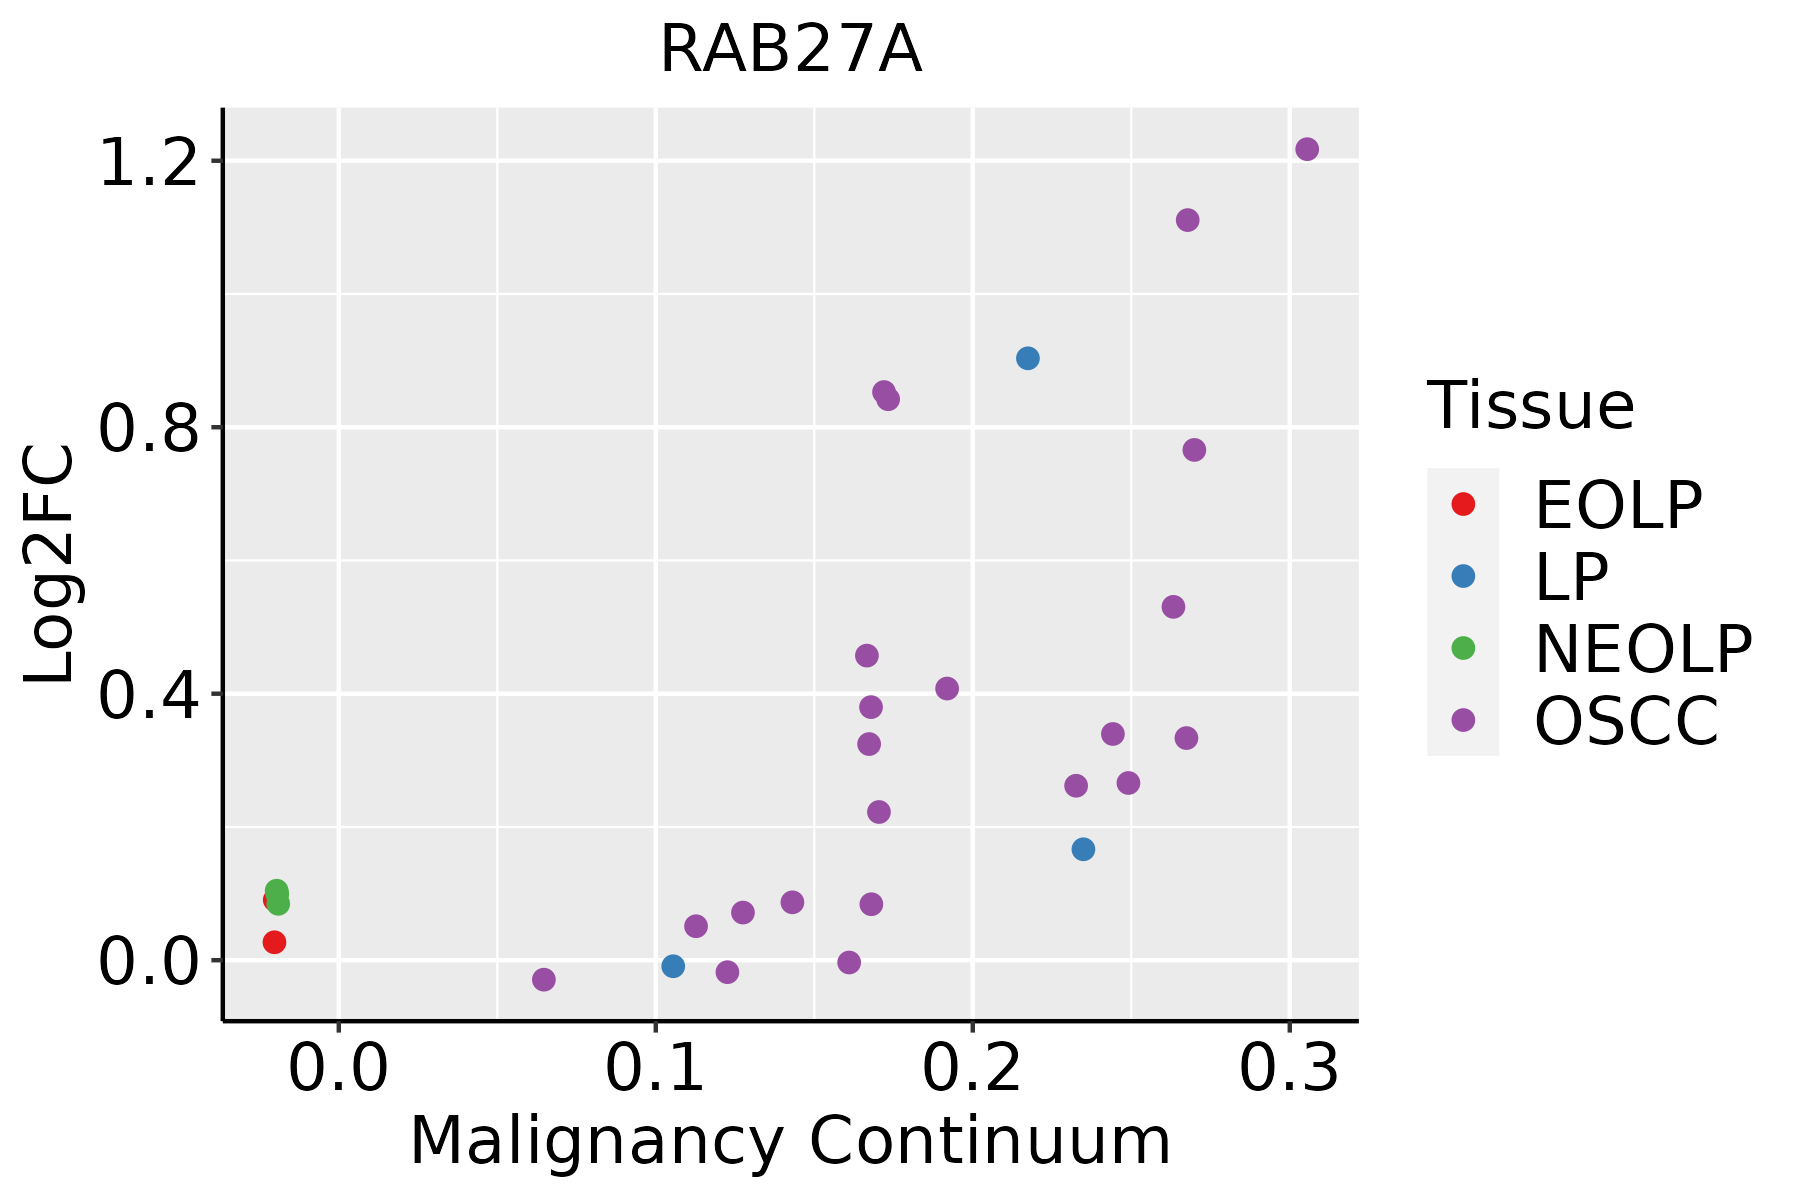 | EOLP: Erosive Oral lichen planus |
| LP: leukoplakia | ||
| NEOLP: Non-erosive oral lichen planus | ||
| OSCC: Oral squamous cell carcinoma | ||
| Prostate |  | BPH: Benign Prostatic Hyperplasia |
| Thyroid | 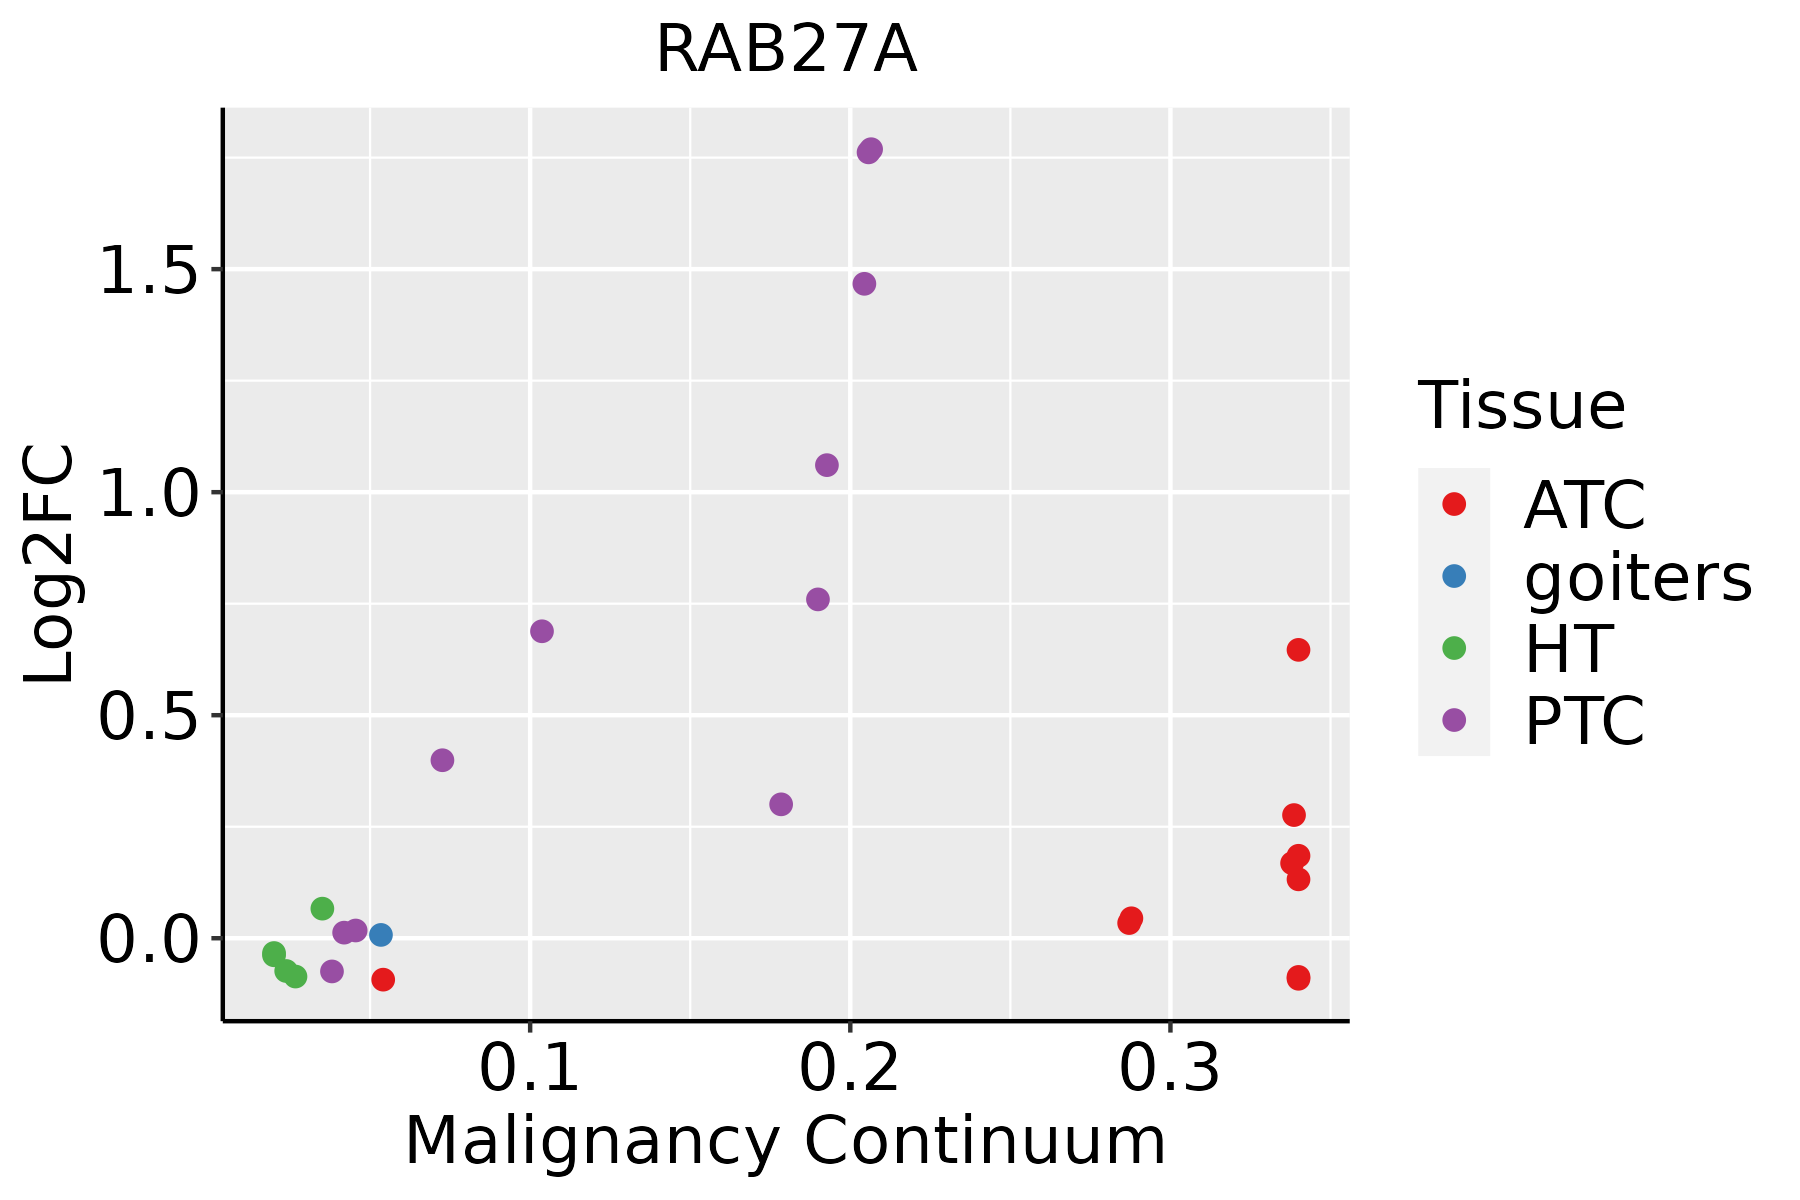 | ATC: Anaplastic thyroid cancer |
| HT: Hashimoto's thyroiditis | ||
| PTC: Papillary thyroid cancer |
| ∗log2FC in expression of this searched gene in stem-like cells from each diseased tissue sample relative to stem-like cells in normal samples in each tissue plotted against the malignancy continuum. Samples are colored based on if they are from different disease stage. |
Top |
Malignant transformation related pathway analysis |
| Find out the enriched GO biological processes and KEGG pathways involved in transition from healthy to precancer to cancer |
| Tissue | Disease Stage | Enriched GO biological Processes |
| Colorectum | AD |  |
| Colorectum | SER |  |
| Colorectum | MSS |  |
| Colorectum | MSI-H |  |
| Colorectum | FAP |  |
| ∗Top 15 enriched GO BP terms are showed in the bar plot of each disease state in each tissue. Each row represents a significant GO biological process which is colored according to the -log10(p.adjust). |
| Page: 1 2 3 4 5 6 7 8 9 |
| GO ID | Tissue | Disease Stage | Description | Gene Ratio | Bg Ratio | pvalue | p.adjust | Count |
| GO:004211010 | Prostate | BPH | T cell activation | 111/3107 | 487/18723 | 2.11e-04 | 1.72e-03 | 111 |
| GO:007259310 | Prostate | BPH | reactive oxygen species metabolic process | 61/3107 | 239/18723 | 2.71e-04 | 2.13e-03 | 61 |
| GO:005087817 | Prostate | BPH | regulation of body fluid levels | 89/3107 | 379/18723 | 3.08e-04 | 2.37e-03 | 89 |
| GO:00070326 | Prostate | BPH | endosome organization | 26/3107 | 82/18723 | 5.42e-04 | 3.81e-03 | 26 |
| GO:200037710 | Prostate | BPH | regulation of reactive oxygen species metabolic process | 42/3107 | 157/18723 | 8.41e-04 | 5.46e-03 | 42 |
| GO:200037910 | Prostate | BPH | positive regulation of reactive oxygen species metabolic process | 24/3107 | 76/18723 | 9.29e-04 | 5.91e-03 | 24 |
| GO:00719854 | Prostate | BPH | multivesicular body sorting pathway | 14/3107 | 37/18723 | 1.58e-03 | 9.23e-03 | 14 |
| GO:00075968 | Prostate | BPH | blood coagulation | 53/3107 | 217/18723 | 1.91e-03 | 1.09e-02 | 53 |
| GO:00508178 | Prostate | BPH | coagulation | 54/3107 | 222/18723 | 1.92e-03 | 1.09e-02 | 54 |
| GO:00362575 | Prostate | BPH | multivesicular body organization | 12/3107 | 31/18723 | 2.69e-03 | 1.43e-02 | 12 |
| GO:00075998 | Prostate | BPH | hemostasis | 53/3107 | 222/18723 | 3.21e-03 | 1.67e-02 | 53 |
| GO:00024565 | Prostate | BPH | T cell mediated immunity | 28/3107 | 109/18723 | 1.02e-02 | 4.27e-02 | 28 |
| GO:00022863 | Prostate | BPH | T cell activation involved in immune response | 29/3107 | 114/18723 | 1.04e-02 | 4.35e-02 | 29 |
| GO:19035324 | Prostate | BPH | positive regulation of secretion by cell | 62/3107 | 282/18723 | 1.07e-02 | 4.45e-02 | 62 |
| GO:00019136 | Prostate | BPH | T cell mediated cytotoxicity | 15/3107 | 49/18723 | 1.09e-02 | 4.50e-02 | 15 |
| GO:000660519 | Prostate | Tumor | protein targeting | 109/3246 | 314/18723 | 6.11e-14 | 7.30e-12 | 109 |
| GO:004206019 | Prostate | Tumor | wound healing | 127/3246 | 422/18723 | 5.32e-11 | 3.41e-09 | 127 |
| GO:005165614 | Prostate | Tumor | establishment of organelle localization | 109/3246 | 390/18723 | 9.97e-08 | 2.67e-06 | 109 |
| GO:001605012 | Prostate | Tumor | vesicle organization | 87/3246 | 300/18723 | 3.44e-07 | 7.71e-06 | 87 |
| GO:005165014 | Prostate | Tumor | establishment of vesicle localization | 49/3246 | 161/18723 | 3.02e-05 | 3.62e-04 | 49 |
| Page: 1 2 3 4 5 6 7 8 9 10 11 12 13 14 15 16 |
| Pathway ID | Tissue | Disease Stage | Description | Gene Ratio | Bg Ratio | pvalue | p.adjust | qvalue | Count |
| Page: 1 |
Top |
Cell-cell communication analysis |
| Identification of potential cell-cell interactions between two cell types and their ligand-receptor pairs for different disease states |
| Ligand | Receptor | LRpair | Pathway | Tissue | Disease Stage |
| Page: 1 |
Top |
Single-cell gene regulatory network inference analysis |
| Find out the significant the regulons (TFs) and the target genes of each regulon across cell types for different disease states |
| TF | Cell Type | Tissue | Disease Stage | Target Gene | RSS | Regulon Activity |
| ∗The dot plots of a searched regulon are shown for all cell subpopulations in each disease state of each tissue based on the regulon specific score inferred using pySCENIC and by calculating the average expression. |
| Page: 1 |
Top |
Somatic mutation of malignant transformation related genes |
| Annotation of somatic variants for genes involved in malignant transformation |
| Hugo Symbol | Variant Class | Variant Classification | dbSNP RS | HGVSc | HGVSp | HGVSp Short | SWISSPROT | BIOTYPE | SIFT | PolyPhen | Tumor Sample Barcode | Tissue | Histology | Sex | Age | Stage | Therapy Types | Drugs | Outcome |
| RAB27A | SNV | Missense_Mutation | c.610N>T | p.His204Tyr | p.H204Y | P51159 | protein_coding | tolerated(0.05) | benign(0.009) | TCGA-E9-A1N8-01 | Breast | breast invasive carcinoma | Female | <65 | I/II | Chemotherapy | doxorubicin | SD | |
| RAB27A | SNV | Missense_Mutation | c.599N>A | p.Arg200Gln | p.R200Q | P51159 | protein_coding | tolerated(0.64) | benign(0) | TCGA-2W-A8YY-01 | Cervix | cervical & endocervical cancer | Female | <65 | I/II | Chemotherapy | cisplatin | CR | |
| RAB27A | SNV | Missense_Mutation | c.188G>A | p.Gly63Asp | p.G63D | P51159 | protein_coding | deleterious(0.01) | benign(0.1) | TCGA-AA-3864-01 | Colorectum | colon adenocarcinoma | Male | >=65 | I/II | Unknown | Unknown | SD | |
| RAB27A | SNV | Missense_Mutation | c.520A>C | p.Ile174Leu | p.I174L | P51159 | protein_coding | deleterious(0.04) | benign(0.04) | TCGA-AA-A010-01 | Colorectum | colon adenocarcinoma | Female | <65 | I/II | Chemotherapy | folinic | CR | |
| RAB27A | SNV | Missense_Mutation | c.112N>C | p.Phe38Leu | p.F38L | P51159 | protein_coding | deleterious(0) | probably_damaging(0.989) | TCGA-NH-A5IV-01 | Colorectum | colon adenocarcinoma | Female | >=65 | I/II | Unknown | Unknown | SD | |
| RAB27A | deletion | Frame_Shift_Del | c.297delN | p.Phe99LeufsTer3 | p.F99Lfs*3 | P51159 | protein_coding | TCGA-AA-3710-01 | Colorectum | colon adenocarcinoma | Female | >=65 | I/II | Unknown | Unknown | SD | |||
| RAB27A | SNV | Missense_Mutation | c.502N>G | p.Thr168Ala | p.T168A | P51159 | protein_coding | tolerated(0.7) | benign(0) | TCGA-AP-A056-01 | Endometrium | uterine corpus endometrioid carcinoma | Female | <65 | I/II | Unknown | Unknown | SD | |
| RAB27A | SNV | Missense_Mutation | c.642N>T | p.Lys214Asn | p.K214N | P51159 | protein_coding | tolerated(0.3) | benign(0.013) | TCGA-AP-A1DK-01 | Endometrium | uterine corpus endometrioid carcinoma | Female | <65 | I/II | Unknown | Unknown | SD | |
| RAB27A | SNV | Missense_Mutation | novel | c.13G>T | p.Asp5Tyr | p.D5Y | P51159 | protein_coding | deleterious(0) | probably_damaging(0.955) | TCGA-AX-A2HC-01 | Endometrium | uterine corpus endometrioid carcinoma | Female | <65 | III/IV | Chemotherapy | paclitaxel | PD |
| RAB27A | SNV | Missense_Mutation | novel | c.271N>T | p.Asp91Tyr | p.D91Y | P51159 | protein_coding | deleterious(0) | probably_damaging(0.999) | TCGA-B5-A3FA-01 | Endometrium | uterine corpus endometrioid carcinoma | Female | >=65 | I/II | Unknown | Unknown | SD |
| Page: 1 2 3 |
Top |
Related drugs of malignant transformation related genes |
| Identification of chemicals and drugs interact with genes involved in malignant transfromation |
| (DGIdb 4.0) |
| Entrez ID | Symbol | Category | Interaction Types | Drug Claim Name | Drug Name | PMIDs |
| 5873 | RAB27A | ENZYME | inhibitor | 328083519 | ||
| 5873 | RAB27A | ENZYME | emapalumab | EMAPALUMAB | ||
| 5873 | RAB27A | ENZYME | Emapalumab-lzsg | EMAPALUMAB |
| Page: 1 |

Copyright 2023-Present -The University of Texas Health Science Center at Houston |