
|
|||||
|
 | |
| |
| |
| |
| |
| |
|
Gene: PRELID1 |
Gene summary for PRELID1 |
| Gene information | Species | Human | Gene symbol | PRELID1 | Gene ID | 27166 |
| Gene name | PRELI domain containing 1 | |
| Gene Alias | CGI-106 | |
| Cytomap | 5q35.3 | |
| Gene Type | protein-coding | GO ID | GO:0001775 | UniProtAcc | Q9Y255 |
Top |
Malignant transformation analysis |
| Identification of the aberrant gene expression in precancerous and cancerous lesions by comparing the gene expression of stem-like cells in diseased tissues with normal stem cells |
| Entrez ID | Symbol | Replicates | Species | Organ | Tissue | Adj P-value | Log2FC | Malignancy |
| 27166 | PRELID1 | GSM4909281 | Human | Breast | IDC | 9.70e-05 | -2.05e-01 | 0.21 |
| 27166 | PRELID1 | GSM4909285 | Human | Breast | IDC | 2.17e-04 | 2.54e-02 | 0.21 |
| 27166 | PRELID1 | GSM4909286 | Human | Breast | IDC | 1.04e-23 | -4.97e-01 | 0.1081 |
| 27166 | PRELID1 | GSM4909293 | Human | Breast | IDC | 3.82e-13 | -2.20e-01 | 0.1581 |
| 27166 | PRELID1 | GSM4909296 | Human | Breast | IDC | 2.31e-13 | -4.17e-01 | 0.1524 |
| 27166 | PRELID1 | GSM4909297 | Human | Breast | IDC | 5.74e-24 | -5.27e-01 | 0.1517 |
| 27166 | PRELID1 | GSM4909298 | Human | Breast | IDC | 5.27e-04 | 7.77e-02 | 0.1551 |
| 27166 | PRELID1 | GSM4909308 | Human | Breast | IDC | 6.15e-06 | 8.85e-02 | 0.158 |
| 27166 | PRELID1 | GSM4909311 | Human | Breast | IDC | 3.09e-42 | -5.16e-01 | 0.1534 |
| 27166 | PRELID1 | GSM4909312 | Human | Breast | IDC | 3.51e-09 | -2.26e-01 | 0.1552 |
| 27166 | PRELID1 | GSM4909317 | Human | Breast | IDC | 3.50e-02 | -9.36e-02 | 0.1355 |
| 27166 | PRELID1 | GSM4909319 | Human | Breast | IDC | 1.55e-52 | -3.95e-01 | 0.1563 |
| 27166 | PRELID1 | GSM4909321 | Human | Breast | IDC | 5.01e-10 | -7.32e-02 | 0.1559 |
| 27166 | PRELID1 | ctrl6 | Human | Breast | Precancer | 5.50e-03 | -3.97e-01 | -0.0061 |
| 27166 | PRELID1 | brca1 | Human | Breast | Precancer | 4.47e-30 | 5.94e-01 | -0.0338 |
| 27166 | PRELID1 | brca3 | Human | Breast | Precancer | 3.08e-02 | 2.33e-01 | -0.0263 |
| 27166 | PRELID1 | M1 | Human | Breast | IDC | 8.37e-03 | -2.33e-01 | 0.1577 |
| 27166 | PRELID1 | NCCBC14 | Human | Breast | DCIS | 8.62e-06 | -2.67e-01 | 0.2021 |
| 27166 | PRELID1 | NCCBC5 | Human | Breast | DCIS | 5.49e-12 | -1.44e-01 | 0.2046 |
| 27166 | PRELID1 | P1 | Human | Breast | IDC | 3.63e-29 | -7.52e-01 | 0.1527 |
| Page: 1 2 3 4 5 6 7 8 9 10 11 12 |
| Tissue | Expression Dynamics | Abbreviation |
| Breast | 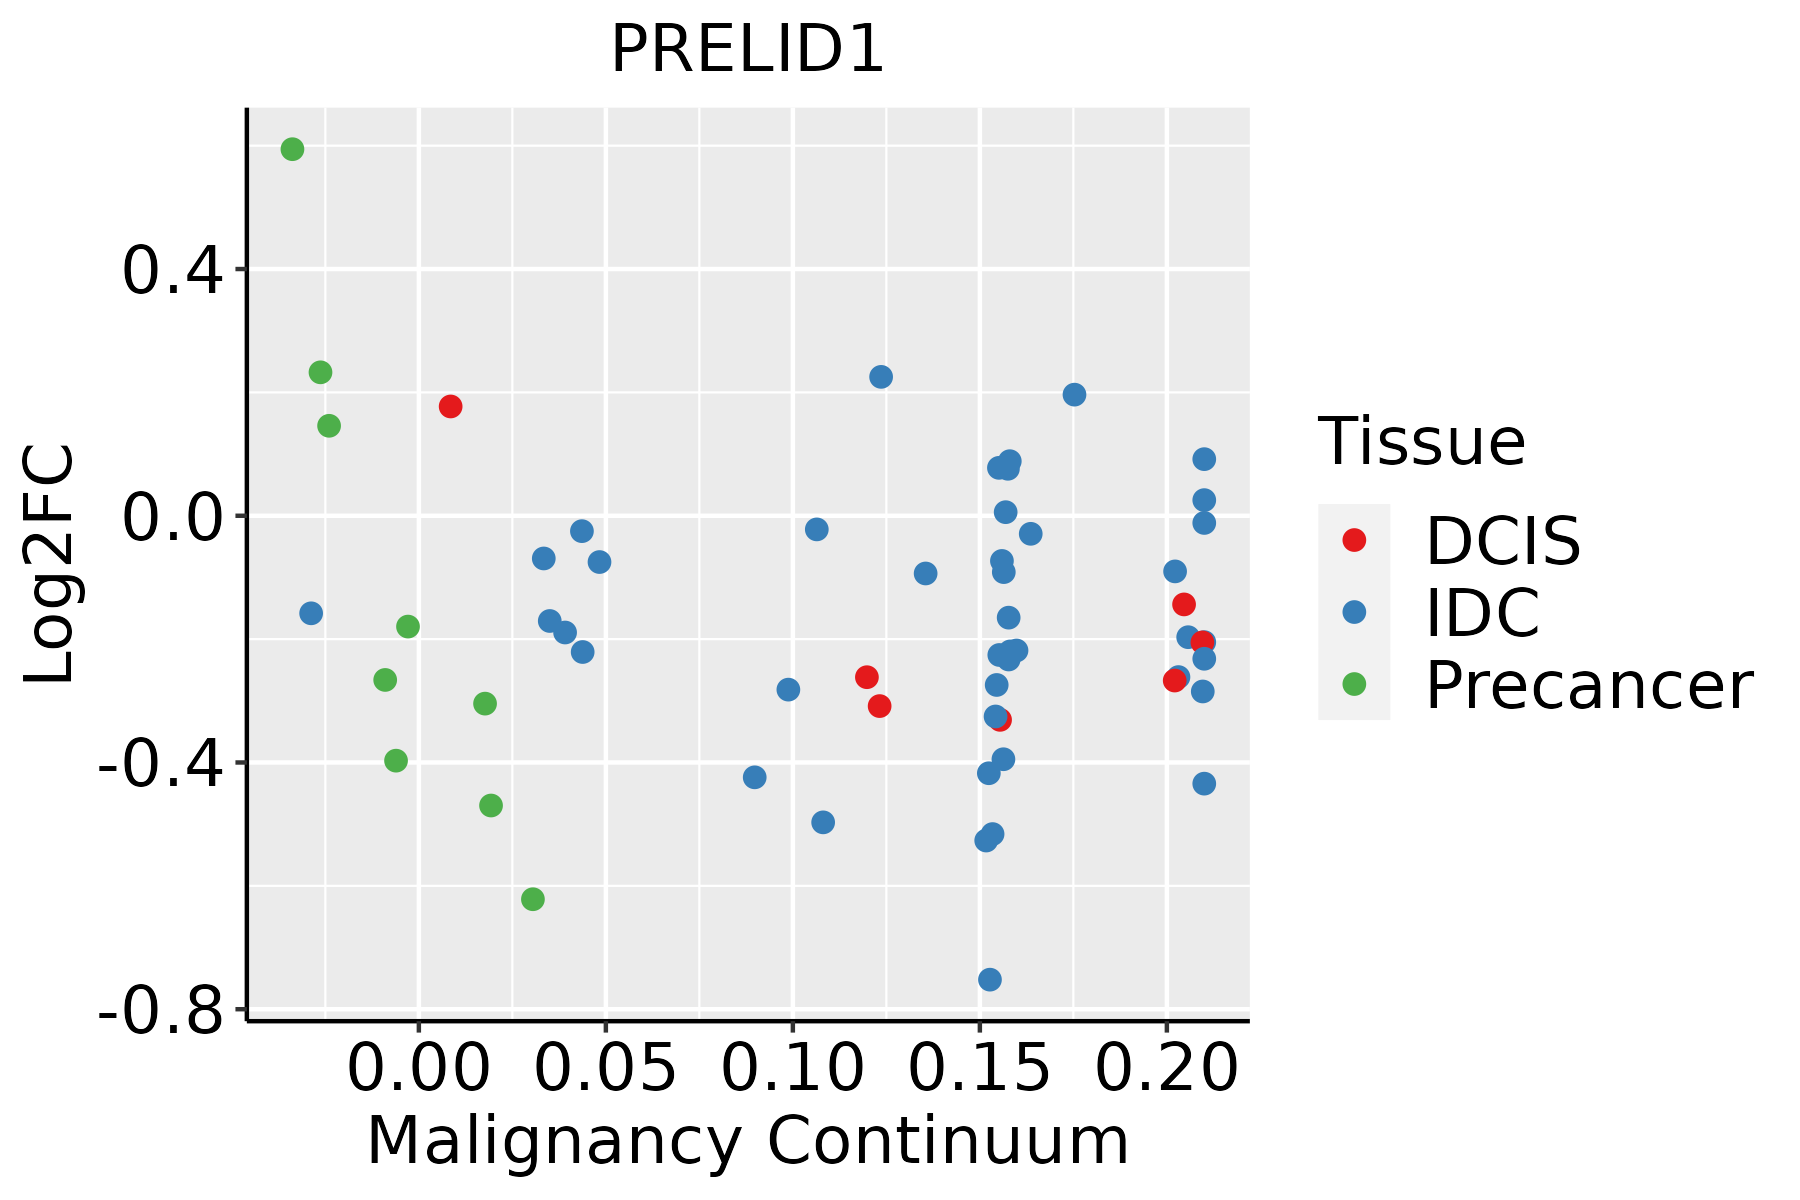 | IDC: Invasive ductal carcinoma |
| DCIS: Ductal carcinoma in situ | ||
| Precancer(BRCA1-mut): Precancerous lesion from BRCA1 mutation carriers | ||
| Cervix | 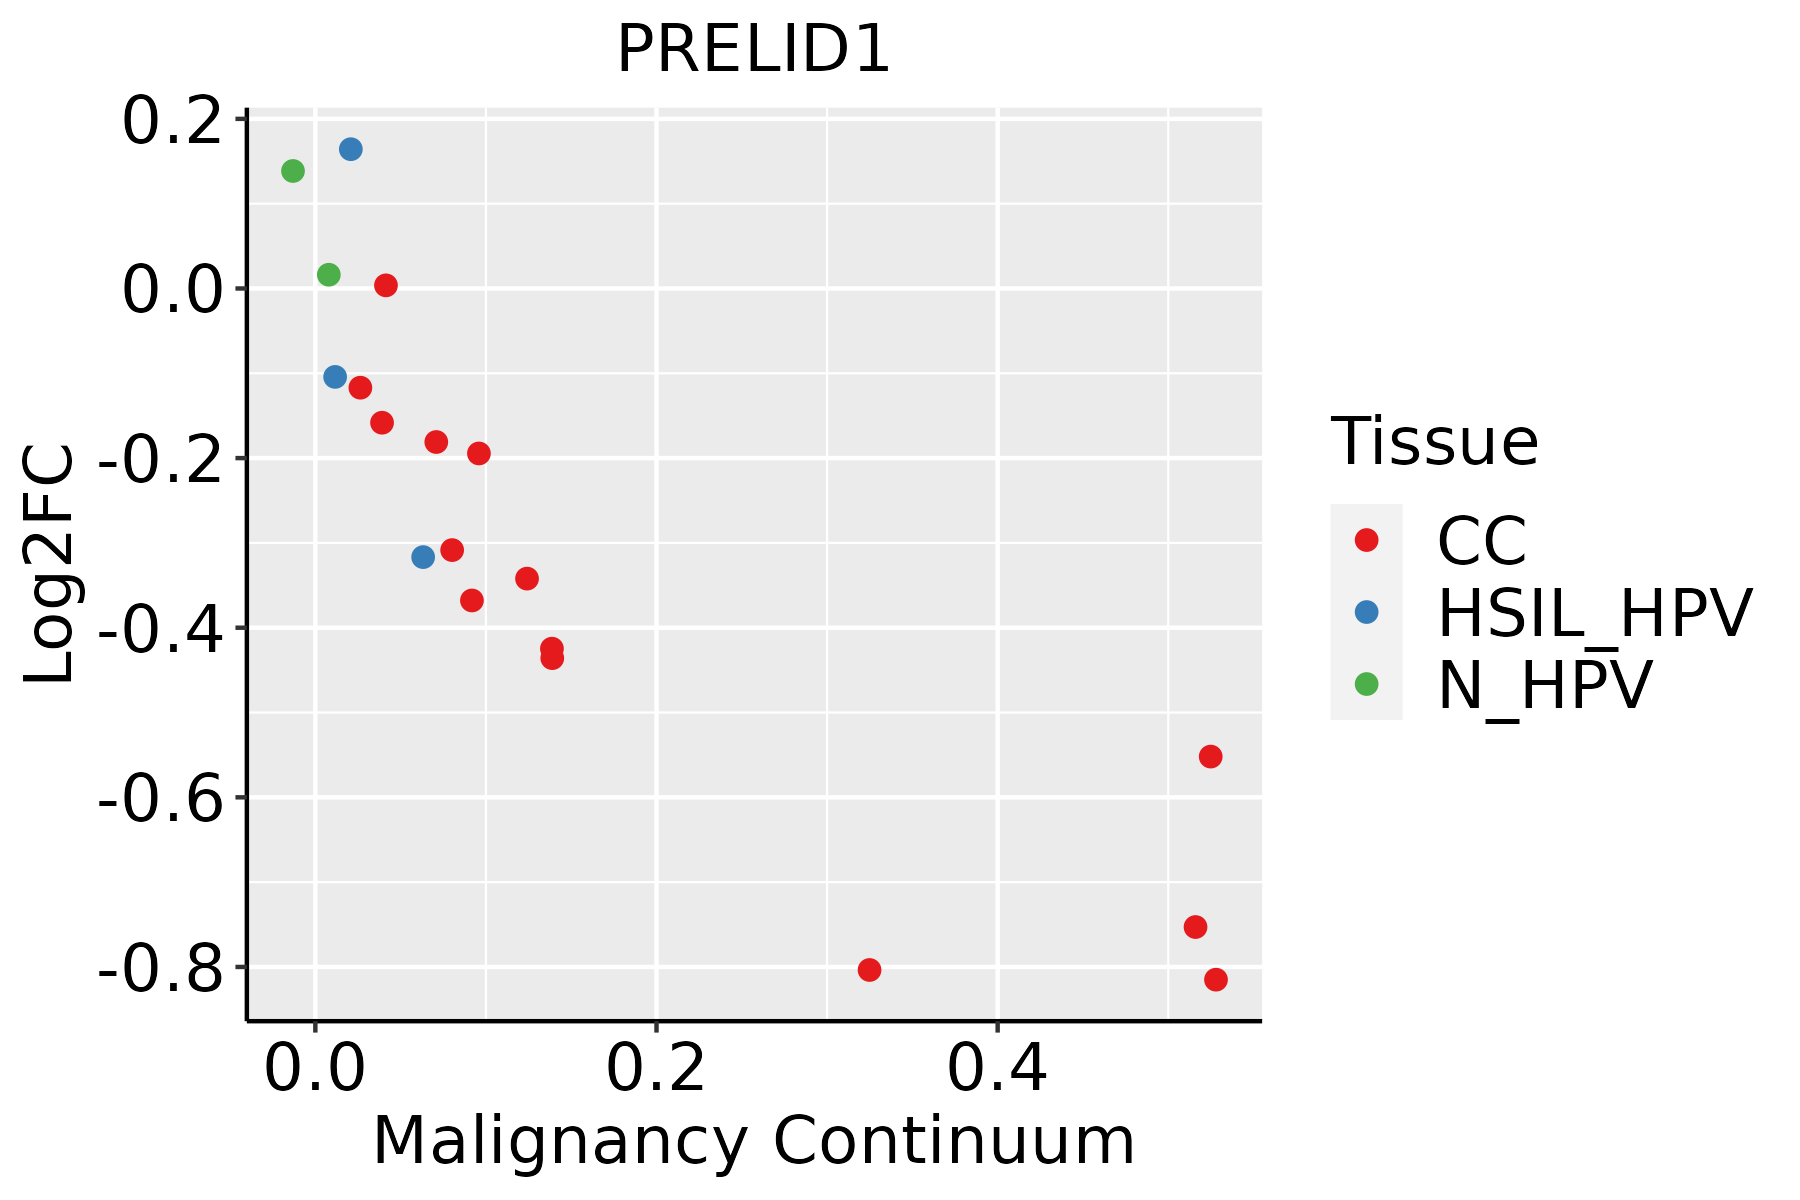 | CC: Cervix cancer |
| HSIL_HPV: HPV-infected high-grade squamous intraepithelial lesions | ||
| N_HPV: HPV-infected normal cervix | ||
| Endometrium |  | AEH: Atypical endometrial hyperplasia |
| EEC: Endometrioid Cancer | ||
| Esophagus |  | ESCC: Esophageal squamous cell carcinoma |
| HGIN: High-grade intraepithelial neoplasias | ||
| LGIN: Low-grade intraepithelial neoplasias | ||
| GC |  | CAG: Chronic atrophic gastritis |
| CAG with IM: Chronic atrophic gastritis with intestinal metaplasia | ||
| CSG: Chronic superficial gastritis | ||
| GC: Gastric cancer | ||
| SIM: Severe intestinal metaplasia | ||
| WIM: Wild intestinal metaplasia | ||
| Liver | 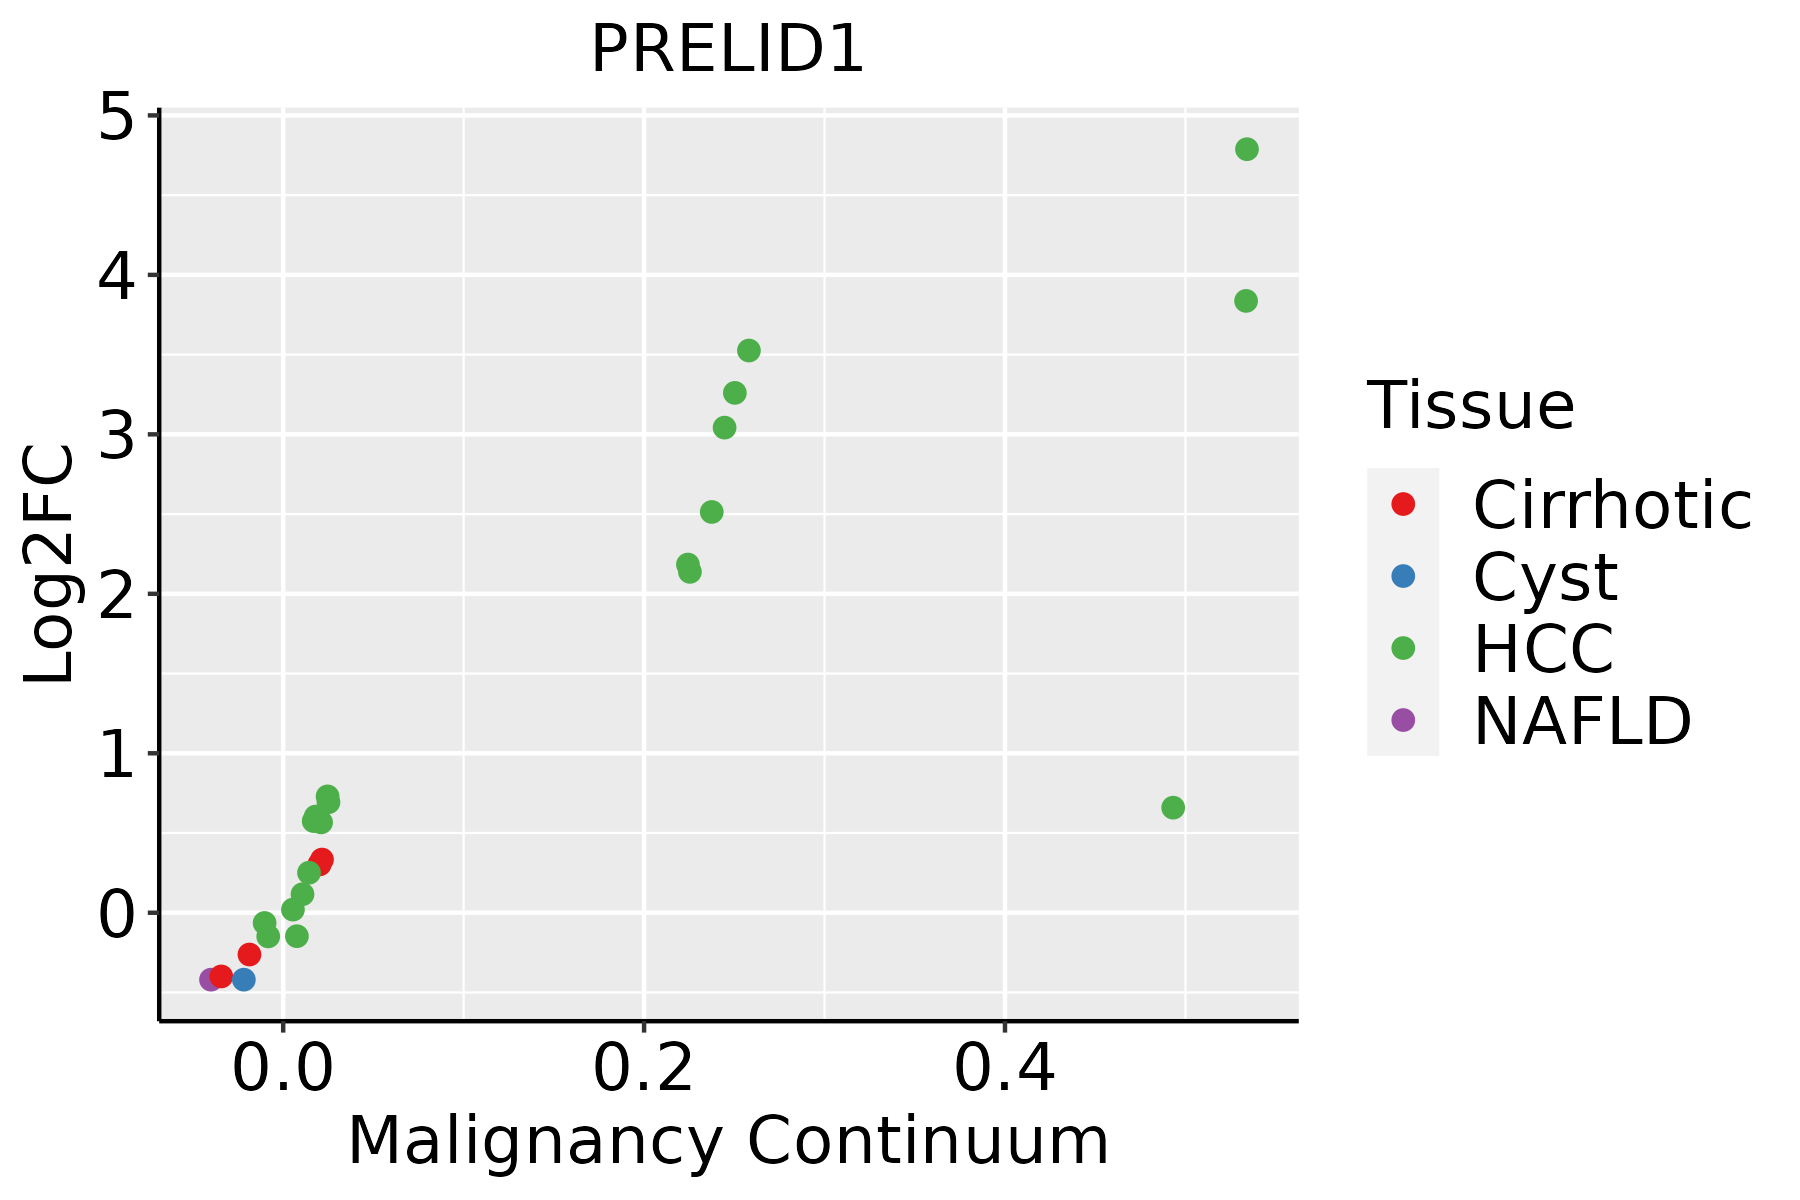 | HCC: Hepatocellular carcinoma |
| NAFLD: Non-alcoholic fatty liver disease | ||
| Oral Cavity |  | EOLP: Erosive Oral lichen planus |
| LP: leukoplakia | ||
| NEOLP: Non-erosive oral lichen planus | ||
| OSCC: Oral squamous cell carcinoma | ||
| Prostate |  | BPH: Benign Prostatic Hyperplasia |
| Skin | 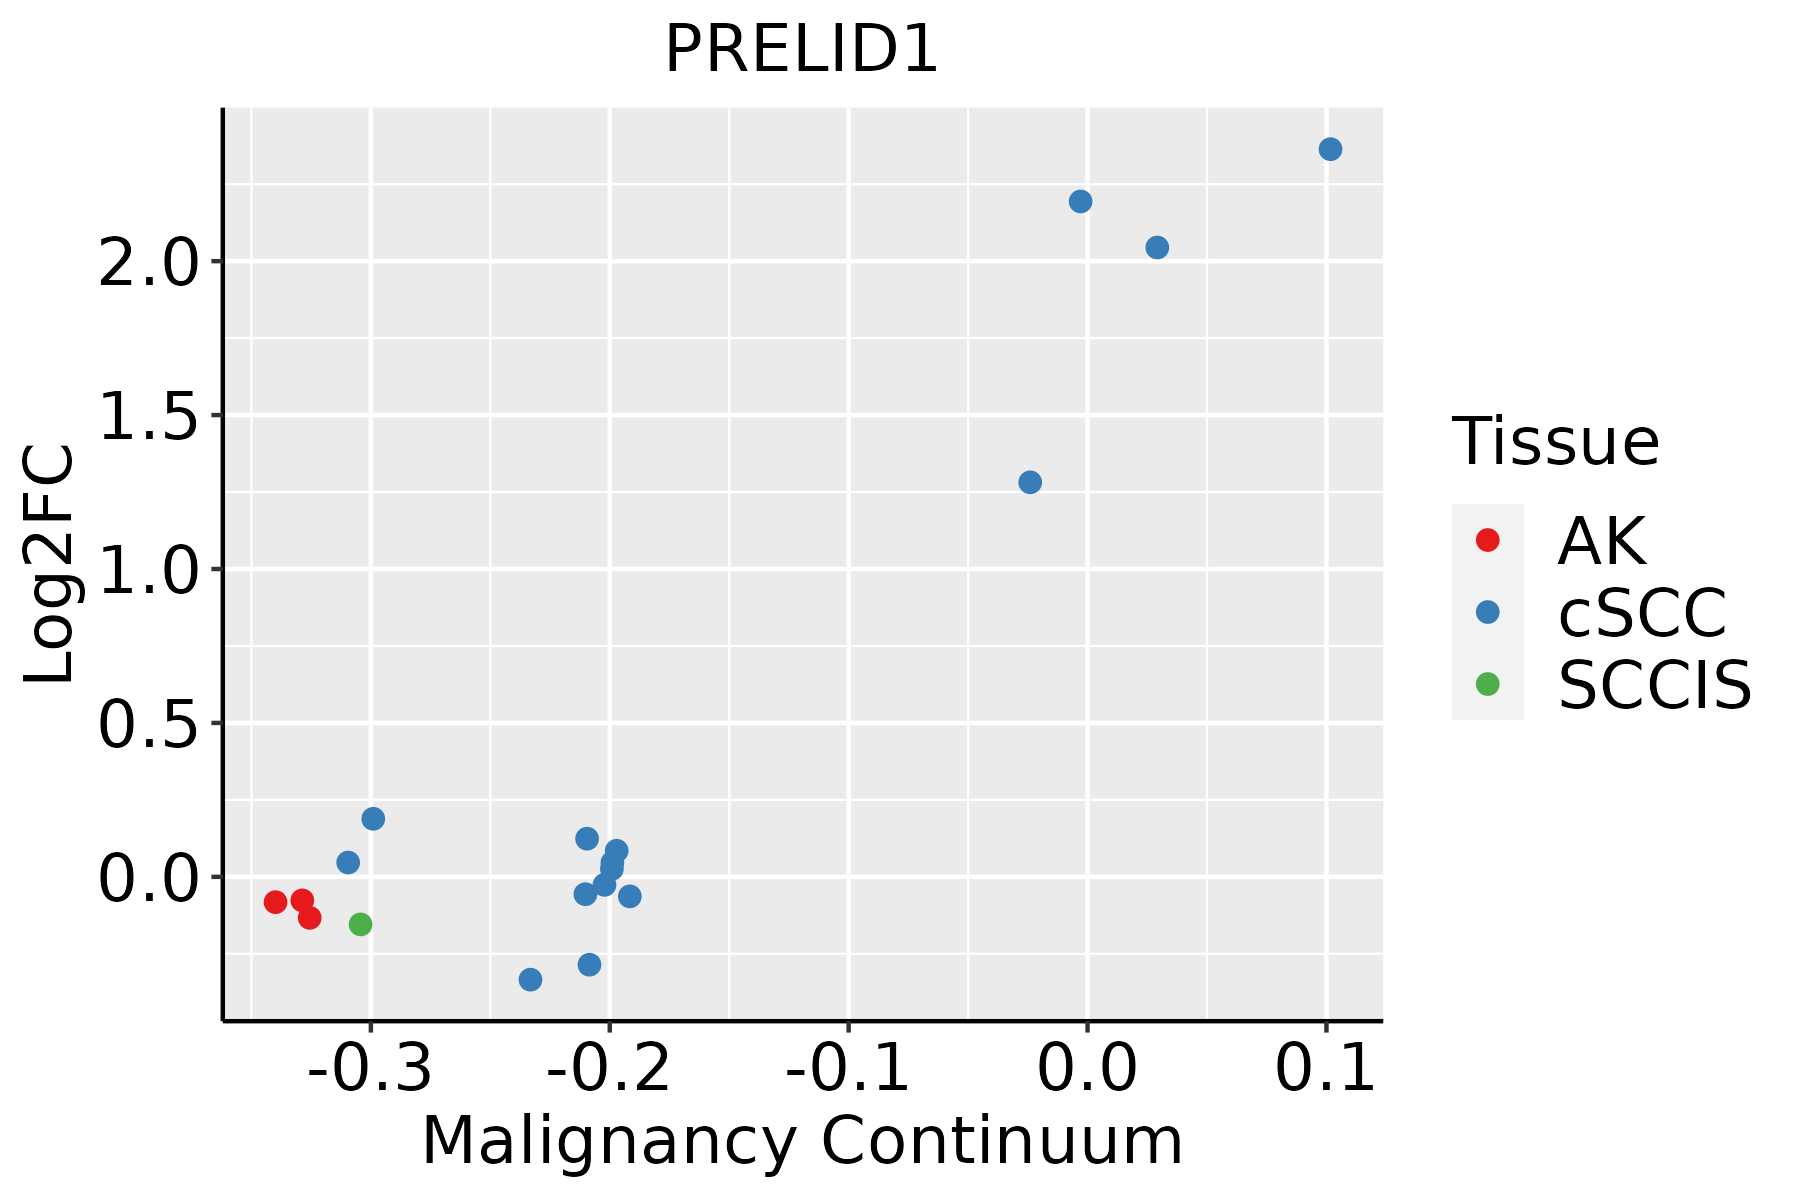 | AK: Actinic keratosis |
| cSCC: Cutaneous squamous cell carcinoma | ||
| SCCIS:squamous cell carcinoma in situ | ||
| Thyroid | 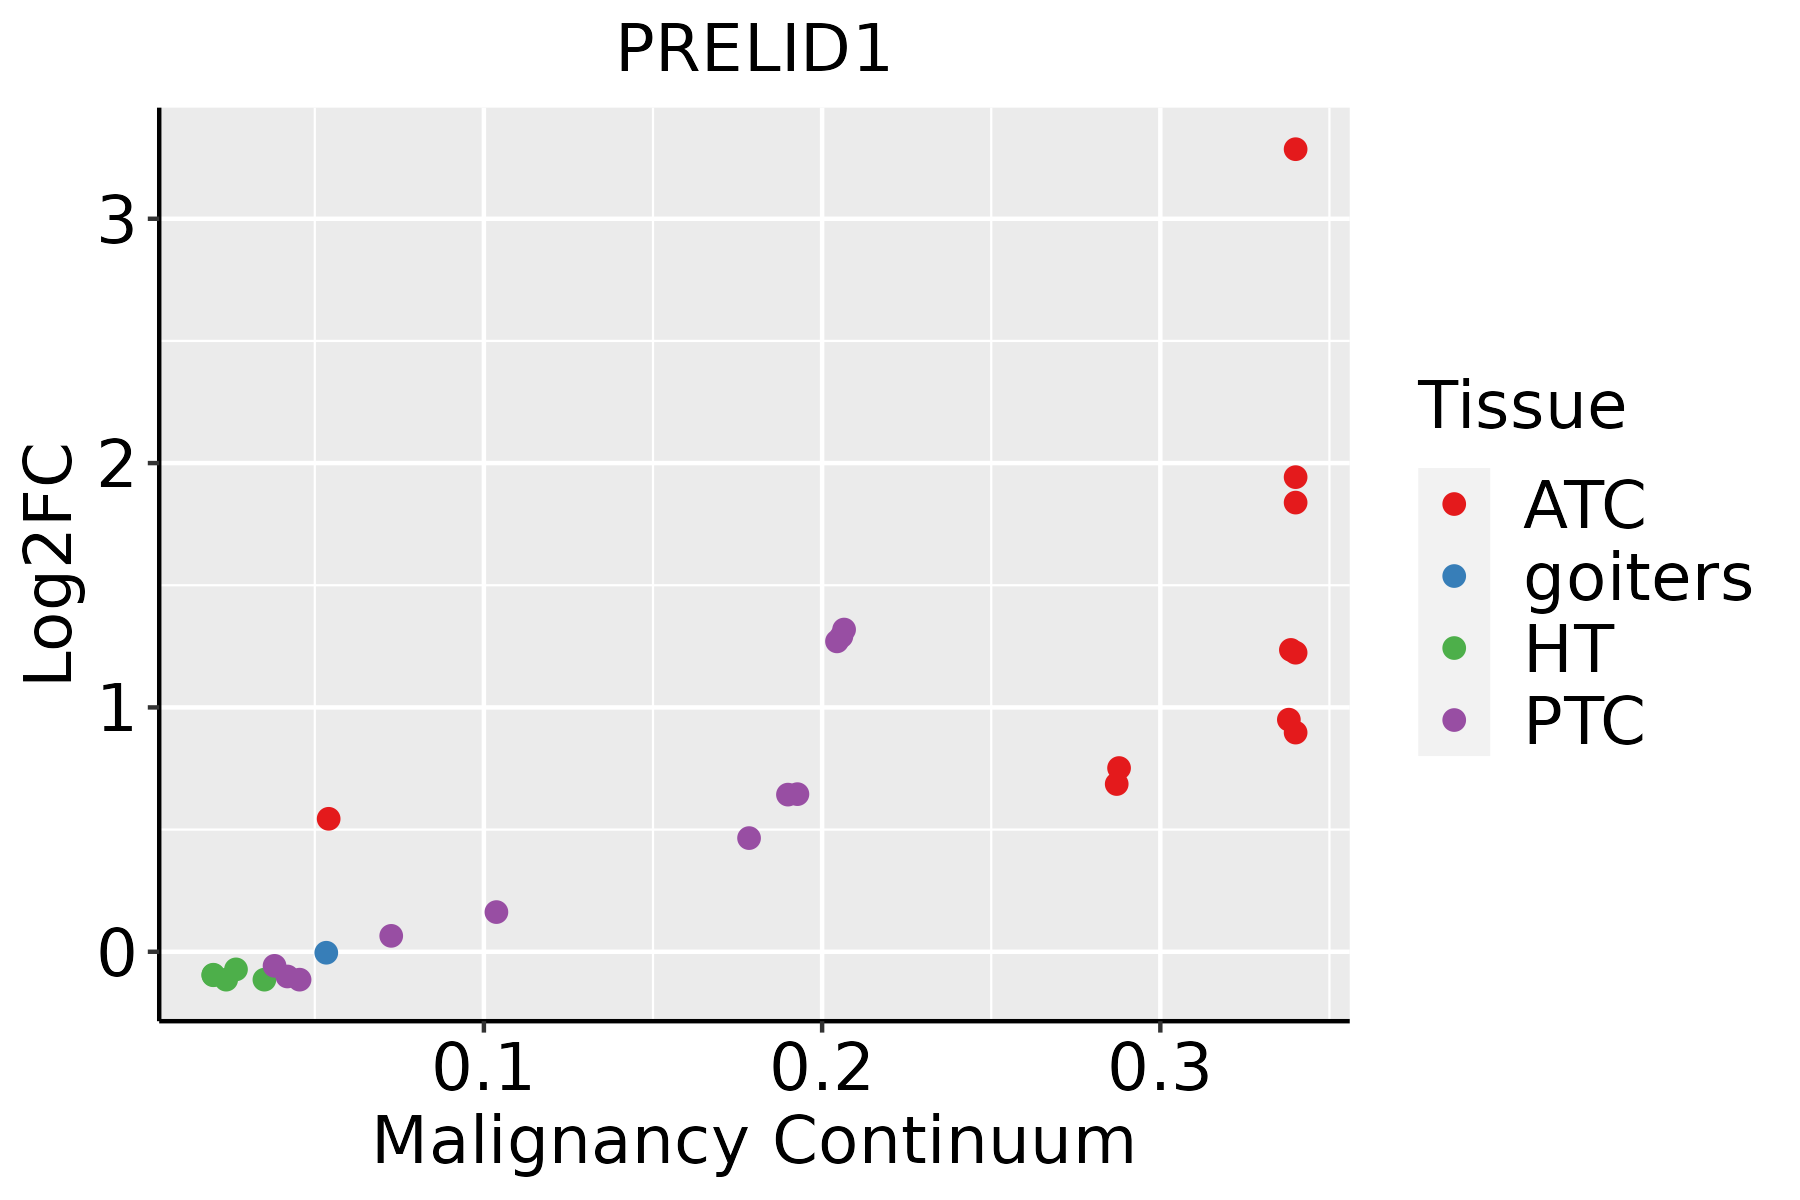 | ATC: Anaplastic thyroid cancer |
| HT: Hashimoto's thyroiditis | ||
| PTC: Papillary thyroid cancer |
| ∗log2FC in expression of this searched gene in stem-like cells from each diseased tissue sample relative to stem-like cells in normal samples in each tissue plotted against the malignancy continuum. Samples are colored based on if they are from different disease stage. |
Top |
Malignant transformation related pathway analysis |
| Find out the enriched GO biological processes and KEGG pathways involved in transition from healthy to precancer to cancer |
| Tissue | Disease Stage | Enriched GO biological Processes |
| Colorectum | AD |  |
| Colorectum | SER |  |
| Colorectum | MSS |  |
| Colorectum | MSI-H |  |
| Colorectum | FAP |  |
| ∗Top 15 enriched GO BP terms are showed in the bar plot of each disease state in each tissue. Each row represents a significant GO biological process which is colored according to the -log10(p.adjust). |
| Page: 1 2 3 4 5 6 7 8 9 |
| GO ID | Tissue | Disease Stage | Description | Gene Ratio | Bg Ratio | pvalue | p.adjust | Count |
| GO:004345712 | Liver | HCC | regulation of cellular respiration | 33/7958 | 49/18723 | 3.86e-04 | 2.62e-03 | 33 |
| GO:005188112 | Liver | HCC | regulation of mitochondrial membrane potential | 45/7958 | 74/18723 | 1.13e-03 | 6.43e-03 | 45 |
| GO:00901995 | Liver | HCC | regulation of release of cytochrome c from mitochondria | 31/7958 | 48/18723 | 1.66e-03 | 8.71e-03 | 31 |
| GO:001095012 | Liver | HCC | positive regulation of endopeptidase activity | 96/7958 | 179/18723 | 1.68e-03 | 8.79e-03 | 96 |
| GO:000686921 | Liver | HCC | lipid transport | 198/7958 | 398/18723 | 1.92e-03 | 9.78e-03 | 198 |
| GO:00902015 | Liver | HCC | negative regulation of release of cytochrome c from mitochondria | 15/7958 | 20/18723 | 3.31e-03 | 1.51e-02 | 15 |
| GO:200123320 | Oral cavity | OSCC | regulation of apoptotic signaling pathway | 242/7305 | 356/18723 | 6.66e-29 | 3.24e-26 | 242 |
| GO:004586220 | Oral cavity | OSCC | positive regulation of proteolysis | 236/7305 | 372/18723 | 6.53e-22 | 1.38e-19 | 236 |
| GO:000609118 | Oral cavity | OSCC | generation of precursor metabolites and energy | 286/7305 | 490/18723 | 1.45e-18 | 1.71e-16 | 286 |
| GO:004533318 | Oral cavity | OSCC | cellular respiration | 153/7305 | 230/18723 | 2.07e-17 | 1.87e-15 | 153 |
| GO:200123420 | Oral cavity | OSCC | negative regulation of apoptotic signaling pathway | 148/7305 | 224/18723 | 1.71e-16 | 1.36e-14 | 148 |
| GO:001598018 | Oral cavity | OSCC | energy derivation by oxidation of organic compounds | 190/7305 | 318/18723 | 4.10e-14 | 2.26e-12 | 190 |
| GO:005254720 | Oral cavity | OSCC | regulation of peptidase activity | 255/7305 | 461/18723 | 5.78e-13 | 2.75e-11 | 255 |
| GO:000863718 | Oral cavity | OSCC | apoptotic mitochondrial changes | 78/7305 | 107/18723 | 1.06e-12 | 4.78e-11 | 78 |
| GO:001082117 | Oral cavity | OSCC | regulation of mitochondrion organization | 97/7305 | 144/18723 | 4.78e-12 | 1.83e-10 | 97 |
| GO:001095220 | Oral cavity | OSCC | positive regulation of peptidase activity | 123/7305 | 197/18723 | 2.12e-11 | 7.21e-10 | 123 |
| GO:005254820 | Oral cavity | OSCC | regulation of endopeptidase activity | 235/7305 | 432/18723 | 4.35e-11 | 1.40e-09 | 235 |
| GO:000183616 | Oral cavity | OSCC | release of cytochrome c from mitochondria | 46/7305 | 59/18723 | 1.17e-09 | 2.87e-08 | 46 |
| GO:001063918 | Oral cavity | OSCC | negative regulation of organelle organization | 190/7305 | 348/18723 | 2.12e-09 | 4.97e-08 | 190 |
| GO:001095019 | Oral cavity | OSCC | positive regulation of endopeptidase activity | 107/7305 | 179/18723 | 1.38e-08 | 2.78e-07 | 107 |
| Page: 1 2 3 4 5 6 7 8 9 10 11 12 13 14 15 16 17 18 19 20 21 22 23 24 25 26 27 28 29 30 |
| Pathway ID | Tissue | Disease Stage | Description | Gene Ratio | Bg Ratio | pvalue | p.adjust | qvalue | Count |
| Page: 1 |
Top |
Cell-cell communication analysis |
| Identification of potential cell-cell interactions between two cell types and their ligand-receptor pairs for different disease states |
| Ligand | Receptor | LRpair | Pathway | Tissue | Disease Stage |
| Page: 1 |
Top |
Single-cell gene regulatory network inference analysis |
| Find out the significant the regulons (TFs) and the target genes of each regulon across cell types for different disease states |
| TF | Cell Type | Tissue | Disease Stage | Target Gene | RSS | Regulon Activity |
| ∗The dot plots of a searched regulon are shown for all cell subpopulations in each disease state of each tissue based on the regulon specific score inferred using pySCENIC and by calculating the average expression. |
| Page: 1 |
Top |
Somatic mutation of malignant transformation related genes |
| Annotation of somatic variants for genes involved in malignant transformation |
| Hugo Symbol | Variant Class | Variant Classification | dbSNP RS | HGVSc | HGVSp | HGVSp Short | SWISSPROT | BIOTYPE | SIFT | PolyPhen | Tumor Sample Barcode | Tissue | Histology | Sex | Age | Stage | Therapy Types | Drugs | Outcome |
| PRELID1 | SNV | Missense_Mutation | rs758980479 | c.514N>A | p.Glu172Lys | p.E172K | Q9Y255 | protein_coding | tolerated(0.25) | benign(0.013) | TCGA-AC-A23H-01 | Breast | breast invasive carcinoma | Female | >=65 | I/II | Unknown | Unknown | PD |
| PRELID1 | SNV | Missense_Mutation | c.197C>T | p.Ala66Val | p.A66V | Q9Y255 | protein_coding | deleterious(0.01) | possibly_damaging(0.733) | TCGA-NH-A5IV-01 | Colorectum | colon adenocarcinoma | Female | >=65 | I/II | Unknown | Unknown | SD | |
| PRELID1 | SNV | Missense_Mutation | c.610N>A | p.Ala204Thr | p.A204T | Q9Y255 | protein_coding | deleterious(0.03) | benign(0.001) | TCGA-A5-A0VP-01 | Endometrium | uterine corpus endometrioid carcinoma | Female | >=65 | I/II | Unknown | Unknown | SD | |
| PRELID1 | SNV | Missense_Mutation | c.436N>G | p.Phe146Val | p.F146V | Q9Y255 | protein_coding | deleterious(0) | possibly_damaging(0.781) | TCGA-AX-A0J0-01 | Endometrium | uterine corpus endometrioid carcinoma | Female | <65 | I/II | Unknown | Unknown | SD | |
| PRELID1 | SNV | Missense_Mutation | rs758358635 | c.383G>A | p.Arg128Gln | p.R128Q | Q9Y255 | protein_coding | tolerated(0.08) | probably_damaging(0.989) | TCGA-KR-A7K0-01 | Liver | liver hepatocellular carcinoma | Male | >=65 | I/II | Unknown | Unknown | SD |
| PRELID1 | SNV | Missense_Mutation | novel | c.413G>C | p.Gly138Ala | p.G138A | Q9Y255 | protein_coding | deleterious(0) | probably_damaging(0.992) | TCGA-ZS-A9CE-01 | Liver | liver hepatocellular carcinoma | Female | >=65 | I/II | Unknown | Unknown | PD |
| PRELID1 | SNV | Missense_Mutation | c.125G>T | p.Arg42Leu | p.R42L | Q9Y255 | protein_coding | tolerated(0.07) | benign(0.396) | TCGA-05-4396-01 | Lung | lung adenocarcinoma | Male | >=65 | III/IV | Unknown | Unknown | SD | |
| PRELID1 | SNV | Missense_Mutation | novel | c.481G>T | p.Gly161Cys | p.G161C | Q9Y255 | protein_coding | deleterious(0) | probably_damaging(1) | TCGA-21-1080-01 | Lung | lung squamous cell carcinoma | Male | >=65 | I/II | Unknown | Unknown | SD |
| PRELID1 | SNV | Missense_Mutation | c.594G>C | p.Glu198Asp | p.E198D | Q9Y255 | protein_coding | deleterious(0.03) | probably_damaging(0.935) | TCGA-34-5929-01 | Lung | lung squamous cell carcinoma | Female | >=65 | I/II | Unknown | Unknown | SD | |
| PRELID1 | SNV | Missense_Mutation | novel | c.380G>T | p.Arg127Leu | p.R127L | Q9Y255 | protein_coding | tolerated(0.1) | benign(0.049) | TCGA-CQ-6228-01 | Oral cavity | head & neck squamous cell carcinoma | Female | >=65 | I/II | Unknown | Unknown | PD |
| Page: 1 2 |
Top |
Related drugs of malignant transformation related genes |
| Identification of chemicals and drugs interact with genes involved in malignant transfromation |
| (DGIdb 4.0) |
| Entrez ID | Symbol | Category | Interaction Types | Drug Claim Name | Drug Name | PMIDs |
| Page: 1 |

Copyright 2023-Present -The University of Texas Health Science Center at Houston |