
|
|||||
|
 | |
| |
| |
| |
| |
| |
|
Gene: PPP1CC |
Gene summary for PPP1CC |
| Gene information | Species | Human | Gene symbol | PPP1CC | Gene ID | 5501 |
| Gene name | protein phosphatase 1 catalytic subunit gamma | |
| Gene Alias | PP-1G | |
| Cytomap | 12q24.11 | |
| Gene Type | protein-coding | GO ID | GO:0000165 | UniProtAcc | P36873 |
Top |
Malignant transformation analysis |
| Identification of the aberrant gene expression in precancerous and cancerous lesions by comparing the gene expression of stem-like cells in diseased tissues with normal stem cells |
| Entrez ID | Symbol | Replicates | Species | Organ | Tissue | Adj P-value | Log2FC | Malignancy |
| 5501 | PPP1CC | HTA11_78_2000001011 | Human | Colorectum | AD | 2.00e-04 | 4.19e-01 | -0.1088 |
| 5501 | PPP1CC | HTA11_347_2000001011 | Human | Colorectum | AD | 2.70e-05 | 3.16e-01 | -0.1954 |
| 5501 | PPP1CC | HTA11_99999970781_79442 | Human | Colorectum | MSS | 7.26e-09 | 5.35e-01 | 0.294 |
| 5501 | PPP1CC | HTA11_99999965062_69753 | Human | Colorectum | MSI-H | 3.62e-03 | 1.10e+00 | 0.3487 |
| 5501 | PPP1CC | A015-C-203 | Human | Colorectum | FAP | 2.96e-06 | -2.23e-01 | -0.1294 |
| 5501 | PPP1CC | A001-C-108 | Human | Colorectum | FAP | 2.81e-05 | -2.32e-01 | -0.0272 |
| 5501 | PPP1CC | A002-C-205 | Human | Colorectum | FAP | 2.07e-03 | -2.21e-01 | -0.1236 |
| 5501 | PPP1CC | A015-C-106 | Human | Colorectum | FAP | 2.40e-03 | -1.69e-01 | -0.0511 |
| 5501 | PPP1CC | A015-C-104 | Human | Colorectum | FAP | 2.71e-06 | -2.38e-01 | -0.1899 |
| 5501 | PPP1CC | A001-C-014 | Human | Colorectum | FAP | 5.58e-04 | -2.01e-01 | 0.0135 |
| 5501 | PPP1CC | A002-C-016 | Human | Colorectum | FAP | 9.31e-07 | -1.45e-01 | 0.0521 |
| 5501 | PPP1CC | A001-C-203 | Human | Colorectum | FAP | 1.12e-02 | -1.76e-01 | -0.0481 |
| 5501 | PPP1CC | A002-C-116 | Human | Colorectum | FAP | 1.03e-08 | -1.92e-01 | -0.0452 |
| 5501 | PPP1CC | A018-E-020 | Human | Colorectum | FAP | 1.05e-02 | -2.27e-01 | -0.2034 |
| 5501 | PPP1CC | LZE2D | Human | Esophagus | HGIN | 1.06e-06 | 1.48e-01 | 0.0642 |
| 5501 | PPP1CC | LZE4T | Human | Esophagus | ESCC | 2.75e-12 | 5.12e-01 | 0.0811 |
| 5501 | PPP1CC | LZE5T | Human | Esophagus | ESCC | 1.32e-02 | -1.08e-01 | 0.0514 |
| 5501 | PPP1CC | LZE7T | Human | Esophagus | ESCC | 1.84e-06 | 9.47e-01 | 0.0667 |
| 5501 | PPP1CC | LZE8T | Human | Esophagus | ESCC | 1.82e-02 | 8.32e-02 | 0.067 |
| 5501 | PPP1CC | LZE20T | Human | Esophagus | ESCC | 8.39e-04 | 2.62e-01 | 0.0662 |
| Page: 1 2 3 4 5 6 7 8 |
| Tissue | Expression Dynamics | Abbreviation |
| Colorectum (GSE201348) |  | FAP: Familial adenomatous polyposis |
| CRC: Colorectal cancer | ||
| Colorectum (HTA11) |  | AD: Adenomas |
| SER: Sessile serrated lesions | ||
| MSI-H: Microsatellite-high colorectal cancer | ||
| MSS: Microsatellite stable colorectal cancer | ||
| Esophagus | 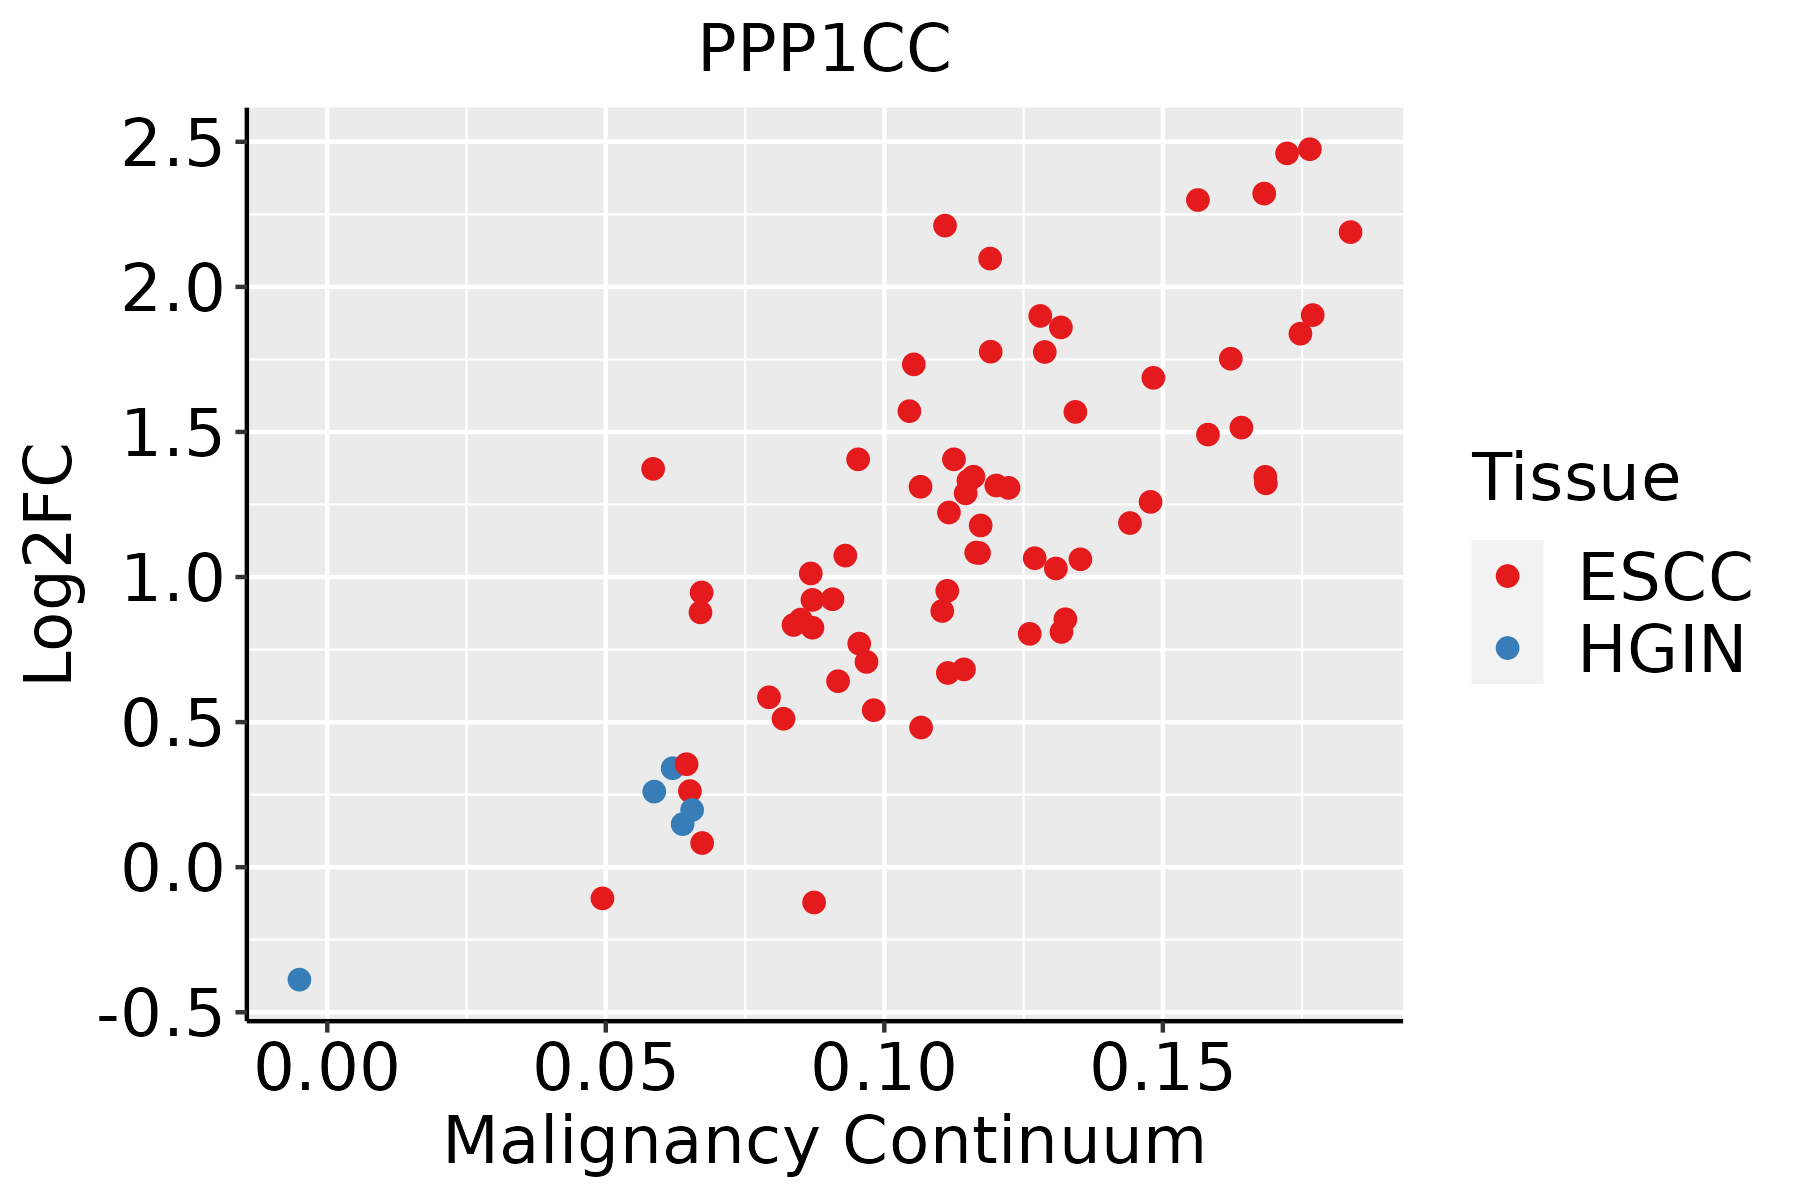 | ESCC: Esophageal squamous cell carcinoma |
| HGIN: High-grade intraepithelial neoplasias | ||
| LGIN: Low-grade intraepithelial neoplasias | ||
| Liver |  | HCC: Hepatocellular carcinoma |
| NAFLD: Non-alcoholic fatty liver disease | ||
| Oral Cavity | 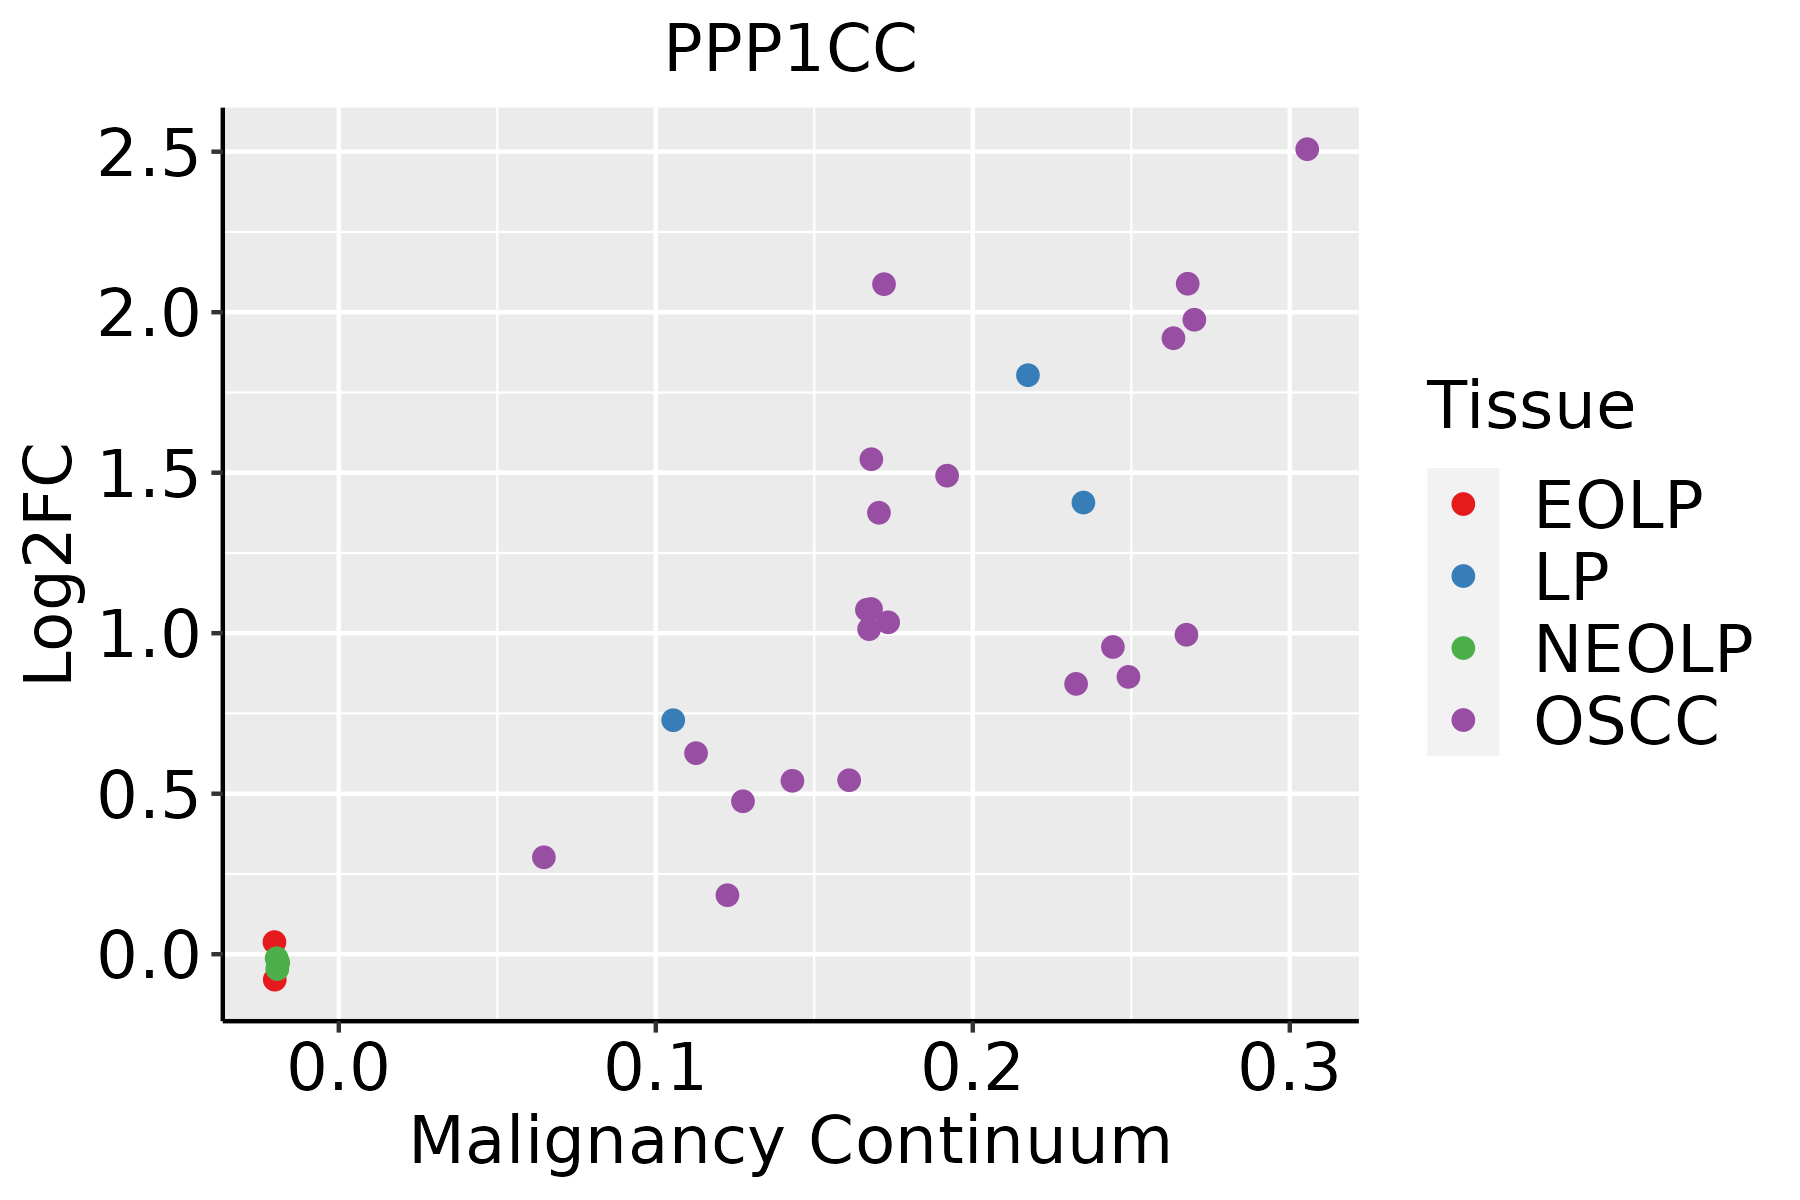 | EOLP: Erosive Oral lichen planus |
| LP: leukoplakia | ||
| NEOLP: Non-erosive oral lichen planus | ||
| OSCC: Oral squamous cell carcinoma | ||
| Prostate | 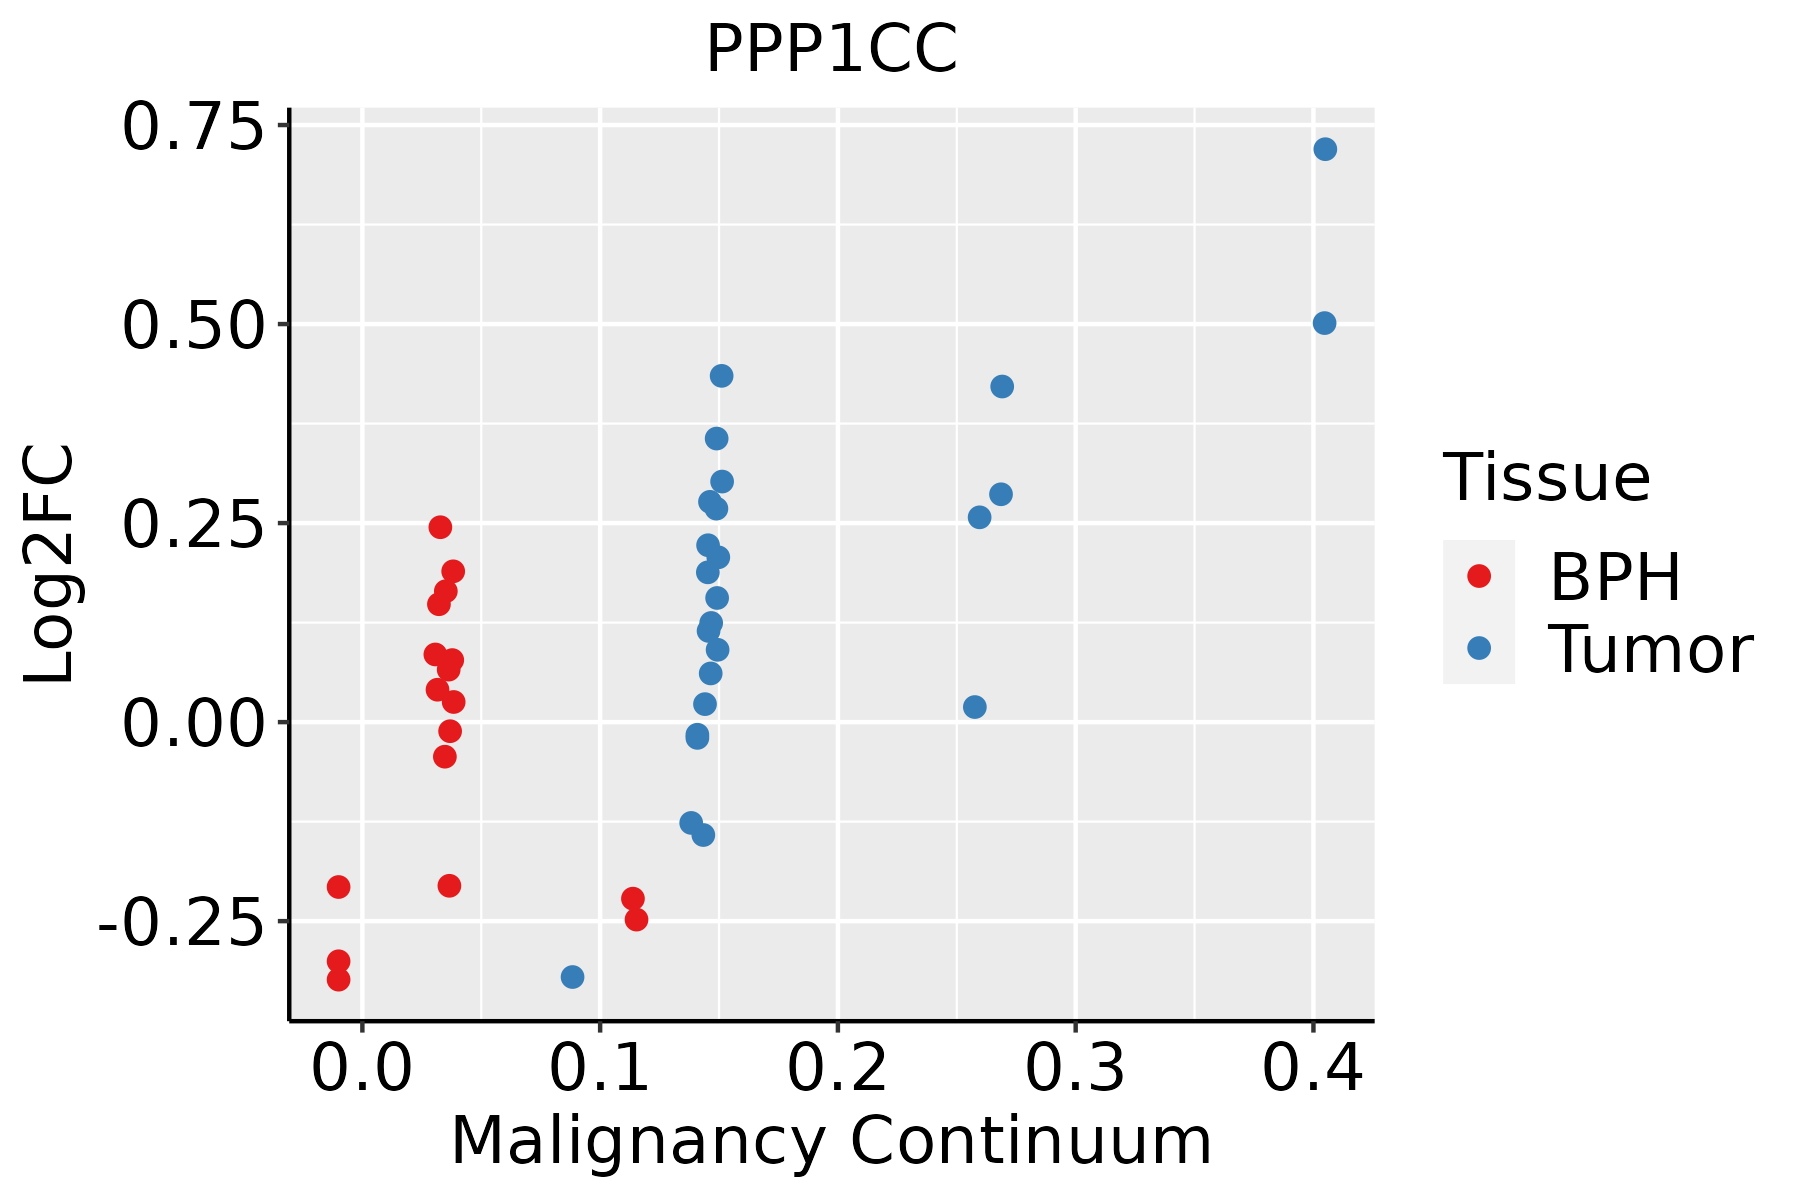 | BPH: Benign Prostatic Hyperplasia |
| Skin | 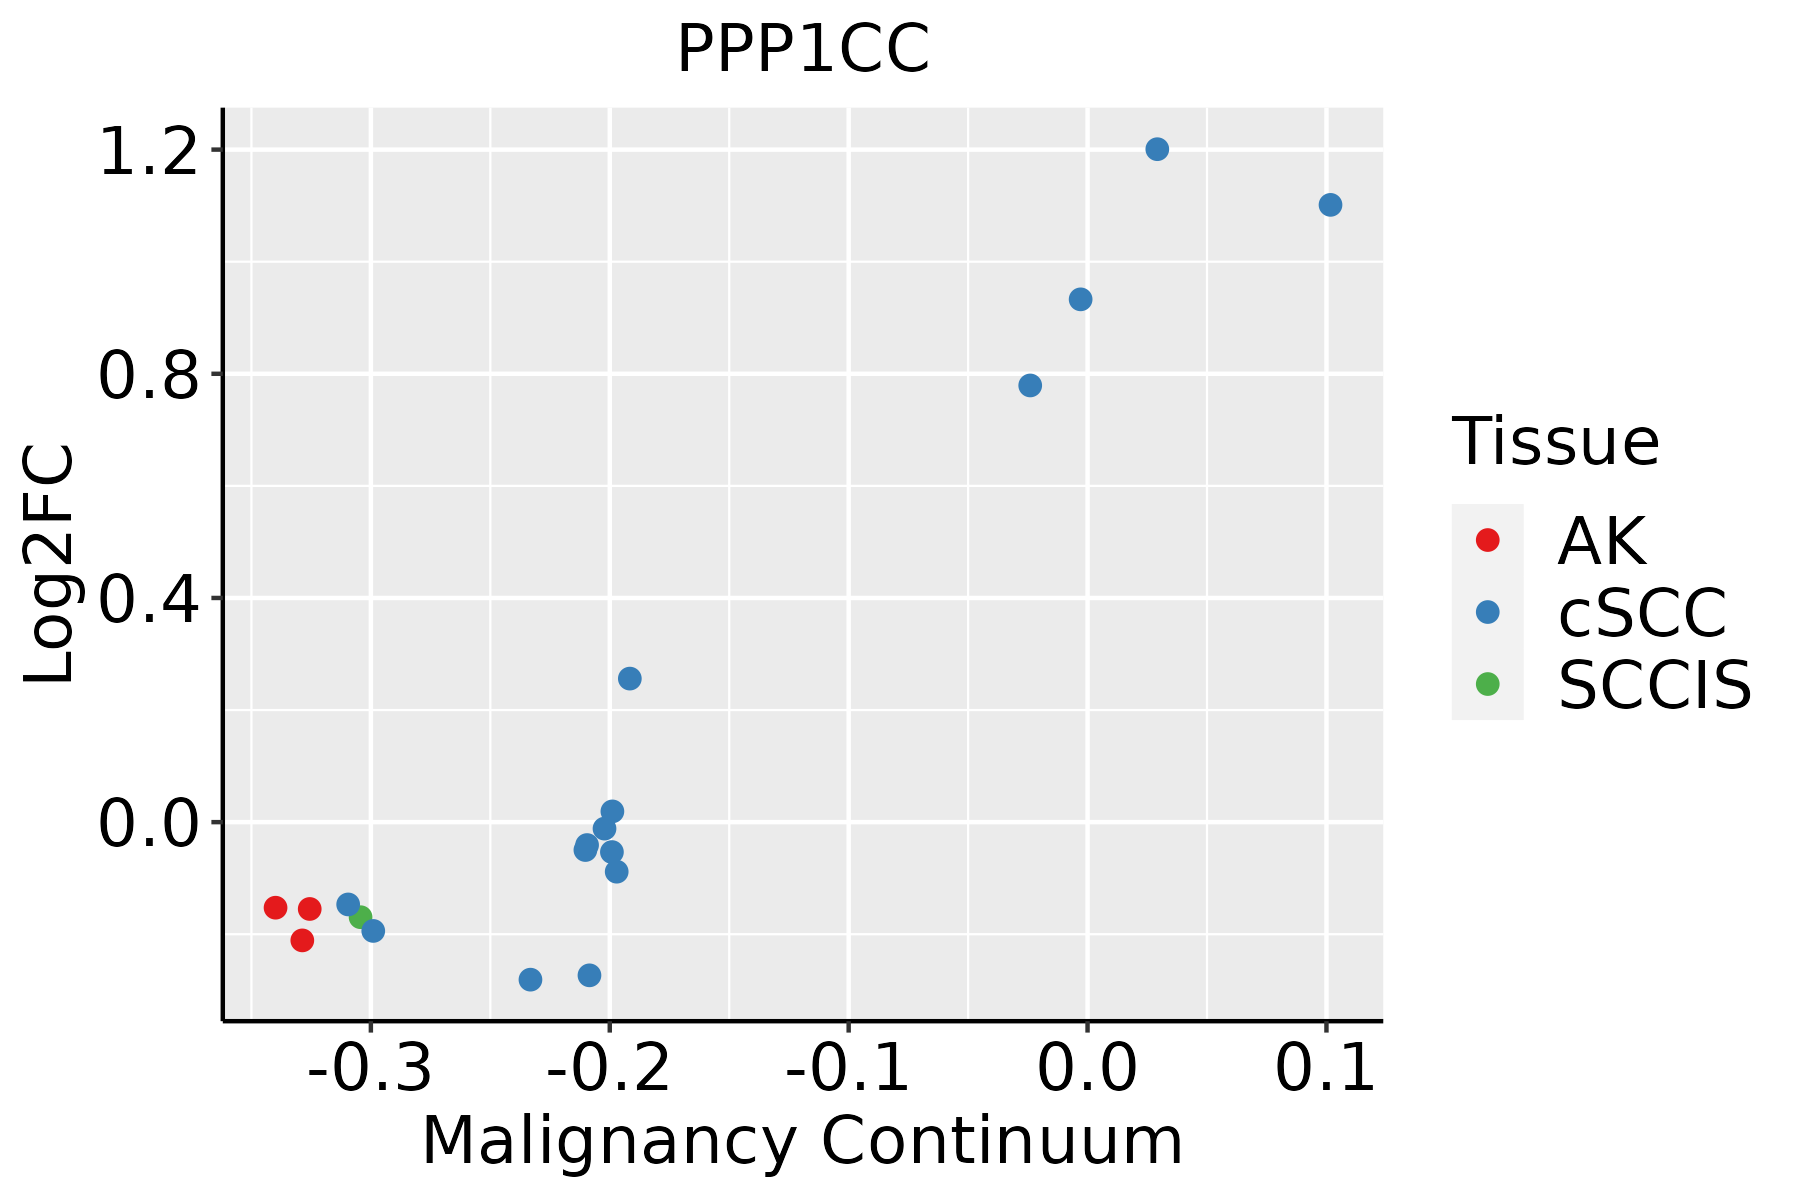 | AK: Actinic keratosis |
| cSCC: Cutaneous squamous cell carcinoma | ||
| SCCIS:squamous cell carcinoma in situ | ||
| Thyroid |  | ATC: Anaplastic thyroid cancer |
| HT: Hashimoto's thyroiditis | ||
| PTC: Papillary thyroid cancer |
| ∗log2FC in expression of this searched gene in stem-like cells from each diseased tissue sample relative to stem-like cells in normal samples in each tissue plotted against the malignancy continuum. Samples are colored based on if they are from different disease stage. |
Top |
Malignant transformation related pathway analysis |
| Find out the enriched GO biological processes and KEGG pathways involved in transition from healthy to precancer to cancer |
| Tissue | Disease Stage | Enriched GO biological Processes |
| Colorectum | AD |  |
| Colorectum | SER |  |
| Colorectum | MSS |  |
| Colorectum | MSI-H |  |
| Colorectum | FAP |  |
| ∗Top 15 enriched GO BP terms are showed in the bar plot of each disease state in each tissue. Each row represents a significant GO biological process which is colored according to the -log10(p.adjust). |
| Page: 1 2 3 4 5 6 7 8 9 |
| GO ID | Tissue | Disease Stage | Description | Gene Ratio | Bg Ratio | pvalue | p.adjust | Count |
| GO:001072016 | Skin | cSCC | positive regulation of cell development | 105/4864 | 298/18723 | 2.30e-04 | 1.89e-03 | 105 |
| GO:004275221 | Skin | cSCC | regulation of circadian rhythm | 48/4864 | 121/18723 | 6.58e-04 | 4.73e-03 | 48 |
| GO:004206322 | Skin | cSCC | gliogenesis | 103/4864 | 301/18723 | 8.48e-04 | 5.85e-03 | 103 |
| GO:005076913 | Skin | cSCC | positive regulation of neurogenesis | 80/4864 | 225/18723 | 8.85e-04 | 6.07e-03 | 80 |
| GO:000941621 | Skin | cSCC | response to light stimulus | 107/4864 | 320/18723 | 1.66e-03 | 1.02e-02 | 107 |
| GO:001631115 | Skin | cSCC | dephosphorylation | 134/4864 | 417/18723 | 2.65e-03 | 1.50e-02 | 134 |
| GO:005076722 | Skin | cSCC | regulation of neurogenesis | 118/4864 | 364/18723 | 3.32e-03 | 1.81e-02 | 118 |
| GO:00096482 | Skin | cSCC | photoperiodism | 16/4864 | 33/18723 | 4.50e-03 | 2.30e-02 | 16 |
| GO:00431532 | Skin | cSCC | entrainment of circadian clock by photoperiod | 14/4864 | 29/18723 | 8.08e-03 | 3.74e-02 | 14 |
| GO:005196213 | Skin | cSCC | positive regulation of nervous system development | 88/4864 | 272/18723 | 1.07e-02 | 4.66e-02 | 88 |
| GO:001598027 | Thyroid | HT | energy derivation by oxidation of organic compounds | 57/1272 | 318/18723 | 1.27e-11 | 2.20e-09 | 57 |
| GO:000609127 | Thyroid | HT | generation of precursor metabolites and energy | 73/1272 | 490/18723 | 1.63e-10 | 2.21e-08 | 73 |
| GO:000762324 | Thyroid | HT | circadian rhythm | 33/1272 | 210/18723 | 5.38e-06 | 1.66e-04 | 33 |
| GO:003292218 | Thyroid | HT | circadian regulation of gene expression | 16/1272 | 68/18723 | 9.48e-06 | 2.62e-04 | 16 |
| GO:004851120 | Thyroid | HT | rhythmic process | 41/1272 | 298/18723 | 1.26e-05 | 3.27e-04 | 41 |
| GO:001072017 | Thyroid | HT | positive regulation of cell development | 40/1272 | 298/18723 | 2.85e-05 | 6.14e-04 | 40 |
| GO:000691325 | Thyroid | HT | nucleocytoplasmic transport | 39/1272 | 301/18723 | 7.81e-05 | 1.38e-03 | 39 |
| GO:00420638 | Thyroid | HT | gliogenesis | 39/1272 | 301/18723 | 7.81e-05 | 1.38e-03 | 39 |
| GO:005116925 | Thyroid | HT | nuclear transport | 39/1272 | 301/18723 | 7.81e-05 | 1.38e-03 | 39 |
| GO:00507699 | Thyroid | HT | positive regulation of neurogenesis | 29/1272 | 225/18723 | 6.69e-04 | 7.61e-03 | 29 |
| Page: 1 2 3 4 5 6 7 8 9 10 11 12 13 14 15 16 |
| Pathway ID | Tissue | Disease Stage | Description | Gene Ratio | Bg Ratio | pvalue | p.adjust | qvalue | Count |
| hsa05415 | Colorectum | AD | Diabetic cardiomyopathy | 114/2092 | 203/8465 | 3.65e-22 | 3.06e-20 | 1.95e-20 | 114 |
| hsa05205 | Colorectum | AD | Proteoglycans in cancer | 70/2092 | 205/8465 | 1.37e-03 | 8.46e-03 | 5.39e-03 | 70 |
| hsa04810 | Colorectum | AD | Regulation of actin cytoskeleton | 75/2092 | 229/8465 | 3.36e-03 | 1.76e-02 | 1.12e-02 | 75 |
| hsa04510 | Colorectum | AD | Focal adhesion | 67/2092 | 203/8465 | 4.40e-03 | 2.17e-02 | 1.38e-02 | 67 |
| hsa04728 | Colorectum | AD | Dopaminergic synapse | 46/2092 | 132/8465 | 5.55e-03 | 2.48e-02 | 1.58e-02 | 46 |
| hsa04218 | Colorectum | AD | Cellular senescence | 53/2092 | 156/8465 | 5.55e-03 | 2.48e-02 | 1.58e-02 | 53 |
| hsa04720 | Colorectum | AD | Long-term potentiation | 26/2092 | 67/8465 | 7.26e-03 | 2.97e-02 | 1.89e-02 | 26 |
| hsa03015 | Colorectum | AD | mRNA surveillance pathway | 35/2092 | 97/8465 | 7.95e-03 | 3.13e-02 | 2.00e-02 | 35 |
| hsa054151 | Colorectum | AD | Diabetic cardiomyopathy | 114/2092 | 203/8465 | 3.65e-22 | 3.06e-20 | 1.95e-20 | 114 |
| hsa052051 | Colorectum | AD | Proteoglycans in cancer | 70/2092 | 205/8465 | 1.37e-03 | 8.46e-03 | 5.39e-03 | 70 |
| hsa048101 | Colorectum | AD | Regulation of actin cytoskeleton | 75/2092 | 229/8465 | 3.36e-03 | 1.76e-02 | 1.12e-02 | 75 |
| hsa045101 | Colorectum | AD | Focal adhesion | 67/2092 | 203/8465 | 4.40e-03 | 2.17e-02 | 1.38e-02 | 67 |
| hsa047281 | Colorectum | AD | Dopaminergic synapse | 46/2092 | 132/8465 | 5.55e-03 | 2.48e-02 | 1.58e-02 | 46 |
| hsa042181 | Colorectum | AD | Cellular senescence | 53/2092 | 156/8465 | 5.55e-03 | 2.48e-02 | 1.58e-02 | 53 |
| hsa047201 | Colorectum | AD | Long-term potentiation | 26/2092 | 67/8465 | 7.26e-03 | 2.97e-02 | 1.89e-02 | 26 |
| hsa030151 | Colorectum | AD | mRNA surveillance pathway | 35/2092 | 97/8465 | 7.95e-03 | 3.13e-02 | 2.00e-02 | 35 |
| hsa054154 | Colorectum | MSS | Diabetic cardiomyopathy | 106/1875 | 203/8465 | 2.47e-21 | 1.62e-19 | 9.92e-20 | 106 |
| hsa042182 | Colorectum | MSS | Cellular senescence | 52/1875 | 156/8465 | 7.87e-04 | 5.07e-03 | 3.11e-03 | 52 |
| hsa052054 | Colorectum | MSS | Proteoglycans in cancer | 65/1875 | 205/8465 | 8.66e-04 | 5.38e-03 | 3.29e-03 | 65 |
| hsa047284 | Colorectum | MSS | Dopaminergic synapse | 45/1875 | 132/8465 | 1.02e-03 | 5.94e-03 | 3.64e-03 | 45 |
| Page: 1 2 3 4 5 6 7 8 9 10 11 12 |
Top |
Cell-cell communication analysis |
| Identification of potential cell-cell interactions between two cell types and their ligand-receptor pairs for different disease states |
| Ligand | Receptor | LRpair | Pathway | Tissue | Disease Stage |
| Page: 1 |
Top |
Single-cell gene regulatory network inference analysis |
| Find out the significant the regulons (TFs) and the target genes of each regulon across cell types for different disease states |
| TF | Cell Type | Tissue | Disease Stage | Target Gene | RSS | Regulon Activity |
| ∗The dot plots of a searched regulon are shown for all cell subpopulations in each disease state of each tissue based on the regulon specific score inferred using pySCENIC and by calculating the average expression. |
| Page: 1 |
Top |
Somatic mutation of malignant transformation related genes |
| Annotation of somatic variants for genes involved in malignant transformation |
| Hugo Symbol | Variant Class | Variant Classification | dbSNP RS | HGVSc | HGVSp | HGVSp Short | SWISSPROT | BIOTYPE | SIFT | PolyPhen | Tumor Sample Barcode | Tissue | Histology | Sex | Age | Stage | Therapy Types | Drugs | Outcome |
| PPP1CC | SNV | Missense_Mutation | novel | c.452N>G | p.Thr151Ser | p.T151S | P36873 | protein_coding | deleterious_low_confidence(0.02) | benign(0.01) | TCGA-OL-A5RW-01 | Breast | breast invasive carcinoma | Female | <65 | I/II | Chemotherapy | adriamycin | CR |
| PPP1CC | SNV | Missense_Mutation | novel | c.365G>A | p.Arg122Lys | p.R122K | P36873 | protein_coding | deleterious_low_confidence(0.01) | probably_damaging(0.967) | TCGA-UU-A93S-01 | Breast | breast invasive carcinoma | Female | <65 | III/IV | Unknown | Unknown | PD |
| PPP1CC | SNV | Missense_Mutation | c.493N>A | p.Val165Met | p.V165M | P36873 | protein_coding | tolerated_low_confidence(0.07) | benign(0.332) | TCGA-DS-A0VK-01 | Cervix | cervical & endocervical cancer | Female | <65 | I/II | Chemotherapy | carboplatin | PD | |
| PPP1CC | SNV | Missense_Mutation | c.348N>T | p.Glu116Asp | p.E116D | P36873 | protein_coding | tolerated_low_confidence(0.17) | benign(0.003) | TCGA-AA-A00N-01 | Colorectum | colon adenocarcinoma | Male | >=65 | I/II | Unknown | Unknown | PD | |
| PPP1CC | SNV | Missense_Mutation | novel | c.308C>T | p.Thr103Met | p.T103M | P36873 | protein_coding | deleterious_low_confidence(0) | probably_damaging(0.951) | TCGA-AZ-6598-01 | Colorectum | colon adenocarcinoma | Female | >=65 | I/II | Unknown | Unknown | SD |
| PPP1CC | SNV | Missense_Mutation | c.28G>A | p.Asp10Asn | p.D10N | P36873 | protein_coding | tolerated_low_confidence(0.07) | benign(0.078) | TCGA-CK-4951-01 | Colorectum | colon adenocarcinoma | Female | >=65 | I/II | Unknown | Unknown | PD | |
| PPP1CC | SNV | Missense_Mutation | c.902A>C | p.Lys301Thr | p.K301T | P36873 | protein_coding | deleterious_low_confidence(0.04) | possibly_damaging(0.662) | TCGA-QG-A5YV-01 | Colorectum | colon adenocarcinoma | Female | <65 | III/IV | Chemotherapy | xeloda | CR | |
| PPP1CC | SNV | Missense_Mutation | novel | c.610N>A | p.Leu204Ile | p.L204I | P36873 | protein_coding | deleterious_low_confidence(0.03) | benign(0.373) | TCGA-AG-A002-01 | Colorectum | rectum adenocarcinoma | Male | <65 | I/II | Unknown | Unknown | SD |
| PPP1CC | SNV | Missense_Mutation | novel | c.941G>T | p.Arg314Met | p.R314M | P36873 | protein_coding | deleterious_low_confidence(0.02) | possibly_damaging(0.802) | TCGA-AJ-A2QO-01 | Endometrium | uterine corpus endometrioid carcinoma | Female | >=65 | I/II | Unknown | Unknown | SD |
| PPP1CC | SNV | Missense_Mutation | novel | c.268N>A | p.Leu90Ile | p.L90I | P36873 | protein_coding | deleterious_low_confidence(0) | possibly_damaging(0.87) | TCGA-AJ-A5DW-01 | Endometrium | uterine corpus endometrioid carcinoma | Female | <65 | I/II | Unknown | Unknown | SD |
| Page: 1 2 3 |
Top |
Related drugs of malignant transformation related genes |
| Identification of chemicals and drugs interact with genes involved in malignant transfromation |
| (DGIdb 4.0) |
| Entrez ID | Symbol | Category | Interaction Types | Drug Claim Name | Drug Name | PMIDs |
| Page: 1 |

Copyright 2023-Present -The University of Texas Health Science Center at Houston |