
|
|||||
|
 | |
| |
| |
| |
| |
| |
|
Gene: PLK3 |
Gene summary for PLK3 |
| Gene information | Species | Human | Gene symbol | PLK3 | Gene ID | 1263 |
| Gene name | polo like kinase 3 | |
| Gene Alias | CNK | |
| Cytomap | 1p34.1 | |
| Gene Type | protein-coding | GO ID | GO:0000075 | UniProtAcc | Q9H4B4 |
Top |
Malignant transformation analysis |
| Identification of the aberrant gene expression in precancerous and cancerous lesions by comparing the gene expression of stem-like cells in diseased tissues with normal stem cells |
| Entrez ID | Symbol | Replicates | Species | Organ | Tissue | Adj P-value | Log2FC | Malignancy |
| 1263 | PLK3 | LZE4T | Human | Esophagus | ESCC | 3.86e-02 | -8.04e-02 | 0.0811 |
| 1263 | PLK3 | LZE20T | Human | Esophagus | ESCC | 1.03e-04 | 4.14e-01 | 0.0662 |
| 1263 | PLK3 | LZE21D1 | Human | Esophagus | HGIN | 1.07e-02 | 3.87e-01 | 0.0632 |
| 1263 | PLK3 | LZE24T | Human | Esophagus | ESCC | 3.73e-10 | 5.67e-01 | 0.0596 |
| 1263 | PLK3 | P1T-E | Human | Esophagus | ESCC | 3.83e-08 | 8.52e-01 | 0.0875 |
| 1263 | PLK3 | P2T-E | Human | Esophagus | ESCC | 9.21e-22 | 5.96e-01 | 0.1177 |
| 1263 | PLK3 | P4T-E | Human | Esophagus | ESCC | 7.35e-11 | 3.93e-01 | 0.1323 |
| 1263 | PLK3 | P5T-E | Human | Esophagus | ESCC | 8.29e-21 | 7.65e-01 | 0.1327 |
| 1263 | PLK3 | P8T-E | Human | Esophagus | ESCC | 3.90e-17 | 3.10e-01 | 0.0889 |
| 1263 | PLK3 | P9T-E | Human | Esophagus | ESCC | 8.61e-06 | 3.56e-01 | 0.1131 |
| 1263 | PLK3 | P11T-E | Human | Esophagus | ESCC | 4.98e-13 | 1.49e+00 | 0.1426 |
| 1263 | PLK3 | P12T-E | Human | Esophagus | ESCC | 1.86e-10 | 2.42e-01 | 0.1122 |
| 1263 | PLK3 | P15T-E | Human | Esophagus | ESCC | 3.21e-04 | 2.27e-01 | 0.1149 |
| 1263 | PLK3 | P16T-E | Human | Esophagus | ESCC | 2.47e-08 | -5.92e-02 | 0.1153 |
| 1263 | PLK3 | P17T-E | Human | Esophagus | ESCC | 1.59e-05 | 4.45e-01 | 0.1278 |
| 1263 | PLK3 | P20T-E | Human | Esophagus | ESCC | 1.48e-17 | 1.06e+00 | 0.1124 |
| 1263 | PLK3 | P21T-E | Human | Esophagus | ESCC | 9.72e-39 | 1.26e+00 | 0.1617 |
| 1263 | PLK3 | P22T-E | Human | Esophagus | ESCC | 1.47e-06 | 3.36e-02 | 0.1236 |
| 1263 | PLK3 | P23T-E | Human | Esophagus | ESCC | 5.50e-30 | 1.02e+00 | 0.108 |
| 1263 | PLK3 | P24T-E | Human | Esophagus | ESCC | 2.80e-13 | 4.19e-01 | 0.1287 |
| Page: 1 2 3 4 5 6 |
| Tissue | Expression Dynamics | Abbreviation |
| Esophagus |  | ESCC: Esophageal squamous cell carcinoma |
| HGIN: High-grade intraepithelial neoplasias | ||
| LGIN: Low-grade intraepithelial neoplasias | ||
| Lung | 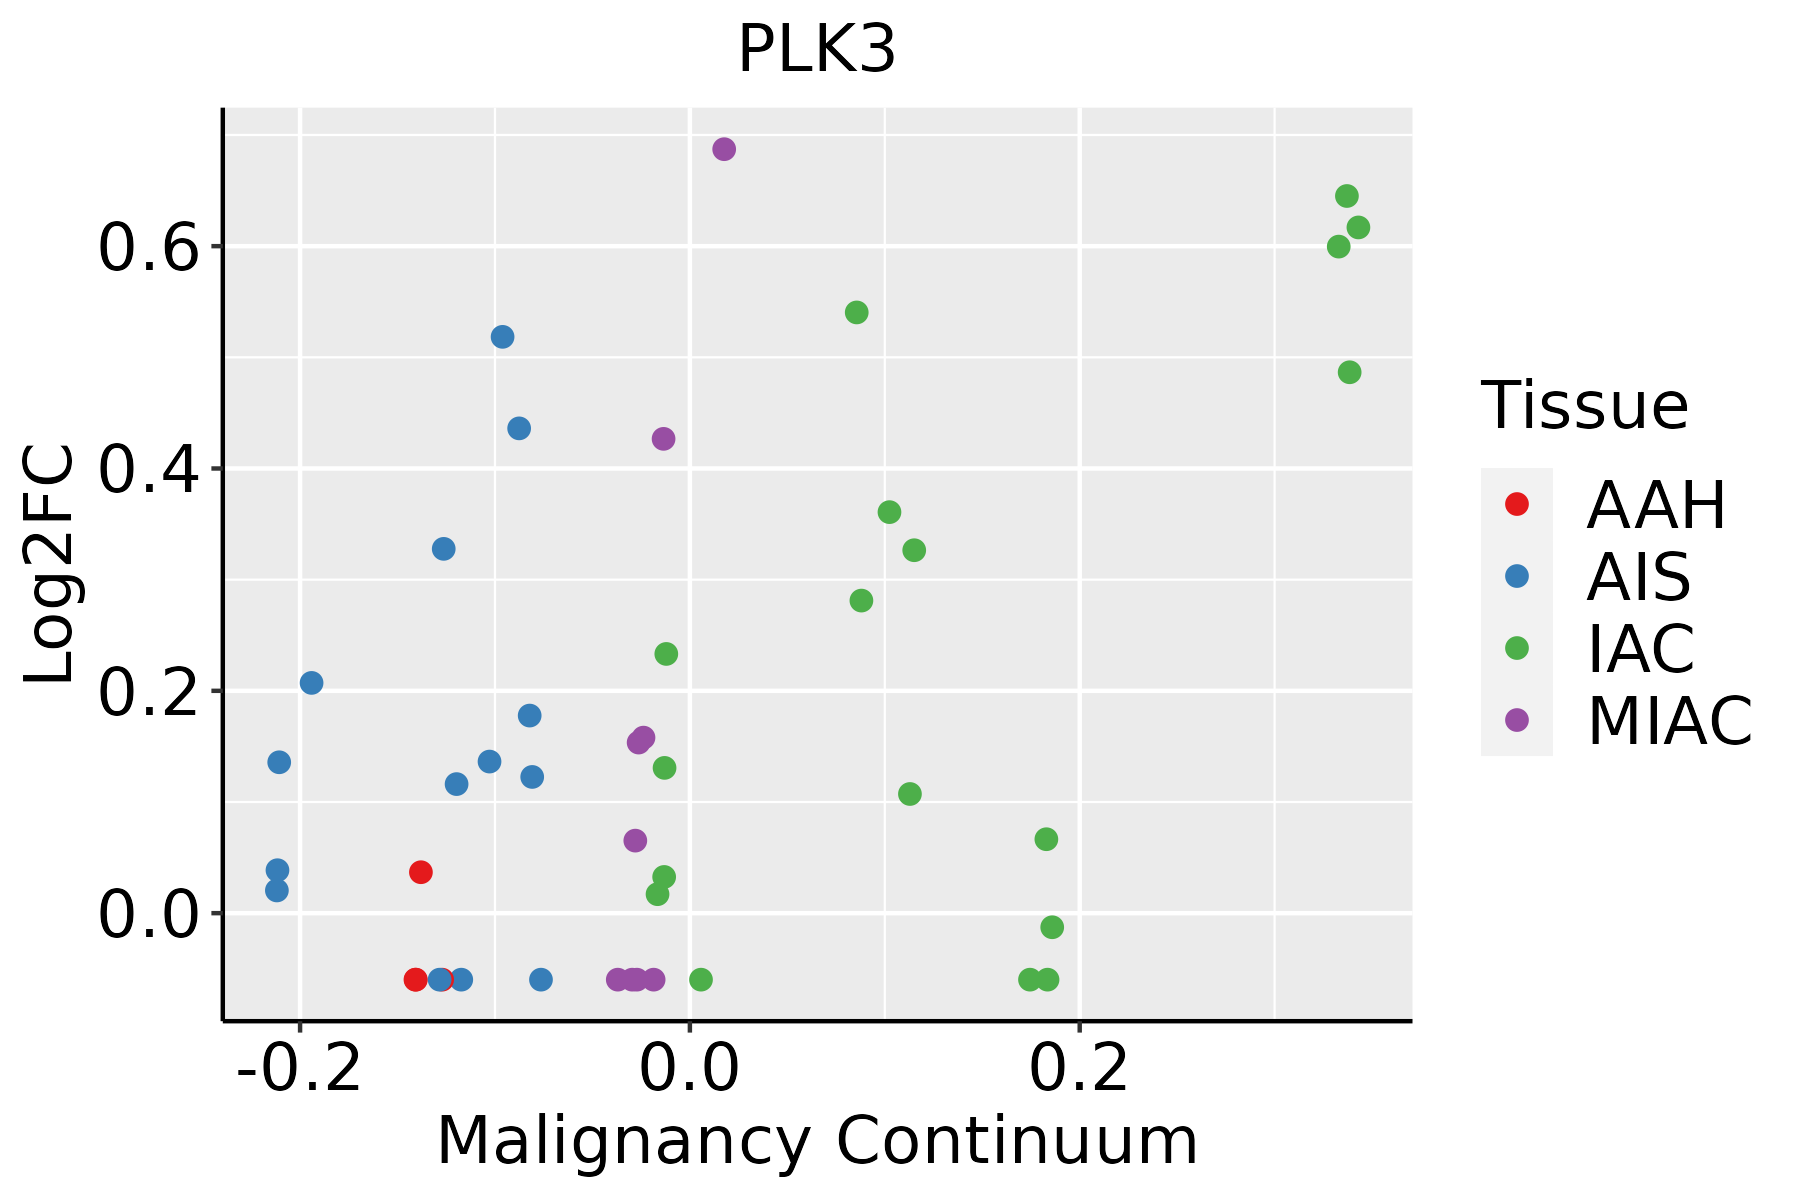 | AAH: Atypical adenomatous hyperplasia |
| AIS: Adenocarcinoma in situ | ||
| IAC: Invasive lung adenocarcinoma | ||
| MIA: Minimally invasive adenocarcinoma | ||
| Oral Cavity |  | EOLP: Erosive Oral lichen planus |
| LP: leukoplakia | ||
| NEOLP: Non-erosive oral lichen planus | ||
| OSCC: Oral squamous cell carcinoma | ||
| Skin | 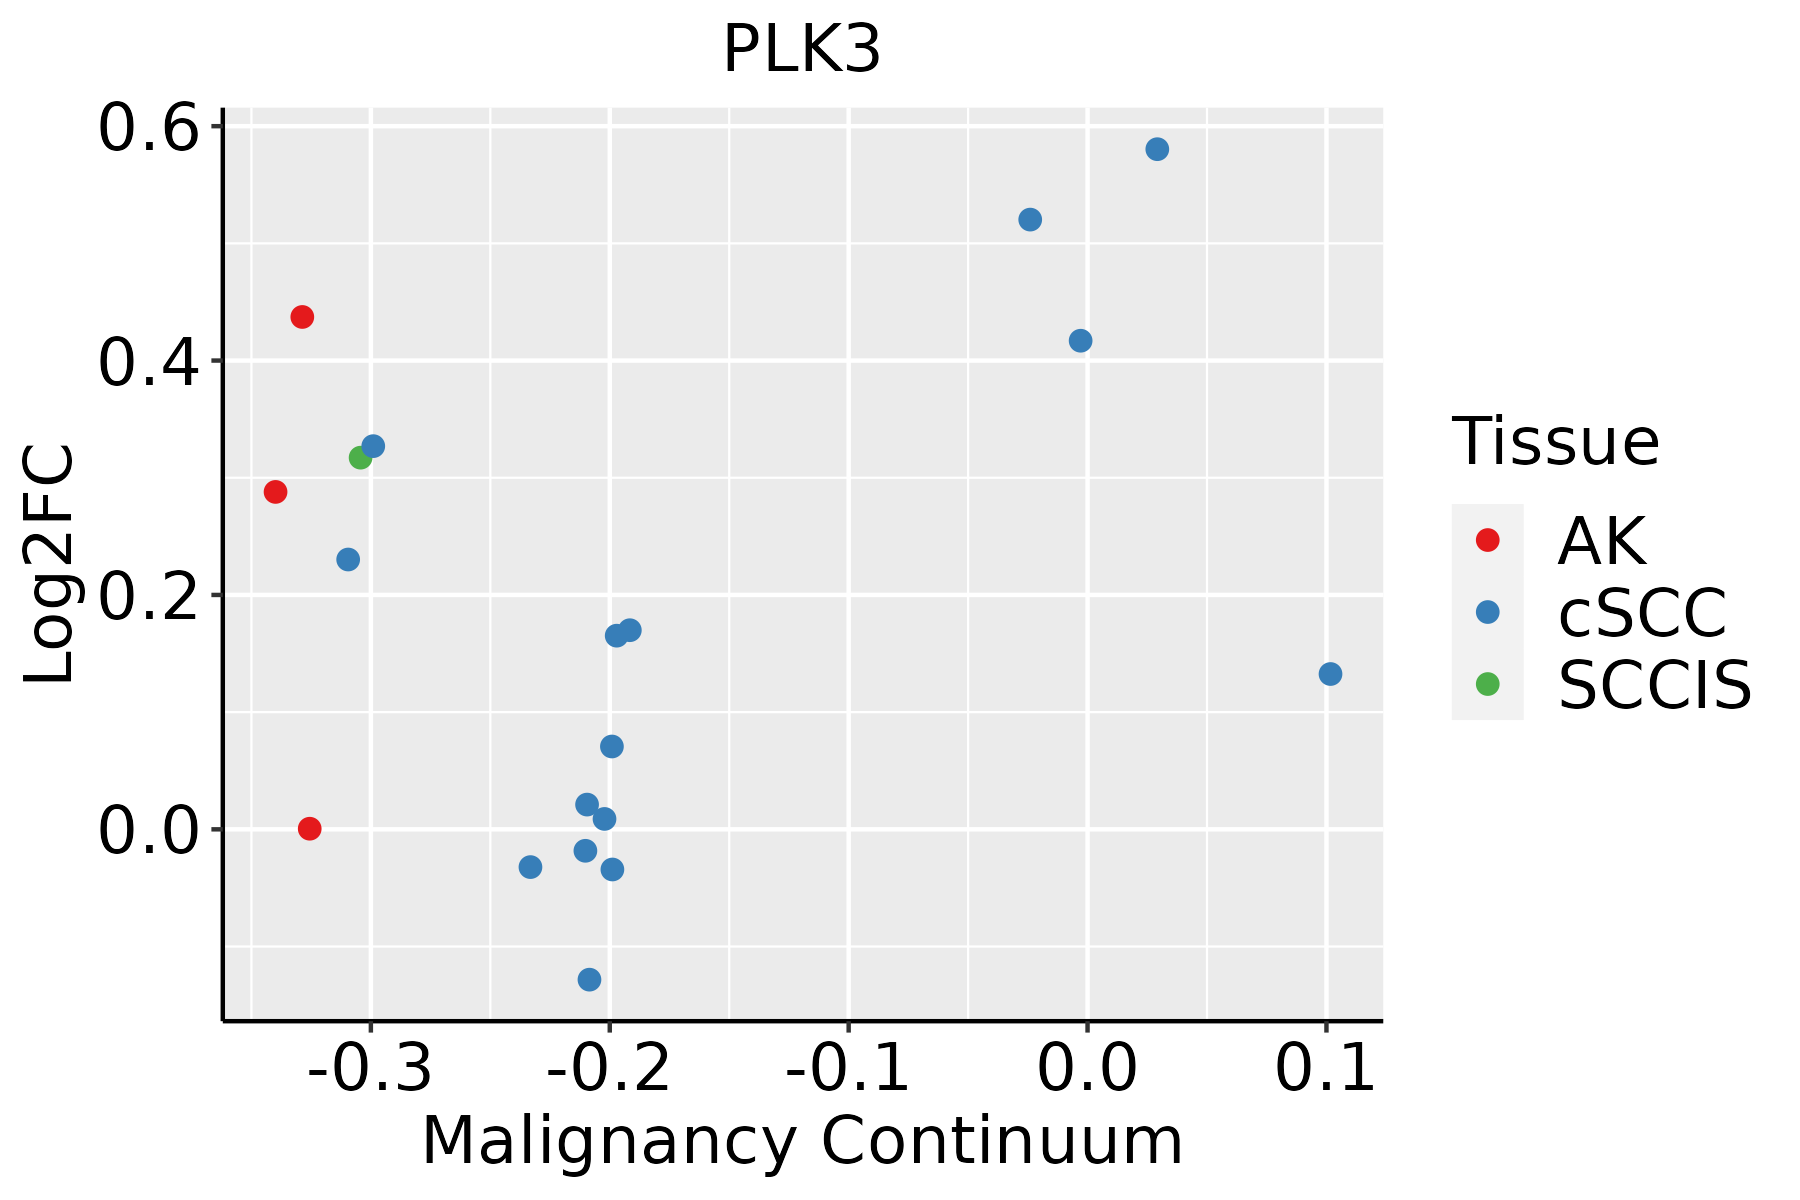 | AK: Actinic keratosis |
| cSCC: Cutaneous squamous cell carcinoma | ||
| SCCIS:squamous cell carcinoma in situ | ||
| Thyroid | 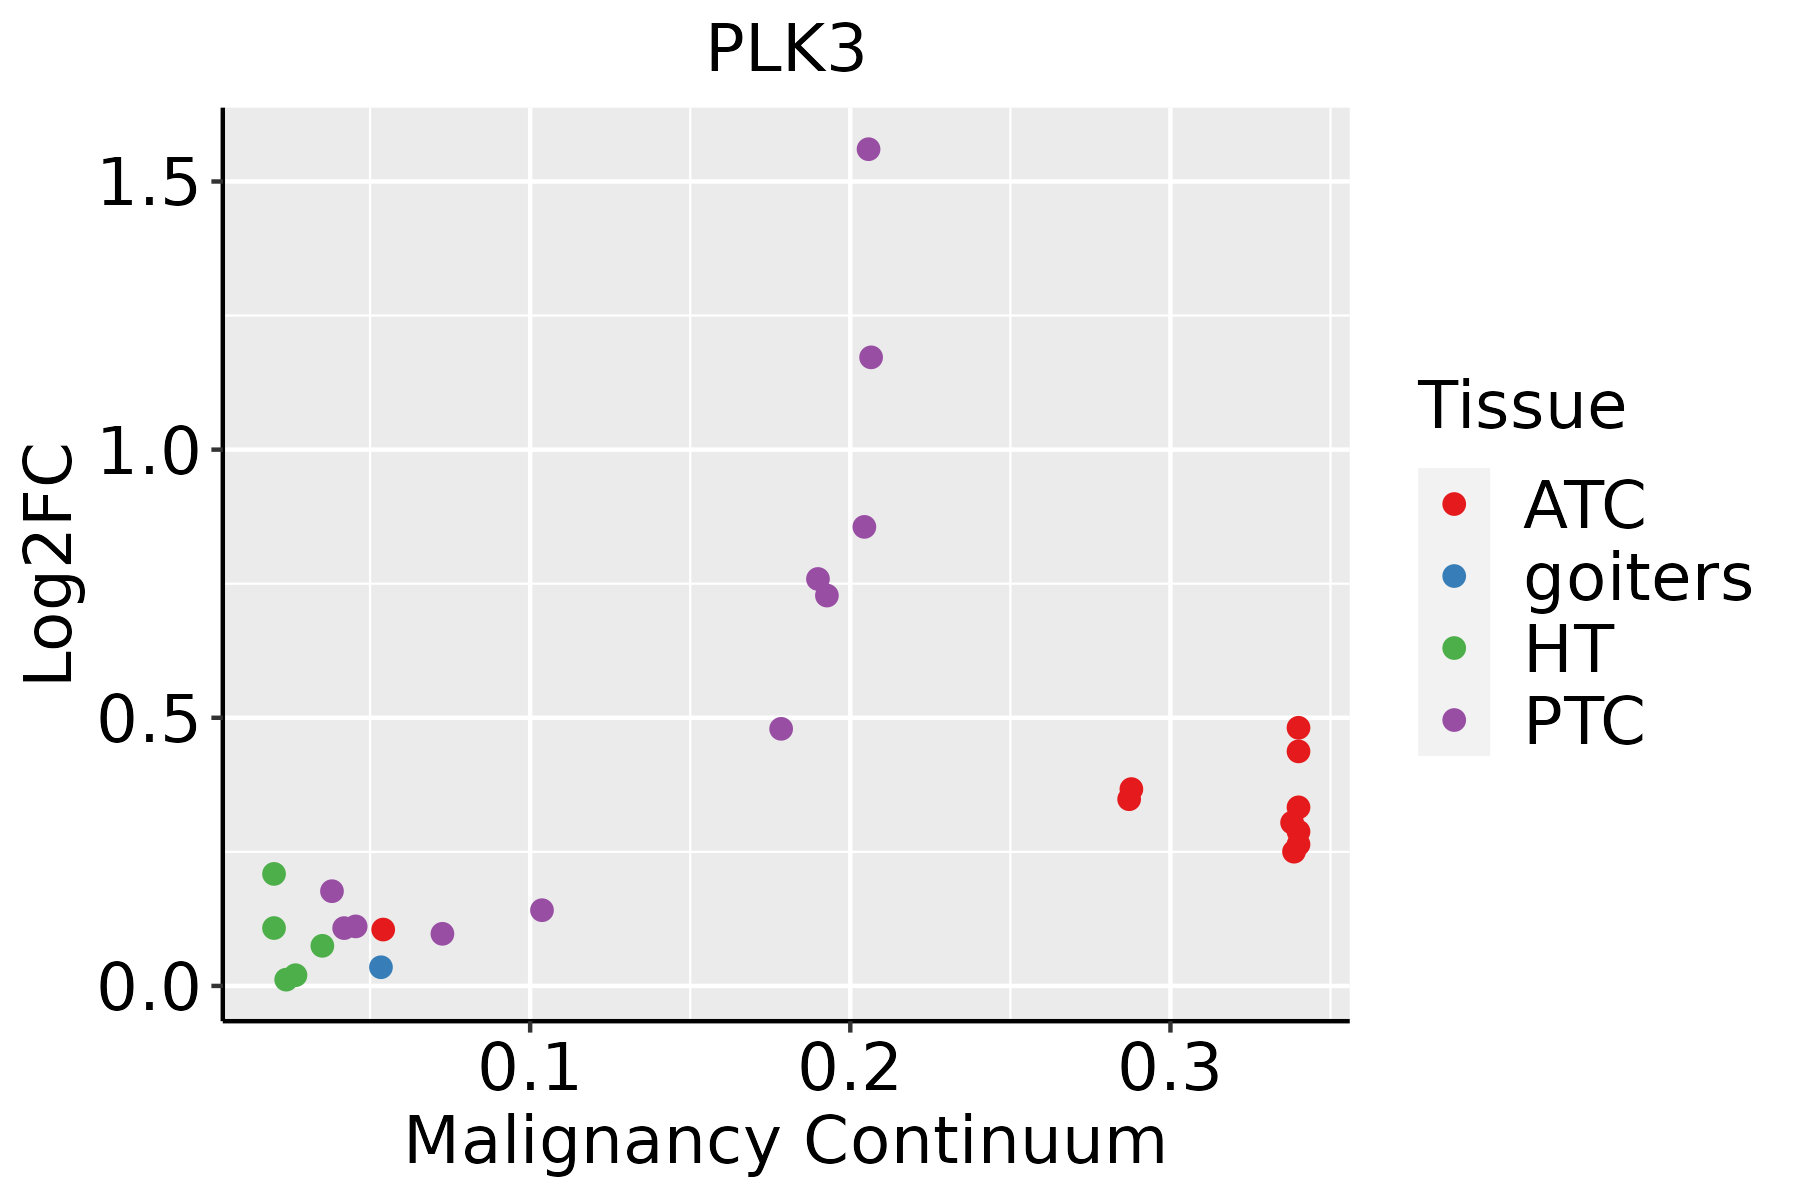 | ATC: Anaplastic thyroid cancer |
| HT: Hashimoto's thyroiditis | ||
| PTC: Papillary thyroid cancer |
| ∗log2FC in expression of this searched gene in stem-like cells from each diseased tissue sample relative to stem-like cells in normal samples in each tissue plotted against the malignancy continuum. Samples are colored based on if they are from different disease stage. |
Top |
Malignant transformation related pathway analysis |
| Find out the enriched GO biological processes and KEGG pathways involved in transition from healthy to precancer to cancer |
| Tissue | Disease Stage | Enriched GO biological Processes |
| Colorectum | AD |  |
| Colorectum | SER |  |
| Colorectum | MSS |  |
| Colorectum | MSI-H |  |
| Colorectum | FAP |  |
| ∗Top 15 enriched GO BP terms are showed in the bar plot of each disease state in each tissue. Each row represents a significant GO biological process which is colored according to the -log10(p.adjust). |
| Page: 1 2 3 4 5 6 7 8 9 |
| GO ID | Tissue | Disease Stage | Description | Gene Ratio | Bg Ratio | pvalue | p.adjust | Count |
| GO:003238812 | Lung | AIS | positive regulation of intracellular transport | 33/1849 | 202/18723 | 2.67e-03 | 2.70e-02 | 33 |
| GO:000030213 | Lung | AIS | response to reactive oxygen species | 35/1849 | 222/18723 | 3.69e-03 | 3.46e-02 | 35 |
| GO:00315701 | Lung | AIS | DNA integrity checkpoint | 22/1849 | 123/18723 | 4.32e-03 | 3.86e-02 | 22 |
| GO:001049820 | Oral cavity | OSCC | proteasomal protein catabolic process | 336/7305 | 490/18723 | 5.45e-41 | 8.63e-38 | 336 |
| GO:004316120 | Oral cavity | OSCC | proteasome-mediated ubiquitin-dependent protein catabolic process | 285/7305 | 412/18723 | 5.68e-36 | 5.99e-33 | 285 |
| GO:002241119 | Oral cavity | OSCC | cellular component disassembly | 283/7305 | 443/18723 | 9.57e-27 | 3.37e-24 | 283 |
| GO:000989620 | Oral cavity | OSCC | positive regulation of catabolic process | 307/7305 | 492/18723 | 2.29e-26 | 7.64e-24 | 307 |
| GO:003133120 | Oral cavity | OSCC | positive regulation of cellular catabolic process | 273/7305 | 427/18723 | 6.39e-26 | 2.02e-23 | 273 |
| GO:004217620 | Oral cavity | OSCC | regulation of protein catabolic process | 254/7305 | 391/18723 | 1.07e-25 | 3.22e-23 | 254 |
| GO:004586220 | Oral cavity | OSCC | positive regulation of proteolysis | 236/7305 | 372/18723 | 6.53e-22 | 1.38e-19 | 236 |
| GO:003238615 | Oral cavity | OSCC | regulation of intracellular transport | 218/7305 | 337/18723 | 6.91e-22 | 1.41e-19 | 218 |
| GO:000697920 | Oral cavity | OSCC | response to oxidative stress | 273/7305 | 446/18723 | 8.35e-22 | 1.65e-19 | 273 |
| GO:190336220 | Oral cavity | OSCC | regulation of cellular protein catabolic process | 174/7305 | 255/18723 | 2.04e-21 | 3.70e-19 | 174 |
| GO:190305020 | Oral cavity | OSCC | regulation of proteolysis involved in cellular protein catabolic process | 152/7305 | 221/18723 | 2.16e-19 | 3.15e-17 | 152 |
| GO:00447728 | Oral cavity | OSCC | mitotic cell cycle phase transition | 255/7305 | 424/18723 | 5.29e-19 | 6.98e-17 | 255 |
| GO:003315718 | Oral cavity | OSCC | regulation of intracellular protein transport | 155/7305 | 229/18723 | 1.05e-18 | 1.28e-16 | 155 |
| GO:006113620 | Oral cavity | OSCC | regulation of proteasomal protein catabolic process | 132/7305 | 187/18723 | 1.57e-18 | 1.81e-16 | 132 |
| GO:200005820 | Oral cavity | OSCC | regulation of ubiquitin-dependent protein catabolic process | 118/7305 | 164/18723 | 9.37e-18 | 9.27e-16 | 118 |
| GO:001050610 | Oral cavity | OSCC | regulation of autophagy | 198/7305 | 317/18723 | 1.63e-17 | 1.51e-15 | 198 |
| GO:00073469 | Oral cavity | OSCC | regulation of mitotic cell cycle | 266/7305 | 457/18723 | 3.87e-17 | 3.41e-15 | 266 |
| Page: 1 2 3 4 5 6 7 8 9 10 11 12 13 14 15 16 17 18 19 20 21 22 23 24 25 26 27 28 29 30 31 32 33 34 35 |
| Pathway ID | Tissue | Disease Stage | Description | Gene Ratio | Bg Ratio | pvalue | p.adjust | qvalue | Count |
| hsa040689 | Esophagus | ESCC | FoxO signaling pathway | 89/4205 | 131/8465 | 1.56e-05 | 7.98e-05 | 4.09e-05 | 89 |
| hsa046259 | Esophagus | ESCC | C-type lectin receptor signaling pathway | 73/4205 | 104/8465 | 1.57e-05 | 7.98e-05 | 4.09e-05 | 73 |
| hsa051527 | Esophagus | ESCC | Tuberculosis | 111/4205 | 180/8465 | 7.14e-04 | 2.32e-03 | 1.19e-03 | 111 |
| hsa0406814 | Esophagus | ESCC | FoxO signaling pathway | 89/4205 | 131/8465 | 1.56e-05 | 7.98e-05 | 4.09e-05 | 89 |
| hsa0462513 | Esophagus | ESCC | C-type lectin receptor signaling pathway | 73/4205 | 104/8465 | 1.57e-05 | 7.98e-05 | 4.09e-05 | 73 |
| hsa0515212 | Esophagus | ESCC | Tuberculosis | 111/4205 | 180/8465 | 7.14e-04 | 2.32e-03 | 1.19e-03 | 111 |
| hsa04625 | Lung | IAC | C-type lectin receptor signaling pathway | 26/1053 | 104/8465 | 3.15e-04 | 3.11e-03 | 2.06e-03 | 26 |
| hsa040686 | Lung | IAC | FoxO signaling pathway | 29/1053 | 131/8465 | 1.25e-03 | 8.24e-03 | 5.47e-03 | 29 |
| hsa046251 | Lung | IAC | C-type lectin receptor signaling pathway | 26/1053 | 104/8465 | 3.15e-04 | 3.11e-03 | 2.06e-03 | 26 |
| hsa0406811 | Lung | IAC | FoxO signaling pathway | 29/1053 | 131/8465 | 1.25e-03 | 8.24e-03 | 5.47e-03 | 29 |
| hsa0406821 | Lung | AIS | FoxO signaling pathway | 25/961 | 131/8465 | 6.07e-03 | 2.94e-02 | 1.88e-02 | 25 |
| hsa0406831 | Lung | AIS | FoxO signaling pathway | 25/961 | 131/8465 | 6.07e-03 | 2.94e-02 | 1.88e-02 | 25 |
| hsa046258 | Oral cavity | OSCC | C-type lectin receptor signaling pathway | 73/3704 | 104/8465 | 3.83e-08 | 3.12e-07 | 1.59e-07 | 73 |
| hsa040688 | Oral cavity | OSCC | FoxO signaling pathway | 85/3704 | 131/8465 | 7.50e-07 | 4.33e-06 | 2.21e-06 | 85 |
| hsa051526 | Oral cavity | OSCC | Tuberculosis | 105/3704 | 180/8465 | 5.00e-05 | 2.04e-04 | 1.04e-04 | 105 |
| hsa0462512 | Oral cavity | OSCC | C-type lectin receptor signaling pathway | 73/3704 | 104/8465 | 3.83e-08 | 3.12e-07 | 1.59e-07 | 73 |
| hsa0406813 | Oral cavity | OSCC | FoxO signaling pathway | 85/3704 | 131/8465 | 7.50e-07 | 4.33e-06 | 2.21e-06 | 85 |
| hsa0515211 | Oral cavity | OSCC | Tuberculosis | 105/3704 | 180/8465 | 5.00e-05 | 2.04e-04 | 1.04e-04 | 105 |
| hsa0462521 | Oral cavity | LP | C-type lectin receptor signaling pathway | 43/2418 | 104/8465 | 3.33e-03 | 1.41e-02 | 9.06e-03 | 43 |
| hsa0515221 | Oral cavity | LP | Tuberculosis | 65/2418 | 180/8465 | 1.60e-02 | 4.92e-02 | 3.17e-02 | 65 |
| Page: 1 2 |
Top |
Cell-cell communication analysis |
| Identification of potential cell-cell interactions between two cell types and their ligand-receptor pairs for different disease states |
| Ligand | Receptor | LRpair | Pathway | Tissue | Disease Stage |
| Page: 1 |
Top |
Single-cell gene regulatory network inference analysis |
| Find out the significant the regulons (TFs) and the target genes of each regulon across cell types for different disease states |
| TF | Cell Type | Tissue | Disease Stage | Target Gene | RSS | Regulon Activity |
| ∗The dot plots of a searched regulon are shown for all cell subpopulations in each disease state of each tissue based on the regulon specific score inferred using pySCENIC and by calculating the average expression. |
| Page: 1 |
Top |
Somatic mutation of malignant transformation related genes |
| Annotation of somatic variants for genes involved in malignant transformation |
| Hugo Symbol | Variant Class | Variant Classification | dbSNP RS | HGVSc | HGVSp | HGVSp Short | SWISSPROT | BIOTYPE | SIFT | PolyPhen | Tumor Sample Barcode | Tissue | Histology | Sex | Age | Stage | Therapy Types | Drugs | Outcome |
| PLK3 | SNV | Missense_Mutation | c.1585N>A | p.Leu529Met | p.L529M | Q9H4B4 | protein_coding | tolerated(0.51) | possibly_damaging(0.516) | TCGA-AR-A24M-01 | Breast | breast invasive carcinoma | Female | <65 | III/IV | Hormone Therapy | tamoxiphen | SD | |
| PLK3 | SNV | Missense_Mutation | c.1166C>T | p.Ala389Val | p.A389V | Q9H4B4 | protein_coding | tolerated(0.35) | benign(0.001) | TCGA-E2-A1B1-01 | Breast | breast invasive carcinoma | Female | <65 | I/II | Other, specify in notesbiphosphonate | zoledronic | SD | |
| PLK3 | insertion | In_Frame_Ins | novel | c.432_433insCGCCGAGCAGGGCGTGGGCACTTGACCCCC | p.Arg144_Lys145insArgArgAlaGlyArgGlyHisLeuThrPro | p.R144_K145insRRAGRGHLTP | Q9H4B4 | protein_coding | TCGA-A2-A04Q-01 | Breast | breast invasive carcinoma | Female | <65 | I/II | Chemotherapy | adriamycin | SD | ||
| PLK3 | insertion | Frame_Shift_Ins | novel | c.530_531insAATCCAGGCAGCG | p.His177GlnfsTer23 | p.H177Qfs*23 | Q9H4B4 | protein_coding | TCGA-A8-A08H-01 | Breast | breast invasive carcinoma | Female | >=65 | I/II | Unknown | Unknown | SD | ||
| PLK3 | SNV | Missense_Mutation | novel | c.1543T>C | p.Ser515Pro | p.S515P | Q9H4B4 | protein_coding | tolerated(0.1) | possibly_damaging(0.53) | TCGA-2W-A8YY-01 | Cervix | cervical & endocervical cancer | Female | <65 | I/II | Chemotherapy | cisplatin | CR |
| PLK3 | SNV | Missense_Mutation | c.512N>T | p.Ser171Phe | p.S171F | Q9H4B4 | protein_coding | deleterious(0) | possibly_damaging(0.506) | TCGA-UC-A7PF-01 | Cervix | cervical & endocervical cancer | Female | <65 | I/II | Unknown | Unknown | SD | |
| PLK3 | SNV | Missense_Mutation | rs755159184 | c.929N>A | p.Arg310His | p.R310H | Q9H4B4 | protein_coding | tolerated(0.09) | benign(0.227) | TCGA-ZJ-AAXD-01 | Cervix | cervical & endocervical cancer | Female | <65 | III/IV | Unknown | Unknown | SD |
| PLK3 | insertion | In_Frame_Ins | novel | c.1910_1911insTACCTG | p.Leu637_Arg638insThrTrp | p.L637_R638insTW | Q9H4B4 | protein_coding | TCGA-DS-A1OA-01 | Cervix | cervical & endocervical cancer | Female | >=65 | I/II | Chemotherapy | carboplatin | PD | ||
| PLK3 | SNV | Missense_Mutation | novel | c.952N>C | p.Tyr318His | p.Y318H | Q9H4B4 | protein_coding | tolerated(0.05) | possibly_damaging(0.811) | TCGA-AA-3947-01 | Colorectum | colon adenocarcinoma | Female | <65 | I/II | Unknown | Unknown | SD |
| PLK3 | deletion | Frame_Shift_Del | c.1006delN | p.Asn338ThrfsTer35 | p.N338Tfs*35 | Q9H4B4 | protein_coding | TCGA-AA-3672-01 | Colorectum | colon adenocarcinoma | Female | >=65 | III/IV | Unknown | Unknown | SD |
| Page: 1 2 3 4 5 6 |
Top |
Related drugs of malignant transformation related genes |
| Identification of chemicals and drugs interact with genes involved in malignant transfromation |
| (DGIdb 4.0) |
| Entrez ID | Symbol | Category | Interaction Types | Drug Claim Name | Drug Name | PMIDs |
| 1263 | PLK3 | KINASE, SERINE THREONINE KINASE, DRUGGABLE GENOME, TRANSCRIPTION FACTOR, ENZYME | TAE-684 | TAE-684 | ||
| 1263 | PLK3 | KINASE, SERINE THREONINE KINASE, DRUGGABLE GENOME, TRANSCRIPTION FACTOR, ENZYME | inhibitor | 178102294 | BI-2536 | |
| 1263 | PLK3 | KINASE, SERINE THREONINE KINASE, DRUGGABLE GENOME, TRANSCRIPTION FACTOR, ENZYME | RG-1530 | RG-1530 | ||
| 1263 | PLK3 | KINASE, SERINE THREONINE KINASE, DRUGGABLE GENOME, TRANSCRIPTION FACTOR, ENZYME | GW843682X | GW843682X | ||
| 1263 | PLK3 | KINASE, SERINE THREONINE KINASE, DRUGGABLE GENOME, TRANSCRIPTION FACTOR, ENZYME | WORTMANNIN | WORTMANNIN | 17135248 | |
| 1263 | PLK3 | KINASE, SERINE THREONINE KINASE, DRUGGABLE GENOME, TRANSCRIPTION FACTOR, ENZYME | LINIFANIB | LINIFANIB | ||
| 1263 | PLK3 | KINASE, SERINE THREONINE KINASE, DRUGGABLE GENOME, TRANSCRIPTION FACTOR, ENZYME | GS 6201 | GS 6201 | ||
| 1263 | PLK3 | KINASE, SERINE THREONINE KINASE, DRUGGABLE GENOME, TRANSCRIPTION FACTOR, ENZYME | PHA-767491 | CHEMBL225519 | ||
| 1263 | PLK3 | KINASE, SERINE THREONINE KINASE, DRUGGABLE GENOME, TRANSCRIPTION FACTOR, ENZYME | inhibitor | 249565601 | ONVANSERTIB | |
| 1263 | PLK3 | KINASE, SERINE THREONINE KINASE, DRUGGABLE GENOME, TRANSCRIPTION FACTOR, ENZYME | GNF-PF-2301 | CHEMBL578061 |
| Page: 1 2 |

Copyright 2023-Present -The University of Texas Health Science Center at Houston |