
|
|||||
|
 | |
| |
| |
| |
| |
| |
|
Gene: PFDN5 |
Gene summary for PFDN5 |
| Gene information | Species | Human | Gene symbol | PFDN5 | Gene ID | 5204 |
| Gene name | prefoldin subunit 5 | |
| Gene Alias | MM-1 | |
| Cytomap | 12q13.13 | |
| Gene Type | protein-coding | GO ID | GO:0001654 | UniProtAcc | Q99471 |
Top |
Malignant transformation analysis |
| Identification of the aberrant gene expression in precancerous and cancerous lesions by comparing the gene expression of stem-like cells in diseased tissues with normal stem cells |
| Entrez ID | Symbol | Replicates | Species | Organ | Tissue | Adj P-value | Log2FC | Malignancy |
| 5204 | PFDN5 | GSM4909281 | Human | Breast | IDC | 3.37e-31 | -4.57e-01 | 0.21 |
| 5204 | PFDN5 | GSM4909282 | Human | Breast | IDC | 1.15e-42 | -6.45e-01 | -0.0288 |
| 5204 | PFDN5 | GSM4909287 | Human | Breast | IDC | 1.42e-21 | -5.83e-01 | 0.2057 |
| 5204 | PFDN5 | GSM4909290 | Human | Breast | IDC | 4.16e-07 | -3.11e-01 | 0.2096 |
| 5204 | PFDN5 | GSM4909293 | Human | Breast | IDC | 4.65e-02 | -5.84e-02 | 0.1581 |
| 5204 | PFDN5 | GSM4909294 | Human | Breast | IDC | 7.42e-14 | 9.36e-02 | 0.2022 |
| 5204 | PFDN5 | GSM4909296 | Human | Breast | IDC | 2.09e-09 | 5.31e-02 | 0.1524 |
| 5204 | PFDN5 | GSM4909297 | Human | Breast | IDC | 4.05e-23 | -3.09e-01 | 0.1517 |
| 5204 | PFDN5 | GSM4909298 | Human | Breast | IDC | 6.55e-03 | -5.66e-02 | 0.1551 |
| 5204 | PFDN5 | GSM4909309 | Human | Breast | IDC | 1.44e-06 | 1.63e-02 | 0.0483 |
| 5204 | PFDN5 | GSM4909311 | Human | Breast | IDC | 3.40e-52 | -4.57e-01 | 0.1534 |
| 5204 | PFDN5 | GSM4909312 | Human | Breast | IDC | 1.23e-06 | -2.83e-01 | 0.1552 |
| 5204 | PFDN5 | GSM4909313 | Human | Breast | IDC | 1.14e-06 | -6.91e-02 | 0.0391 |
| 5204 | PFDN5 | GSM4909315 | Human | Breast | IDC | 5.93e-23 | 2.15e-01 | 0.21 |
| 5204 | PFDN5 | GSM4909316 | Human | Breast | IDC | 4.19e-11 | 1.15e-01 | 0.21 |
| 5204 | PFDN5 | GSM4909319 | Human | Breast | IDC | 2.29e-72 | -7.13e-01 | 0.1563 |
| 5204 | PFDN5 | GSM4909320 | Human | Breast | IDC | 3.57e-05 | -3.16e-01 | 0.1575 |
| 5204 | PFDN5 | GSM4909321 | Human | Breast | IDC | 4.02e-07 | -1.02e-01 | 0.1559 |
| 5204 | PFDN5 | brca1 | Human | Breast | Precancer | 4.22e-02 | -1.11e-01 | -0.0338 |
| 5204 | PFDN5 | brca2 | Human | Breast | Precancer | 1.82e-07 | -1.26e-01 | -0.024 |
| Page: 1 2 3 4 5 6 7 8 9 10 11 12 13 14 15 16 |
| Tissue | Expression Dynamics | Abbreviation |
| Breast |  | IDC: Invasive ductal carcinoma |
| DCIS: Ductal carcinoma in situ | ||
| Precancer(BRCA1-mut): Precancerous lesion from BRCA1 mutation carriers | ||
| Cervix | 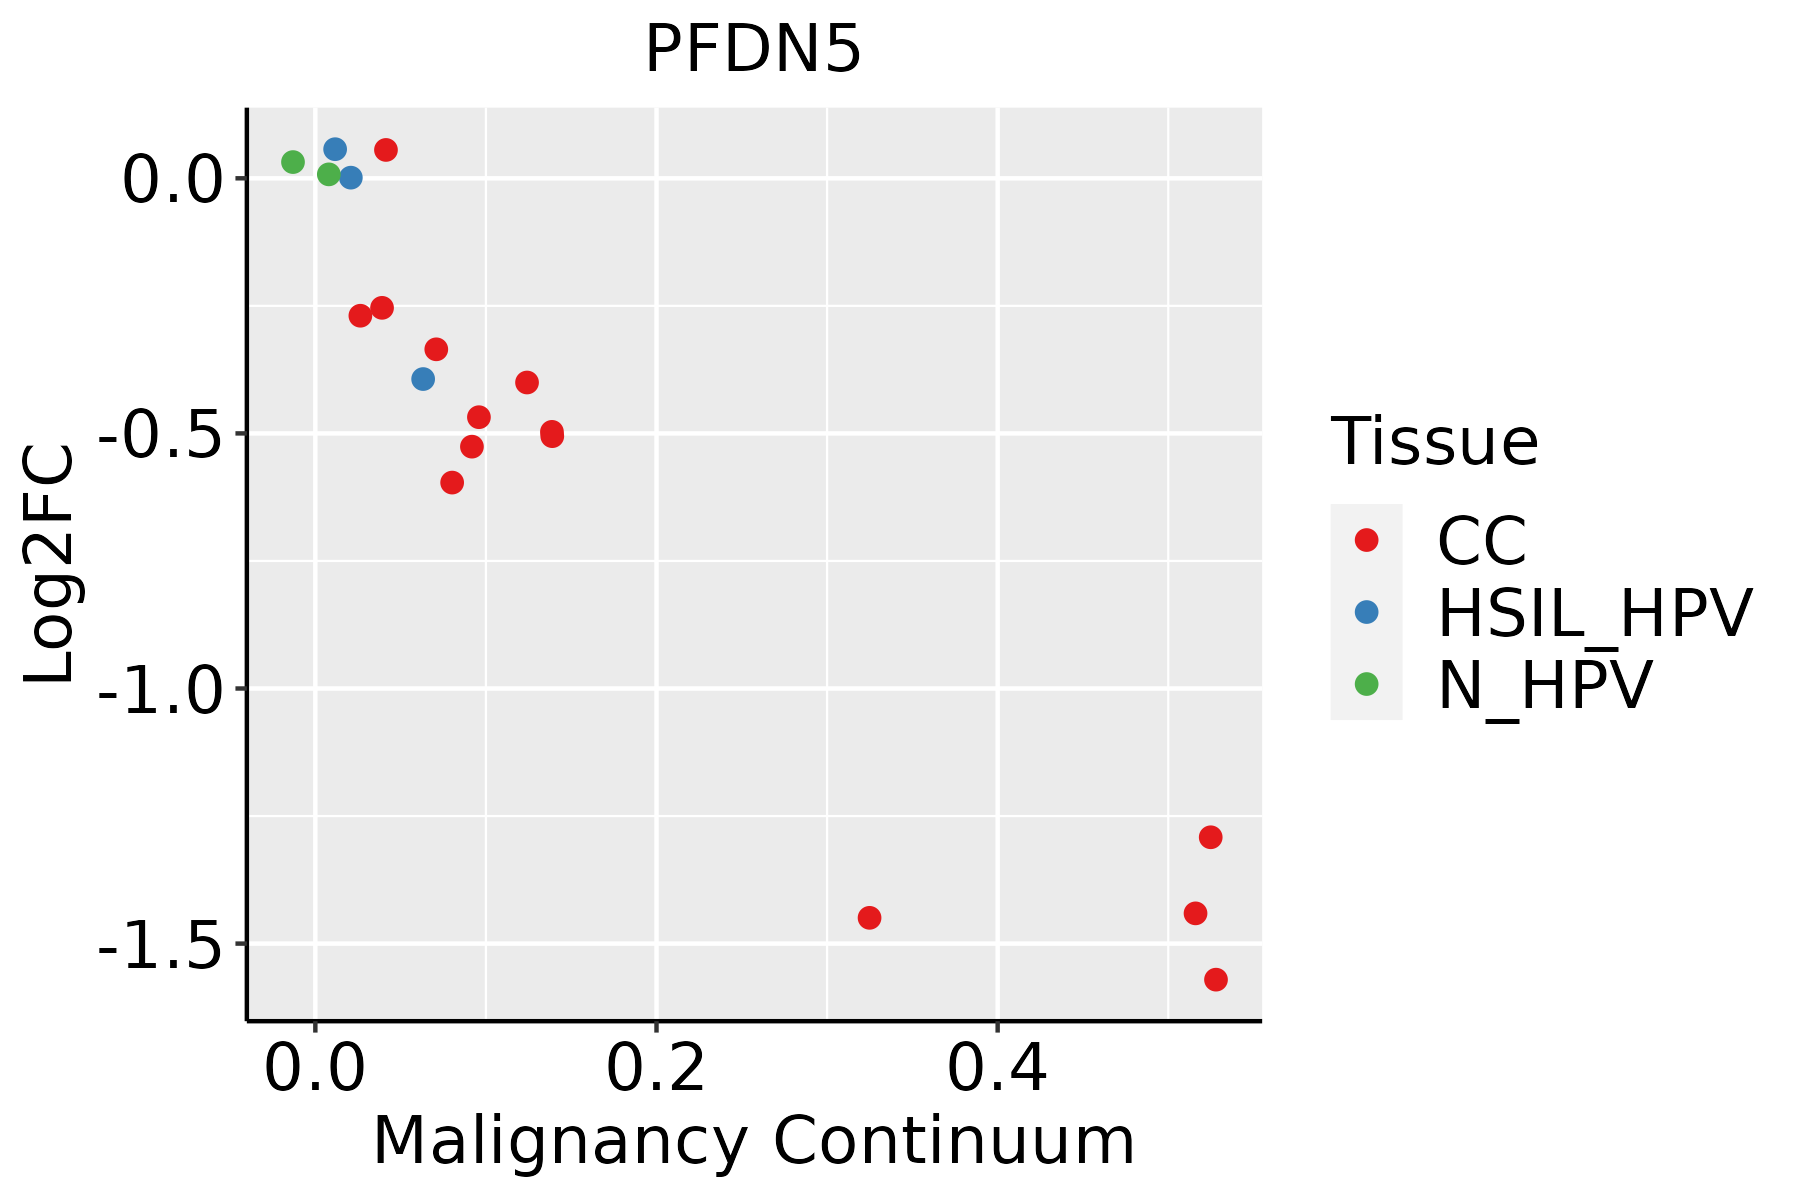 | CC: Cervix cancer |
| HSIL_HPV: HPV-infected high-grade squamous intraepithelial lesions | ||
| N_HPV: HPV-infected normal cervix | ||
| Colorectum (GSE201348) |  | FAP: Familial adenomatous polyposis |
| CRC: Colorectal cancer | ||
| Colorectum (HTA11) |  | AD: Adenomas |
| SER: Sessile serrated lesions | ||
| MSI-H: Microsatellite-high colorectal cancer | ||
| MSS: Microsatellite stable colorectal cancer | ||
| Endometrium | 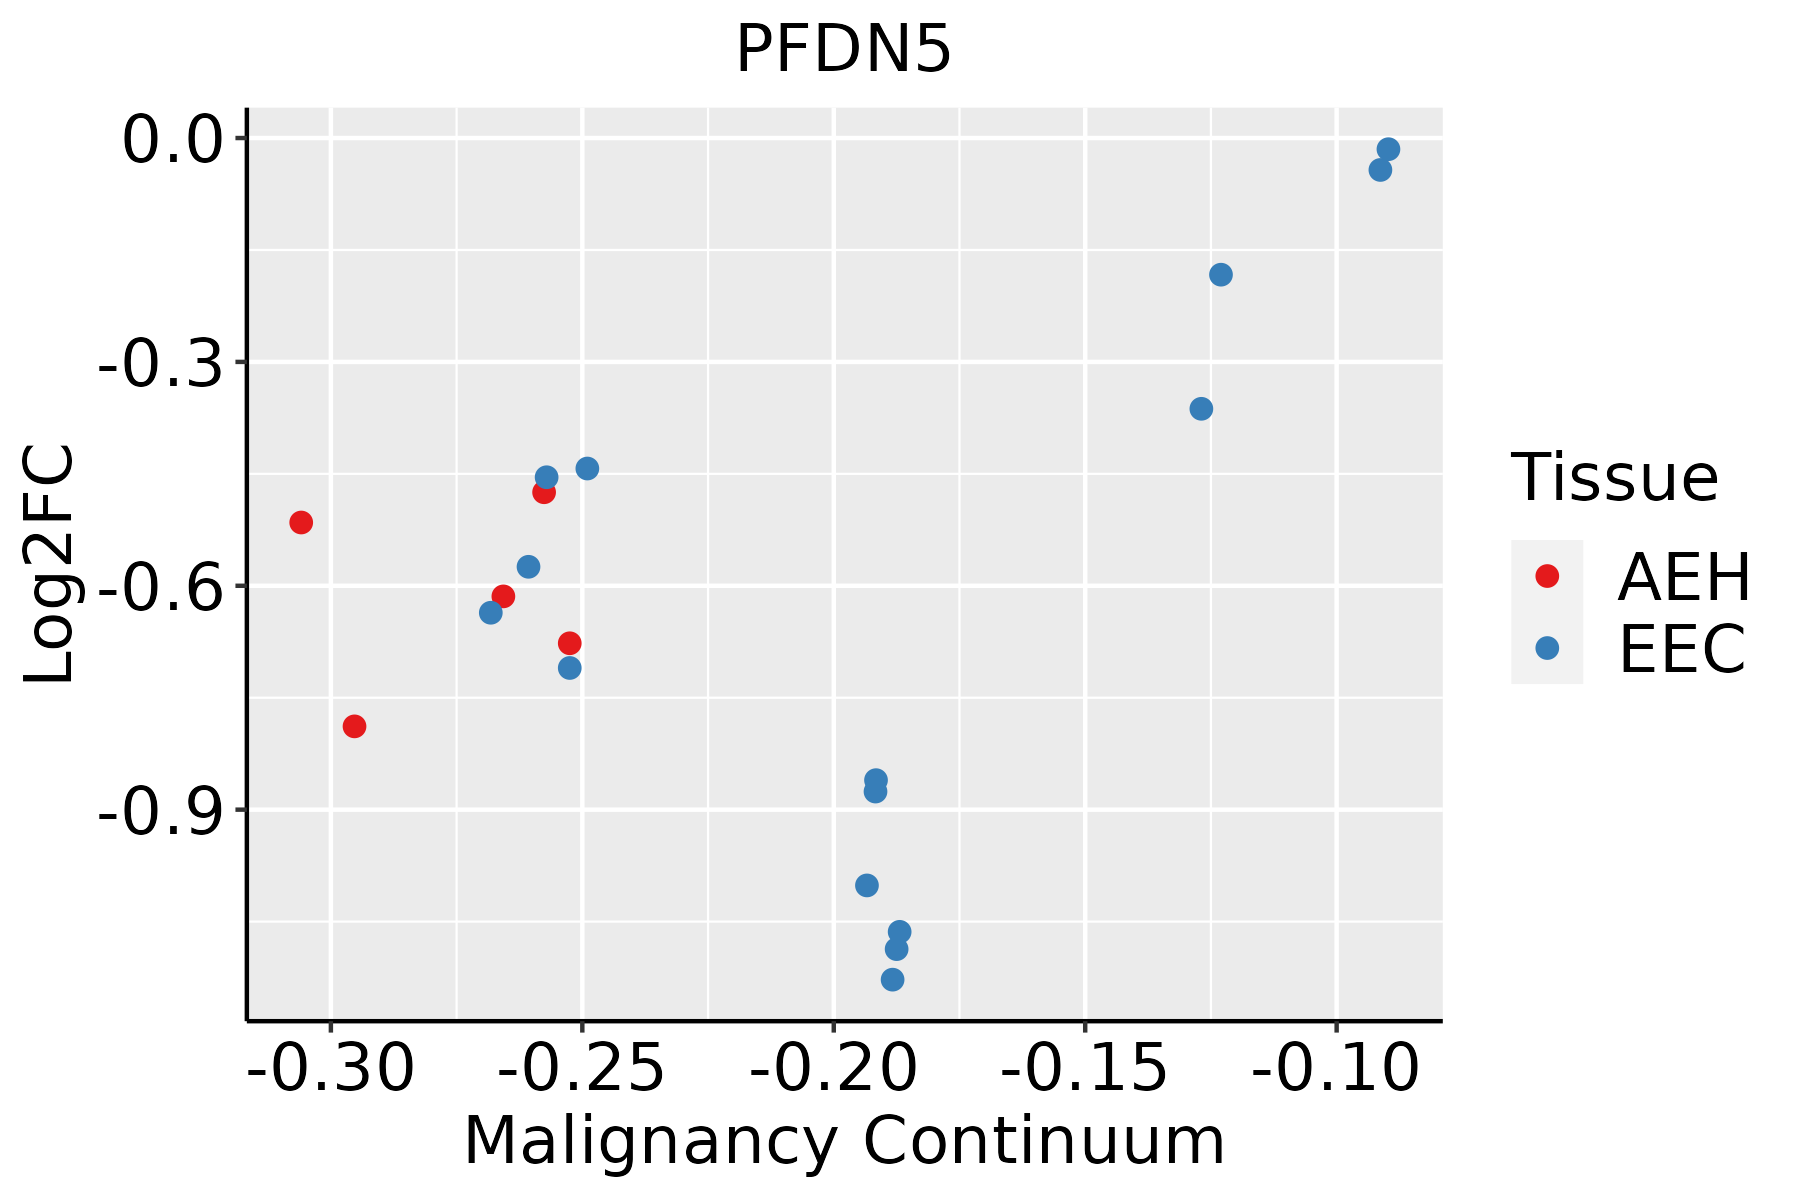 | AEH: Atypical endometrial hyperplasia |
| EEC: Endometrioid Cancer | ||
| Esophagus | 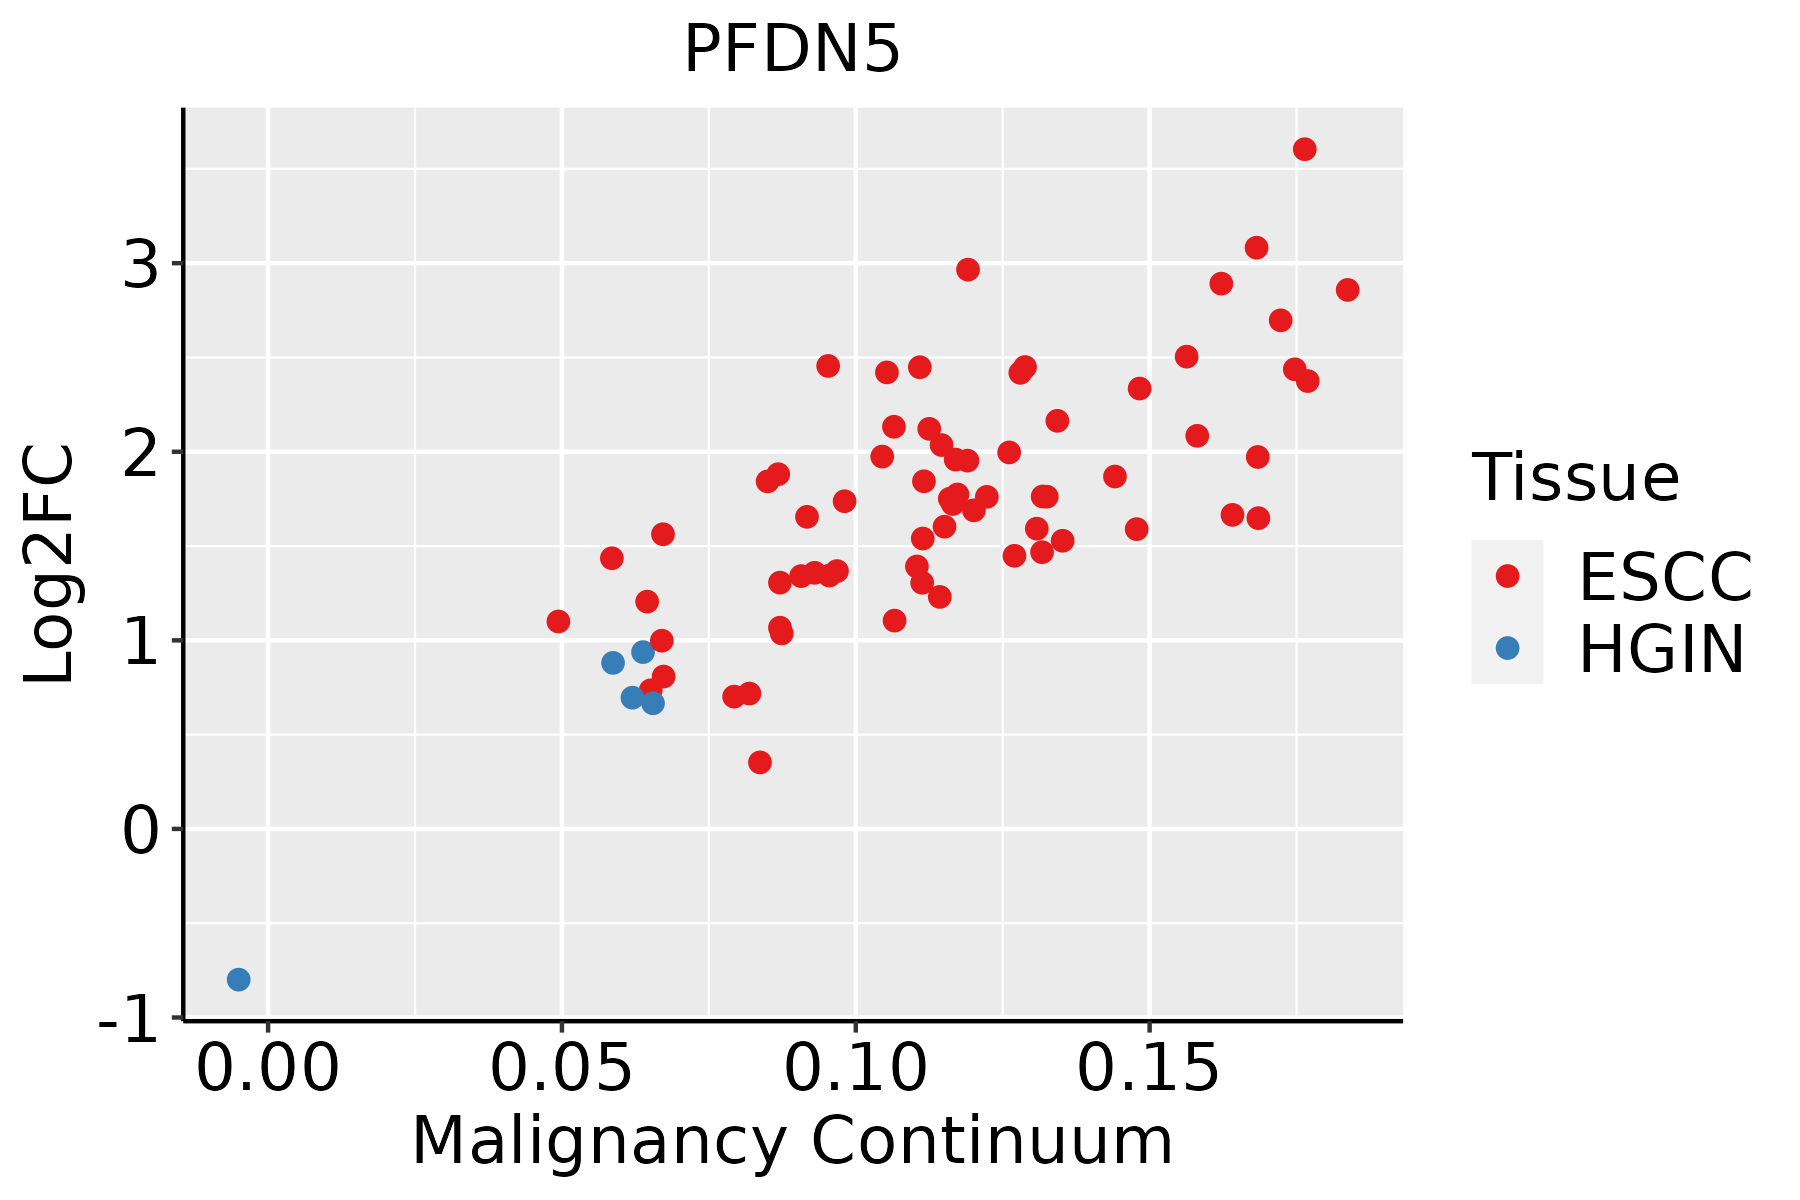 | ESCC: Esophageal squamous cell carcinoma |
| HGIN: High-grade intraepithelial neoplasias | ||
| LGIN: Low-grade intraepithelial neoplasias | ||
| Liver | 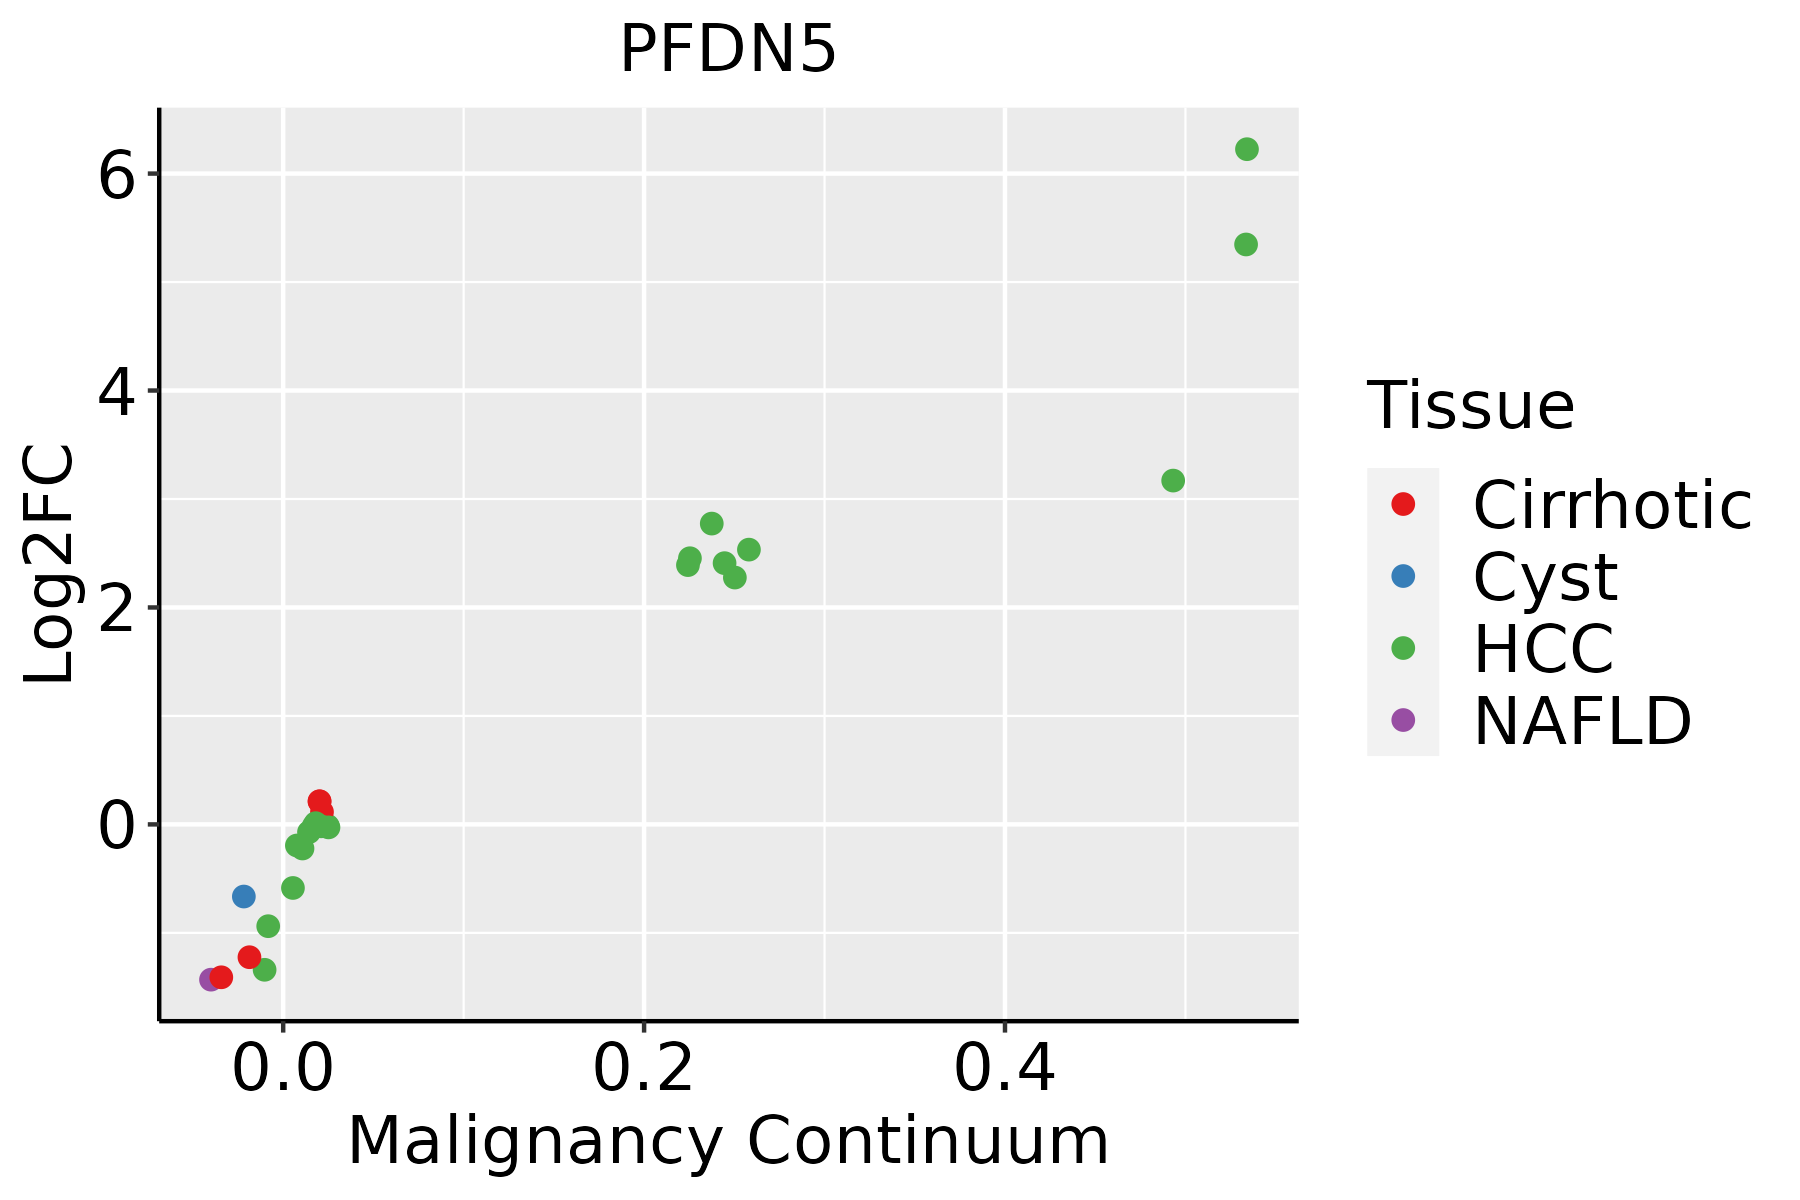 | HCC: Hepatocellular carcinoma |
| NAFLD: Non-alcoholic fatty liver disease | ||
| Lung |  | AAH: Atypical adenomatous hyperplasia |
| AIS: Adenocarcinoma in situ | ||
| IAC: Invasive lung adenocarcinoma | ||
| MIA: Minimally invasive adenocarcinoma | ||
| Oral Cavity |  | EOLP: Erosive Oral lichen planus |
| LP: leukoplakia | ||
| NEOLP: Non-erosive oral lichen planus | ||
| OSCC: Oral squamous cell carcinoma | ||
| Prostate | 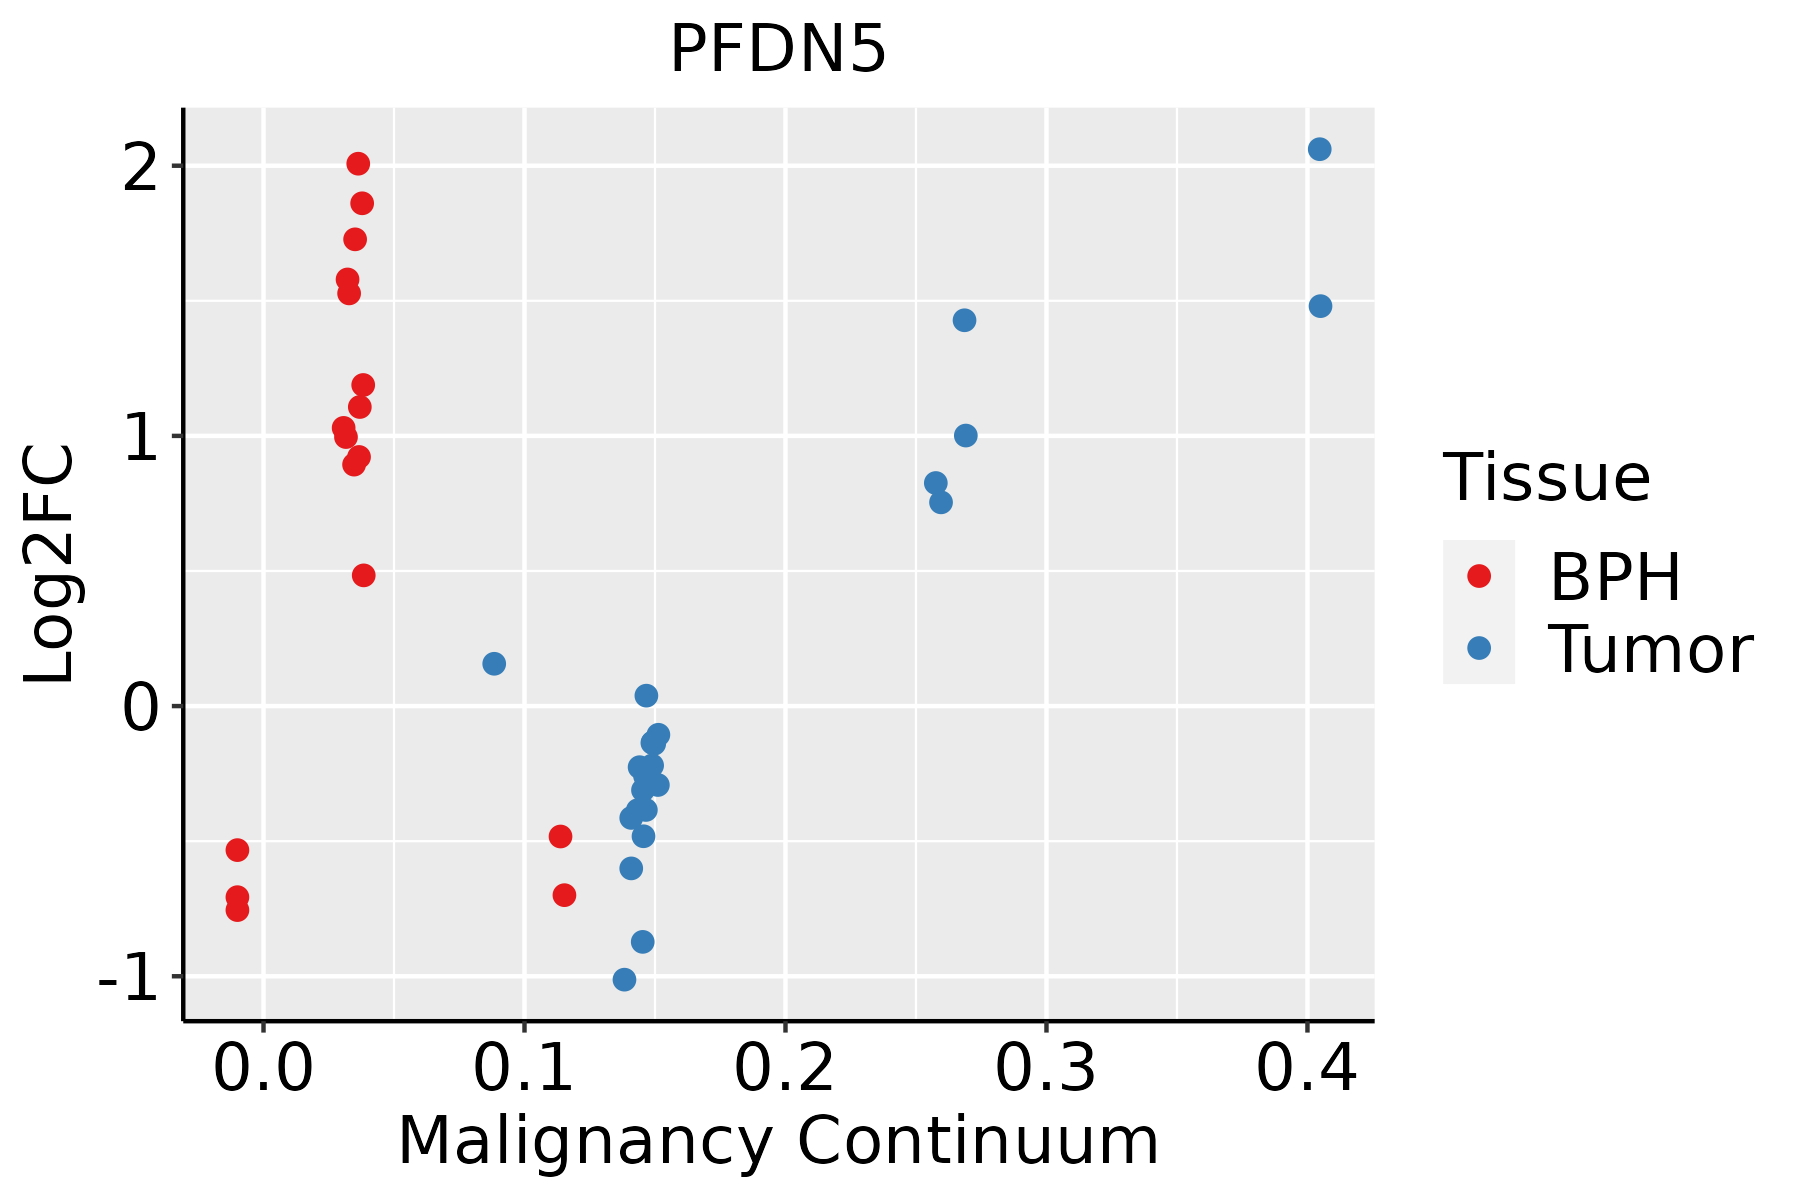 | BPH: Benign Prostatic Hyperplasia |
| Skin | 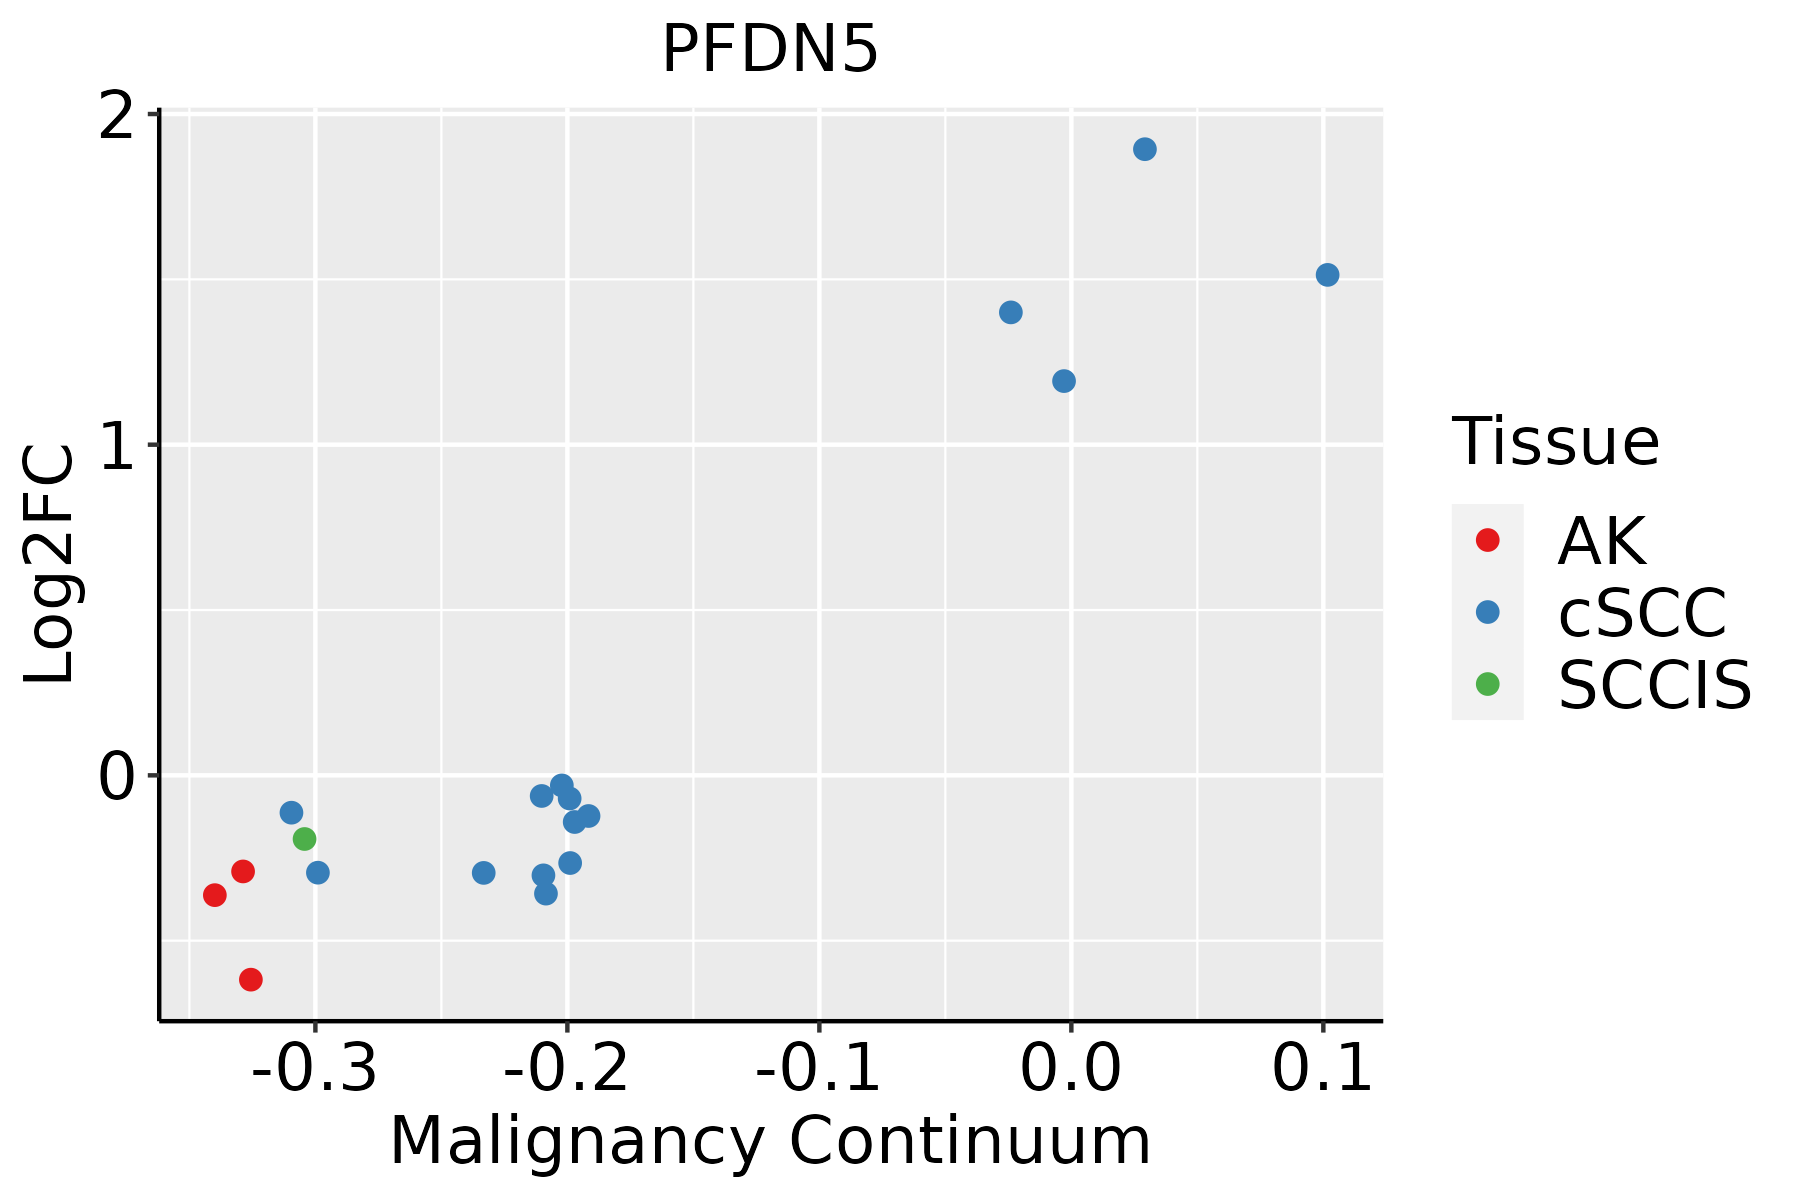 | AK: Actinic keratosis |
| cSCC: Cutaneous squamous cell carcinoma | ||
| SCCIS:squamous cell carcinoma in situ | ||
| Thyroid | 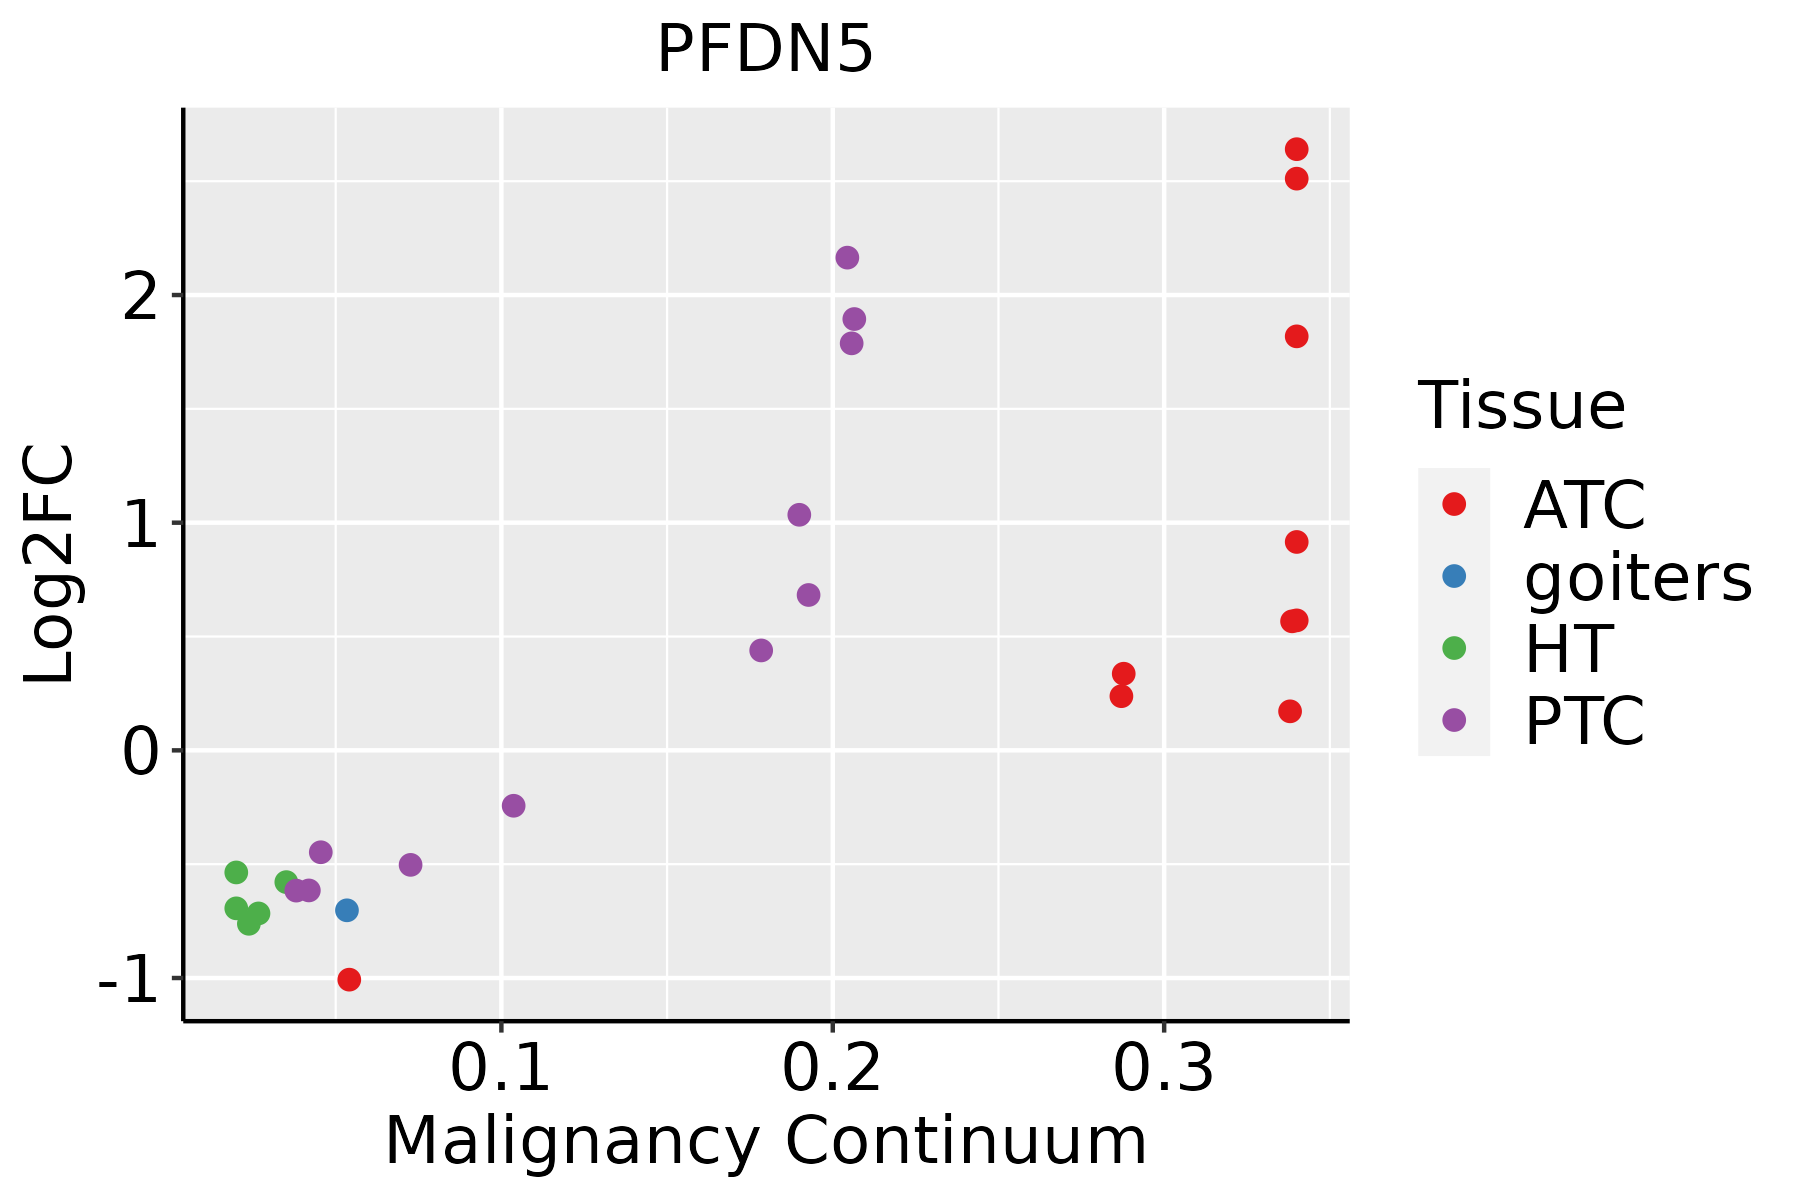 | ATC: Anaplastic thyroid cancer |
| HT: Hashimoto's thyroiditis | ||
| PTC: Papillary thyroid cancer |
| ∗log2FC in expression of this searched gene in stem-like cells from each diseased tissue sample relative to stem-like cells in normal samples in each tissue plotted against the malignancy continuum. Samples are colored based on if they are from different disease stage. |
Top |
Malignant transformation related pathway analysis |
| Find out the enriched GO biological processes and KEGG pathways involved in transition from healthy to precancer to cancer |
| Tissue | Disease Stage | Enriched GO biological Processes |
| Colorectum | AD |  |
| Colorectum | SER |  |
| Colorectum | MSS |  |
| Colorectum | MSI-H |  |
| Colorectum | FAP |  |
| ∗Top 15 enriched GO BP terms are showed in the bar plot of each disease state in each tissue. Each row represents a significant GO biological process which is colored according to the -log10(p.adjust). |
| Page: 1 2 3 4 5 6 7 8 9 |
| GO ID | Tissue | Disease Stage | Description | Gene Ratio | Bg Ratio | pvalue | p.adjust | Count |
| GO:006007014 | Prostate | Tumor | canonical Wnt signaling pathway | 87/3246 | 303/18723 | 5.49e-07 | 1.17e-05 | 87 |
| GO:190290416 | Prostate | Tumor | negative regulation of supramolecular fiber organization | 54/3246 | 167/18723 | 1.64e-06 | 2.90e-05 | 54 |
| GO:190590614 | Prostate | Tumor | regulation of amyloid fibril formation | 10/3246 | 16/18723 | 6.99e-05 | 7.41e-04 | 10 |
| GO:190590714 | Prostate | Tumor | negative regulation of amyloid fibril formation | 8/3246 | 13/18723 | 4.54e-04 | 3.43e-03 | 8 |
| GO:199000015 | Prostate | Tumor | amyloid fibril formation | 14/3246 | 34/18723 | 9.26e-04 | 6.10e-03 | 14 |
| GO:003017813 | Prostate | Tumor | negative regulation of Wnt signaling pathway | 46/3246 | 170/18723 | 9.84e-04 | 6.37e-03 | 46 |
| GO:009009012 | Prostate | Tumor | negative regulation of canonical Wnt signaling pathway | 38/3246 | 137/18723 | 1.60e-03 | 9.71e-03 | 38 |
| GO:00016541 | Prostate | Tumor | eye development | 82/3246 | 371/18723 | 1.02e-02 | 4.27e-02 | 82 |
| GO:001605518 | Skin | AK | Wnt signaling pathway | 98/1910 | 444/18723 | 9.39e-14 | 3.09e-11 | 98 |
| GO:019873818 | Skin | AK | cell-cell signaling by wnt | 98/1910 | 446/18723 | 1.26e-13 | 3.72e-11 | 98 |
| GO:003011118 | Skin | AK | regulation of Wnt signaling pathway | 73/1910 | 328/18723 | 9.27e-11 | 1.52e-08 | 73 |
| GO:006007017 | Skin | AK | canonical Wnt signaling pathway | 67/1910 | 303/18723 | 7.30e-10 | 7.45e-08 | 67 |
| GO:006082818 | Skin | AK | regulation of canonical Wnt signaling pathway | 57/1910 | 253/18723 | 6.57e-09 | 4.47e-07 | 57 |
| GO:190290328 | Skin | AK | regulation of supramolecular fiber organization | 75/1910 | 383/18723 | 2.11e-08 | 1.20e-06 | 75 |
| GO:000645726 | Skin | AK | protein folding | 44/1910 | 212/18723 | 3.54e-06 | 8.91e-05 | 44 |
| GO:190290419 | Skin | AK | negative regulation of supramolecular fiber organization | 35/1910 | 167/18723 | 2.73e-05 | 4.77e-04 | 35 |
| GO:00900906 | Skin | AK | negative regulation of canonical Wnt signaling pathway | 29/1910 | 137/18723 | 1.07e-04 | 1.39e-03 | 29 |
| GO:00301789 | Skin | AK | negative regulation of Wnt signaling pathway | 33/1910 | 170/18723 | 2.14e-04 | 2.39e-03 | 33 |
| GO:199000017 | Skin | AK | amyloid fibril formation | 11/1910 | 34/18723 | 3.75e-04 | 3.63e-03 | 11 |
| GO:19059069 | Skin | AK | regulation of amyloid fibril formation | 7/1910 | 16/18723 | 5.66e-04 | 5.06e-03 | 7 |
| Page: 1 2 3 4 5 6 7 8 9 10 11 12 13 14 15 16 17 |
| Pathway ID | Tissue | Disease Stage | Description | Gene Ratio | Bg Ratio | pvalue | p.adjust | qvalue | Count |
| Page: 1 |
Top |
Cell-cell communication analysis |
| Identification of potential cell-cell interactions between two cell types and their ligand-receptor pairs for different disease states |
| Ligand | Receptor | LRpair | Pathway | Tissue | Disease Stage |
| Page: 1 |
Top |
Single-cell gene regulatory network inference analysis |
| Find out the significant the regulons (TFs) and the target genes of each regulon across cell types for different disease states |
| TF | Cell Type | Tissue | Disease Stage | Target Gene | RSS | Regulon Activity |
| ∗The dot plots of a searched regulon are shown for all cell subpopulations in each disease state of each tissue based on the regulon specific score inferred using pySCENIC and by calculating the average expression. |
| Page: 1 |
Top |
Somatic mutation of malignant transformation related genes |
| Annotation of somatic variants for genes involved in malignant transformation |
| Hugo Symbol | Variant Class | Variant Classification | dbSNP RS | HGVSc | HGVSp | HGVSp Short | SWISSPROT | BIOTYPE | SIFT | PolyPhen | Tumor Sample Barcode | Tissue | Histology | Sex | Age | Stage | Therapy Types | Drugs | Outcome |
| PFDN5 | SNV | Missense_Mutation | rs201325659 | c.172G>A | p.Glu58Lys | p.E58K | Q99471 | protein_coding | tolerated(0.39) | benign(0.017) | TCGA-FU-A3WB-01 | Cervix | cervical & endocervical cancer | Female | <65 | I/II | Chemotherapy | cisplatin | CR |
| PFDN5 | SNV | Missense_Mutation | novel | c.289G>A | p.Glu97Lys | p.E97K | Q99471 | protein_coding | tolerated(0.31) | benign(0.029) | TCGA-ZJ-A8QR-01 | Cervix | cervical & endocervical cancer | Female | <65 | I/II | Unknown | Unknown | SD |
| PFDN5 | SNV | Missense_Mutation | rs781446753 | c.250N>G | p.Ile84Val | p.I84V | Q99471 | protein_coding | tolerated(0.53) | benign(0.025) | TCGA-AA-3715-01 | Colorectum | colon adenocarcinoma | Male | >=65 | I/II | Unknown | Unknown | PD |
| PFDN5 | SNV | Missense_Mutation | novel | c.300G>T | p.Lys100Asn | p.K100N | Q99471 | protein_coding | deleterious(0.01) | possibly_damaging(0.857) | TCGA-A5-A0G2-01 | Endometrium | uterine corpus endometrioid carcinoma | Female | <65 | III/IV | Unknown | Unknown | SD |
| PFDN5 | SNV | Missense_Mutation | novel | c.253N>A | p.Asp85Asn | p.D85N | Q99471 | protein_coding | deleterious(0.02) | benign(0.362) | TCGA-D1-A17Q-01 | Endometrium | uterine corpus endometrioid carcinoma | Female | <65 | I/II | Unknown | Unknown | SD |
| PFDN5 | SNV | Missense_Mutation | novel | c.268N>C | p.Tyr90His | p.Y90H | Q99471 | protein_coding | deleterious(0) | probably_damaging(1) | TCGA-EO-A3AU-01 | Endometrium | uterine corpus endometrioid carcinoma | Female | >=65 | I/II | Unknown | Unknown | PD |
| PFDN5 | SNV | Missense_Mutation | c.35N>A | p.Leu12Gln | p.L12Q | Q99471 | protein_coding | deleterious(0) | probably_damaging(0.915) | TCGA-DD-AAW0-01 | Liver | liver hepatocellular carcinoma | Male | <65 | I/II | Unknown | Unknown | SD | |
| PFDN5 | SNV | Missense_Mutation | rs146649111 | c.361N>T | p.Leu121Phe | p.L121F | Q99471 | protein_coding | tolerated(0.18) | probably_damaging(0.987) | TCGA-05-4420-01 | Lung | lung adenocarcinoma | Male | <65 | I/II | Unknown | Unknown | SD |
| PFDN5 | SNV | Missense_Mutation | rs746188581 | c.161N>G | p.Asn54Ser | p.N54S | Q99471 | protein_coding | tolerated(0.47) | benign(0.055) | TCGA-55-8096-01 | Lung | lung adenocarcinoma | Female | >=65 | I/II | Unknown | Unknown | PD |
| PFDN5 | SNV | Missense_Mutation | novel | c.175N>T | p.Gly59Trp | p.G59W | Q99471 | protein_coding | deleterious(0) | probably_damaging(1) | TCGA-37-4130-01 | Lung | lung squamous cell carcinoma | Male | <65 | I/II | Unknown | Unknown | SD |
| Page: 1 2 |
Top |
Related drugs of malignant transformation related genes |
| Identification of chemicals and drugs interact with genes involved in malignant transfromation |
| (DGIdb 4.0) |
| Entrez ID | Symbol | Category | Interaction Types | Drug Claim Name | Drug Name | PMIDs |
| Page: 1 |

Copyright 2023-Present -The University of Texas Health Science Center at Houston |