
|
|||||
|
 | |
| |
| |
| |
| |
| |
|
Gene: MYB |
Gene summary for MYB |
| Gene information | Species | Human | Gene symbol | MYB | Gene ID | 4602 |
| Gene name | MYB proto-oncogene, transcription factor | |
| Gene Alias | Cmyb | |
| Cytomap | 6q23.3 | |
| Gene Type | protein-coding | GO ID | GO:0000122 | UniProtAcc | P10242 |
Top |
Malignant transformation analysis |
| Identification of the aberrant gene expression in precancerous and cancerous lesions by comparing the gene expression of stem-like cells in diseased tissues with normal stem cells |
| Entrez ID | Symbol | Replicates | Species | Organ | Tissue | Adj P-value | Log2FC | Malignancy |
| 4602 | MYB | HTA11_3410_2000001011 | Human | Colorectum | AD | 1.28e-12 | -4.18e-01 | 0.0155 |
| 4602 | MYB | HTA11_2487_2000001011 | Human | Colorectum | SER | 5.82e-04 | -4.60e-01 | -0.1808 |
| 4602 | MYB | HTA11_3361_2000001011 | Human | Colorectum | AD | 5.87e-05 | -5.25e-01 | -0.1207 |
| 4602 | MYB | HTA11_7696_3000711011 | Human | Colorectum | AD | 4.52e-03 | -3.00e-01 | 0.0674 |
| 4602 | MYB | HTA11_99999974143_84620 | Human | Colorectum | MSS | 1.87e-27 | -6.64e-01 | 0.3005 |
| 4602 | MYB | F007 | Human | Colorectum | FAP | 3.46e-04 | -3.43e-01 | 0.1176 |
| 4602 | MYB | A001-C-207 | Human | Colorectum | FAP | 3.60e-05 | -3.00e-01 | 0.1278 |
| 4602 | MYB | A015-C-203 | Human | Colorectum | FAP | 3.78e-28 | -3.53e-01 | -0.1294 |
| 4602 | MYB | A015-C-204 | Human | Colorectum | FAP | 3.61e-06 | -3.38e-01 | -0.0228 |
| 4602 | MYB | A014-C-040 | Human | Colorectum | FAP | 1.96e-03 | -3.15e-01 | -0.1184 |
| 4602 | MYB | A002-C-201 | Human | Colorectum | FAP | 1.45e-13 | -3.14e-01 | 0.0324 |
| 4602 | MYB | A002-C-203 | Human | Colorectum | FAP | 3.70e-07 | -2.86e-01 | 0.2786 |
| 4602 | MYB | A001-C-119 | Human | Colorectum | FAP | 1.38e-06 | -3.48e-01 | -0.1557 |
| 4602 | MYB | A001-C-108 | Human | Colorectum | FAP | 1.36e-17 | -3.39e-01 | -0.0272 |
| 4602 | MYB | A002-C-205 | Human | Colorectum | FAP | 4.88e-20 | -3.57e-01 | -0.1236 |
| 4602 | MYB | A001-C-104 | Human | Colorectum | FAP | 2.71e-08 | -2.79e-01 | 0.0184 |
| 4602 | MYB | A015-C-005 | Human | Colorectum | FAP | 9.20e-03 | -1.67e-01 | -0.0336 |
| 4602 | MYB | A015-C-006 | Human | Colorectum | FAP | 2.37e-16 | -4.75e-01 | -0.0994 |
| 4602 | MYB | A015-C-106 | Human | Colorectum | FAP | 4.39e-10 | -1.41e-01 | -0.0511 |
| 4602 | MYB | A002-C-114 | Human | Colorectum | FAP | 2.27e-17 | -3.41e-01 | -0.1561 |
| Page: 1 2 |
| Tissue | Expression Dynamics | Abbreviation |
| Colorectum (GSE201348) |  | FAP: Familial adenomatous polyposis |
| CRC: Colorectal cancer | ||
| Colorectum (HTA11) |  | AD: Adenomas |
| SER: Sessile serrated lesions | ||
| MSI-H: Microsatellite-high colorectal cancer | ||
| MSS: Microsatellite stable colorectal cancer | ||
| Esophagus | 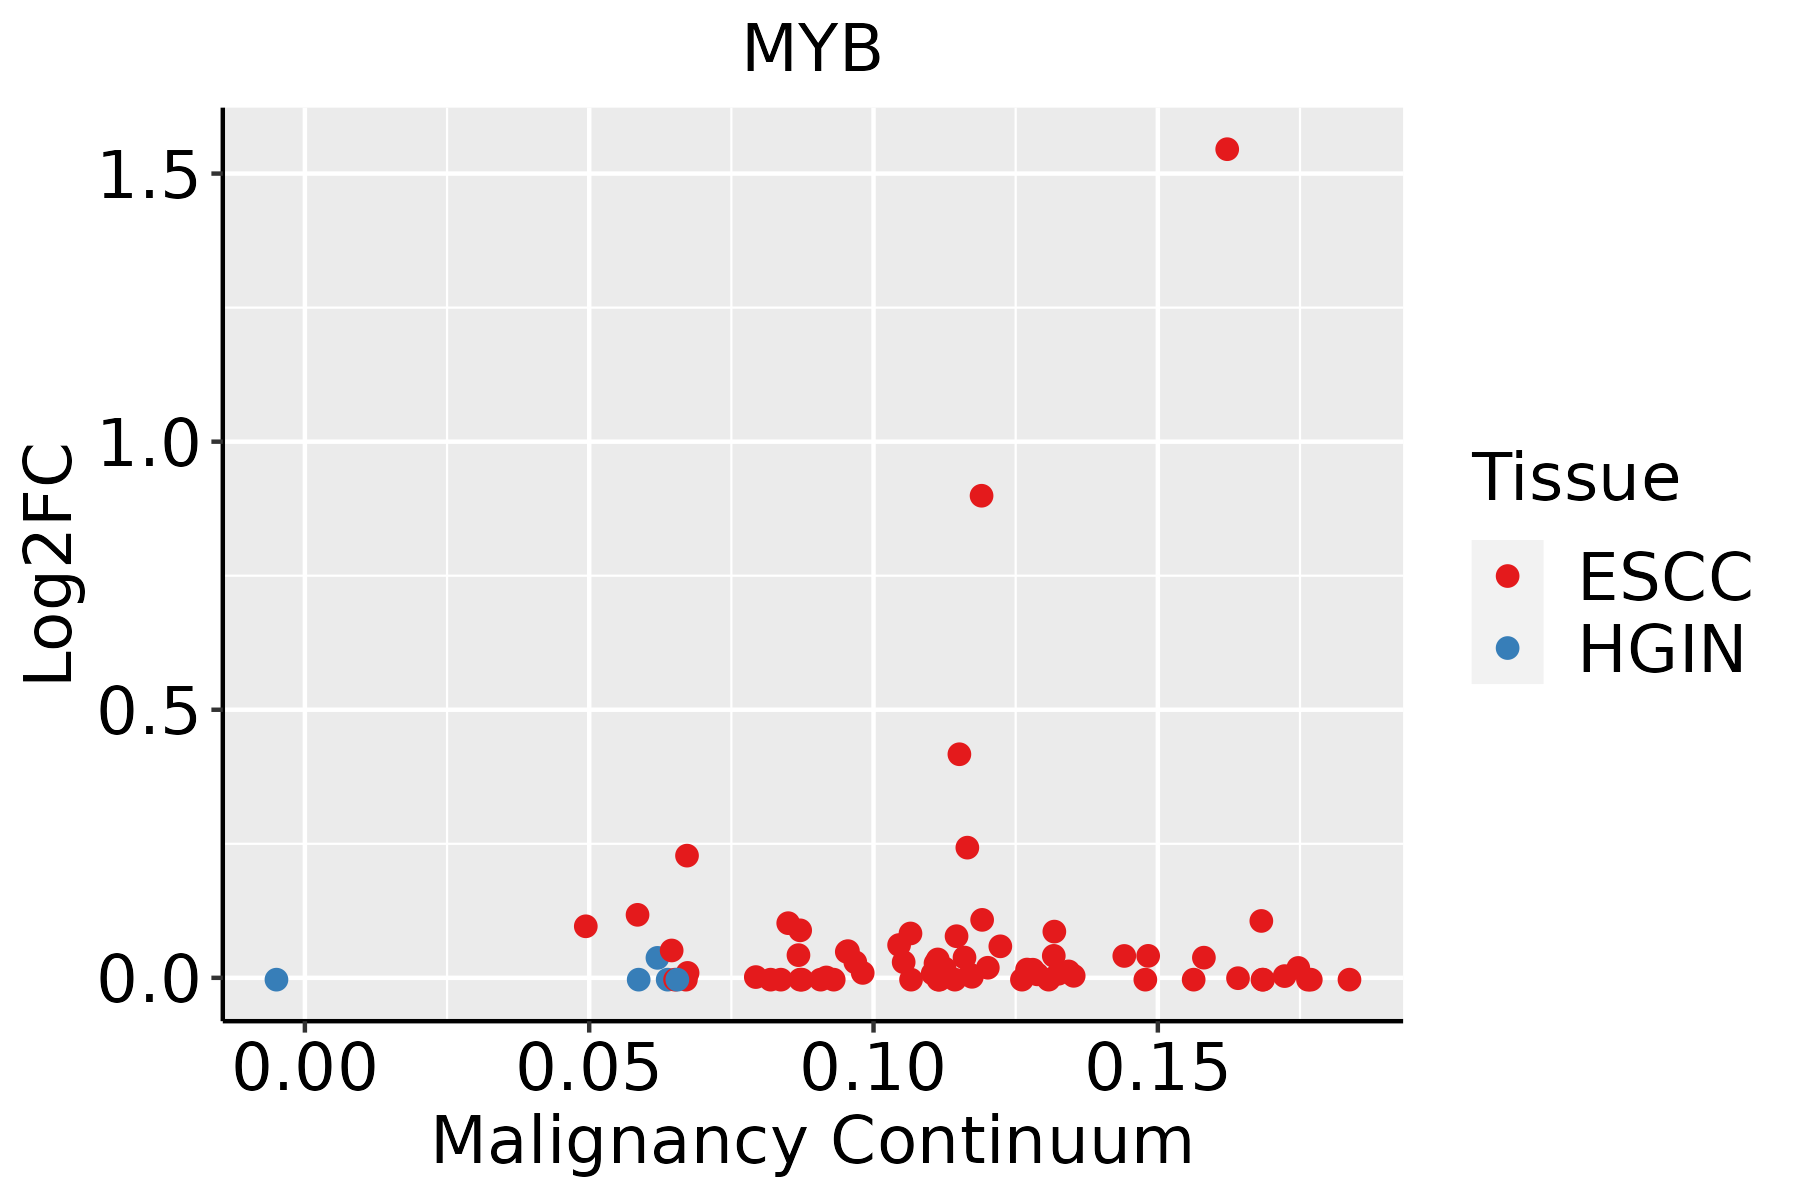 | ESCC: Esophageal squamous cell carcinoma |
| HGIN: High-grade intraepithelial neoplasias | ||
| LGIN: Low-grade intraepithelial neoplasias |
| ∗log2FC in expression of this searched gene in stem-like cells from each diseased tissue sample relative to stem-like cells in normal samples in each tissue plotted against the malignancy continuum. Samples are colored based on if they are from different disease stage. |
Top |
Malignant transformation related pathway analysis |
| Find out the enriched GO biological processes and KEGG pathways involved in transition from healthy to precancer to cancer |
| Tissue | Disease Stage | Enriched GO biological Processes |
| Colorectum | AD |  |
| Colorectum | SER |  |
| Colorectum | MSS |  |
| Colorectum | MSI-H |  |
| Colorectum | FAP |  |
| ∗Top 15 enriched GO BP terms are showed in the bar plot of each disease state in each tissue. Each row represents a significant GO biological process which is colored according to the -log10(p.adjust). |
| Page: 1 2 3 4 5 6 7 8 9 |
| GO ID | Tissue | Disease Stage | Description | Gene Ratio | Bg Ratio | pvalue | p.adjust | Count |
| GO:00486615 | Esophagus | ESCC | positive regulation of smooth muscle cell proliferation | 61/8552 | 104/18723 | 5.22e-03 | 1.97e-02 | 61 |
| GO:00140151 | Esophagus | ESCC | positive regulation of gliogenesis | 41/8552 | 66/18723 | 5.22e-03 | 1.97e-02 | 41 |
| GO:00022446 | Esophagus | ESCC | hematopoietic progenitor cell differentiation | 66/8552 | 114/18723 | 5.74e-03 | 2.13e-02 | 66 |
| GO:005087015 | Esophagus | ESCC | positive regulation of T cell activation | 117/8552 | 216/18723 | 7.23e-03 | 2.62e-02 | 117 |
| GO:00602521 | Esophagus | ESCC | positive regulation of glial cell proliferation | 15/8552 | 20/18723 | 7.60e-03 | 2.71e-02 | 15 |
| GO:00302176 | Esophagus | ESCC | T cell differentiation | 137/8552 | 257/18723 | 8.09e-03 | 2.87e-02 | 137 |
| GO:190303916 | Esophagus | ESCC | positive regulation of leukocyte cell-cell adhesion | 128/8552 | 239/18723 | 8.40e-03 | 2.96e-02 | 128 |
| GO:000715918 | Esophagus | ESCC | leukocyte cell-cell adhesion | 192/8552 | 371/18723 | 1.03e-02 | 3.51e-02 | 192 |
| GO:00140131 | Esophagus | ESCC | regulation of gliogenesis | 59/8552 | 103/18723 | 1.17e-02 | 3.91e-02 | 59 |
| GO:005157111 | Esophagus | ESCC | positive regulation of histone H3-K4 methylation | 14/8552 | 19/18723 | 1.27e-02 | 4.21e-02 | 14 |
| GO:190303717 | Esophagus | ESCC | regulation of leukocyte cell-cell adhesion | 174/8552 | 336/18723 | 1.36e-02 | 4.43e-02 | 174 |
| GO:00300984 | Esophagus | ESCC | lymphocyte differentiation | 192/8552 | 374/18723 | 1.52e-02 | 4.93e-02 | 192 |
| GO:002261322 | Liver | HCC | ribonucleoprotein complex biogenesis | 355/7958 | 463/18723 | 7.76e-52 | 4.92e-48 | 355 |
| GO:004225422 | Liver | HCC | ribosome biogenesis | 246/7958 | 299/18723 | 4.99e-46 | 1.58e-42 | 246 |
| GO:000609122 | Liver | HCC | generation of precursor metabolites and energy | 340/7958 | 490/18723 | 4.04e-34 | 2.85e-31 | 340 |
| GO:004533312 | Liver | HCC | cellular respiration | 171/7958 | 230/18723 | 6.35e-23 | 1.26e-20 | 171 |
| GO:001598022 | Liver | HCC | energy derivation by oxidation of organic compounds | 221/7958 | 318/18723 | 1.02e-22 | 1.86e-20 | 221 |
| GO:002290022 | Liver | HCC | electron transport chain | 134/7958 | 175/18723 | 3.32e-20 | 4.68e-18 | 134 |
| GO:002290412 | Liver | HCC | respiratory electron transport chain | 89/7958 | 114/18723 | 8.68e-15 | 5.73e-13 | 89 |
| GO:009719322 | Liver | HCC | intrinsic apoptotic signaling pathway | 184/7958 | 288/18723 | 1.50e-13 | 8.32e-12 | 184 |
| Page: 1 2 3 4 5 6 7 8 9 10 11 12 13 14 15 16 17 18 |
| Pathway ID | Tissue | Disease Stage | Description | Gene Ratio | Bg Ratio | pvalue | p.adjust | qvalue | Count |
| hsa04151 | Colorectum | FAP | PI3K-Akt signaling pathway | 75/1404 | 354/8465 | 1.23e-02 | 4.19e-02 | 2.55e-02 | 75 |
| hsa041511 | Colorectum | FAP | PI3K-Akt signaling pathway | 75/1404 | 354/8465 | 1.23e-02 | 4.19e-02 | 2.55e-02 | 75 |
| hsa041512 | Colorectum | CRC | PI3K-Akt signaling pathway | 64/1091 | 354/8465 | 2.70e-03 | 1.77e-02 | 1.20e-02 | 64 |
| hsa041513 | Colorectum | CRC | PI3K-Akt signaling pathway | 64/1091 | 354/8465 | 2.70e-03 | 1.77e-02 | 1.20e-02 | 64 |
| hsa041517 | Esophagus | ESCC | PI3K-Akt signaling pathway | 197/4205 | 354/8465 | 1.24e-02 | 2.83e-02 | 1.45e-02 | 197 |
| hsa0415114 | Esophagus | ESCC | PI3K-Akt signaling pathway | 197/4205 | 354/8465 | 1.24e-02 | 2.83e-02 | 1.45e-02 | 197 |
| Page: 1 |
Top |
Cell-cell communication analysis |
| Identification of potential cell-cell interactions between two cell types and their ligand-receptor pairs for different disease states |
| Ligand | Receptor | LRpair | Pathway | Tissue | Disease Stage |
| Page: 1 |
Top |
Single-cell gene regulatory network inference analysis |
| Find out the significant the regulons (TFs) and the target genes of each regulon across cell types for different disease states |
| TF | Cell Type | Tissue | Disease Stage | Target Gene | RSS | Regulon Activity |
| MYB | STM | Breast | Healthy | ANKRD30A,ESR1,SGK3, etc. | 1.11e-01 |  |
| MYB | MAST | Breast | IDC | NUCB2,SLC39A6,VWA5A, etc. | 5.30e-02 |  |
| MYB | CT | Colorectum | FAP | LRGUK,XACT,NINL, etc. | 4.62e-03 |  |
| MYB | SSC | Colorectum | FAP | LRGUK,XACT,NINL, etc. | 3.38e-04 | |
| MYB | ASC | Colorectum | SER | NREP,APCDD1,FOXA1, etc. | 1.08e-01 |  |
| MYB | MAST | Colorectum | AD | MAOA,ZNF704,PAM, etc. | 2.48e-01 |  |
| MYB | TREG | Colorectum | ADJ | MAOA,ZNF704,PAM, etc. | 1.29e-01 |  |
| MYB | MAST | Colorectum | ADJ | MAOA,ZNF704,PAM, etc. | 9.16e-02 | |
| MYB | TREG | Colorectum | FAP | MAOA,ZNF704,PAM, etc. | 1.08e-01 | |
| MYB | MAST | Colorectum | MSI-H | MAOA,ZNF704,PAM, etc. | 6.24e-02 |  |
| ∗The dot plots of a searched regulon are shown for all cell subpopulations in each disease state of each tissue based on the regulon specific score inferred using pySCENIC and by calculating the average expression. |
| Page: 1 2 |
Top |
Somatic mutation of malignant transformation related genes |
| Annotation of somatic variants for genes involved in malignant transformation |
| Hugo Symbol | Variant Class | Variant Classification | dbSNP RS | HGVSc | HGVSp | HGVSp Short | SWISSPROT | BIOTYPE | SIFT | PolyPhen | Tumor Sample Barcode | Tissue | Histology | Sex | Age | Stage | Therapy Types | Drugs | Outcome |
| MYB | SNV | Missense_Mutation | c.308N>C | p.Val103Ala | p.V103A | P10242 | protein_coding | deleterious(0.02) | probably_damaging(0.965) | TCGA-A2-A1FZ-01 | Breast | breast invasive carcinoma | Female | <65 | I/II | Unspecific | Arimidex | SD | |
| MYB | SNV | Missense_Mutation | c.916N>A | p.Glu306Lys | p.E306K | P10242 | protein_coding | deleterious(0) | probably_damaging(0.996) | TCGA-A8-A095-01 | Breast | breast invasive carcinoma | Female | <65 | I/II | Chemotherapy | 5-fluorouracil | CR | |
| MYB | SNV | Missense_Mutation | c.1575C>G | p.Asn525Lys | p.N525K | P10242 | protein_coding | deleterious(0) | probably_damaging(0.997) | TCGA-B6-A0RE-01 | Breast | breast invasive carcinoma | Female | <65 | I/II | Unknown | Unknown | SD | |
| MYB | SNV | Missense_Mutation | c.403C>T | p.His135Tyr | p.H135Y | P10242 | protein_coding | deleterious(0) | benign(0.019) | TCGA-C8-A133-01 | Breast | breast invasive carcinoma | Female | >=65 | III/IV | Unknown | Unknown | SD | |
| MYB | SNV | Missense_Mutation | c.1570T>G | p.Leu524Val | p.L524V | P10242 | protein_coding | tolerated(0.05) | probably_damaging(0.995) | TCGA-D8-A142-01 | Breast | breast invasive carcinoma | Female | >=65 | I/II | Chemotherapy | cyclophosphamid | SD | |
| MYB | insertion | Frame_Shift_Ins | novel | c.281_282insT | p.Trp95LeufsTer37 | p.W95Lfs*37 | P10242 | protein_coding | TCGA-A2-A0ET-01 | Breast | breast invasive carcinoma | Female | <65 | III/IV | Chemotherapy | cytoxan | SD | ||
| MYB | deletion | Frame_Shift_Del | novel | c.1946_1947delNN | p.Gln649ArgfsTer7 | p.Q649Rfs*7 | P10242 | protein_coding | TCGA-A8-A09V-01 | Breast | breast invasive carcinoma | Female | <65 | I/II | Hormone Therapy | tamoxiphen | SD | ||
| MYB | insertion | Frame_Shift_Ins | novel | c.1243_1244insCAACCTCTAGCACTATTAAAAACAGGGTCTTGCA | p.Phe415SerfsTer13 | p.F415Sfs*13 | P10242 | protein_coding | TCGA-AO-A0JB-01 | Breast | breast invasive carcinoma | Female | <65 | III/IV | Chemotherapy | cyclophosphamide | SD | ||
| MYB | deletion | Frame_Shift_Del | c.1710delN | p.Phe571LeufsTer11 | p.F571Lfs*11 | P10242 | protein_coding | TCGA-BH-A0E7-01 | Breast | breast invasive carcinoma | Female | >=65 | I/II | Hormone Therapy | arimidex | SD | |||
| MYB | insertion | Frame_Shift_Ins | novel | c.418_419insCA | p.Glu141GlnfsTer81 | p.E141Qfs*81 | P10242 | protein_coding | TCGA-BH-A0HQ-01 | Breast | breast invasive carcinoma | Female | <65 | I/II | Hormone Therapy | arimidex | SD |
| Page: 1 2 3 4 5 6 7 8 9 |
Top |
Related drugs of malignant transformation related genes |
| Identification of chemicals and drugs interact with genes involved in malignant transfromation |
| (DGIdb 4.0) |
| Entrez ID | Symbol | Category | Interaction Types | Drug Claim Name | Drug Name | PMIDs |
| 4602 | MYB | CLINICALLY ACTIONABLE | RETINOID | 8670250 | ||
| 4602 | MYB | CLINICALLY ACTIONABLE | 12-O-TETRADECANOYLPHORBOL-13-ACETATE | 12354938 | ||
| 4602 | MYB | CLINICALLY ACTIONABLE | 5-FLUOROURACIL | FLUOROURACIL | 15001837 | |
| 4602 | MYB | CLINICALLY ACTIONABLE | DOXORUBICIN | DOXORUBICIN | 15001837 | |
| 4602 | MYB | CLINICALLY ACTIONABLE | G4460 | |||
| 4602 | MYB | CLINICALLY ACTIONABLE | TAXOL | PACLITAXEL | 15001837 |
| Page: 1 |

Copyright 2023-Present -The University of Texas Health Science Center at Houston |