
|
|||||
|
 | |
| |
| |
| |
| |
| |
|
Gene: MICALL2 |
Gene summary for MICALL2 |
| Gene information | Species | Human | Gene symbol | MICALL2 | Gene ID | 79778 |
| Gene name | MICAL like 2 | |
| Gene Alias | JRAB | |
| Cytomap | 7p22.3 | |
| Gene Type | protein-coding | GO ID | GO:0000902 | UniProtAcc | Q6UWK3 |
Top |
Malignant transformation analysis |
| Identification of the aberrant gene expression in precancerous and cancerous lesions by comparing the gene expression of stem-like cells in diseased tissues with normal stem cells |
| Entrez ID | Symbol | Replicates | Species | Organ | Tissue | Adj P-value | Log2FC | Malignancy |
| 79778 | MICALL2 | HTA11_2487_2000001011 | Human | Colorectum | SER | 4.79e-05 | 3.44e-01 | -0.1808 |
| 79778 | MICALL2 | HTA11_1938_2000001011 | Human | Colorectum | AD | 3.34e-02 | 2.09e-01 | -0.0811 |
| 79778 | MICALL2 | HTA11_78_2000001011 | Human | Colorectum | AD | 4.59e-02 | 2.22e-01 | -0.1088 |
| 79778 | MICALL2 | HTA11_347_2000001011 | Human | Colorectum | AD | 2.57e-10 | 3.31e-01 | -0.1954 |
| 79778 | MICALL2 | HTA11_411_2000001011 | Human | Colorectum | SER | 2.87e-10 | 8.42e-01 | -0.2602 |
| 79778 | MICALL2 | HTA11_696_2000001011 | Human | Colorectum | AD | 2.76e-04 | 3.85e-01 | -0.1464 |
| 79778 | MICALL2 | HTA11_1391_2000001011 | Human | Colorectum | AD | 8.82e-04 | 2.66e-01 | -0.059 |
| 79778 | MICALL2 | LZE4T | Human | Esophagus | ESCC | 1.89e-07 | 1.96e-01 | 0.0811 |
| 79778 | MICALL2 | LZE8T | Human | Esophagus | ESCC | 8.90e-03 | 1.41e-01 | 0.067 |
| 79778 | MICALL2 | LZE21D1 | Human | Esophagus | HGIN | 3.76e-02 | 2.02e-01 | 0.0632 |
| 79778 | MICALL2 | LZE22T | Human | Esophagus | ESCC | 1.23e-06 | 3.36e-01 | 0.068 |
| 79778 | MICALL2 | LZE24T | Human | Esophagus | ESCC | 7.78e-08 | 1.09e-01 | 0.0596 |
| 79778 | MICALL2 | LZE22D3 | Human | Esophagus | HGIN | 6.17e-04 | 5.59e-01 | 0.0653 |
| 79778 | MICALL2 | LZE21T | Human | Esophagus | ESCC | 1.17e-03 | 2.73e-01 | 0.0655 |
| 79778 | MICALL2 | P1T-E | Human | Esophagus | ESCC | 4.65e-14 | 7.62e-01 | 0.0875 |
| 79778 | MICALL2 | P2T-E | Human | Esophagus | ESCC | 7.75e-24 | 5.11e-01 | 0.1177 |
| 79778 | MICALL2 | P4T-E | Human | Esophagus | ESCC | 4.71e-07 | 1.90e-01 | 0.1323 |
| 79778 | MICALL2 | P5T-E | Human | Esophagus | ESCC | 3.50e-09 | 1.80e-01 | 0.1327 |
| 79778 | MICALL2 | P8T-E | Human | Esophagus | ESCC | 3.15e-35 | 6.27e-01 | 0.0889 |
| 79778 | MICALL2 | P9T-E | Human | Esophagus | ESCC | 9.56e-11 | 2.33e-01 | 0.1131 |
| Page: 1 2 3 4 5 6 7 |
| Tissue | Expression Dynamics | Abbreviation |
| Colorectum (GSE201348) |  | FAP: Familial adenomatous polyposis |
| CRC: Colorectal cancer | ||
| Colorectum (HTA11) |  | AD: Adenomas |
| SER: Sessile serrated lesions | ||
| MSI-H: Microsatellite-high colorectal cancer | ||
| MSS: Microsatellite stable colorectal cancer | ||
| Esophagus | 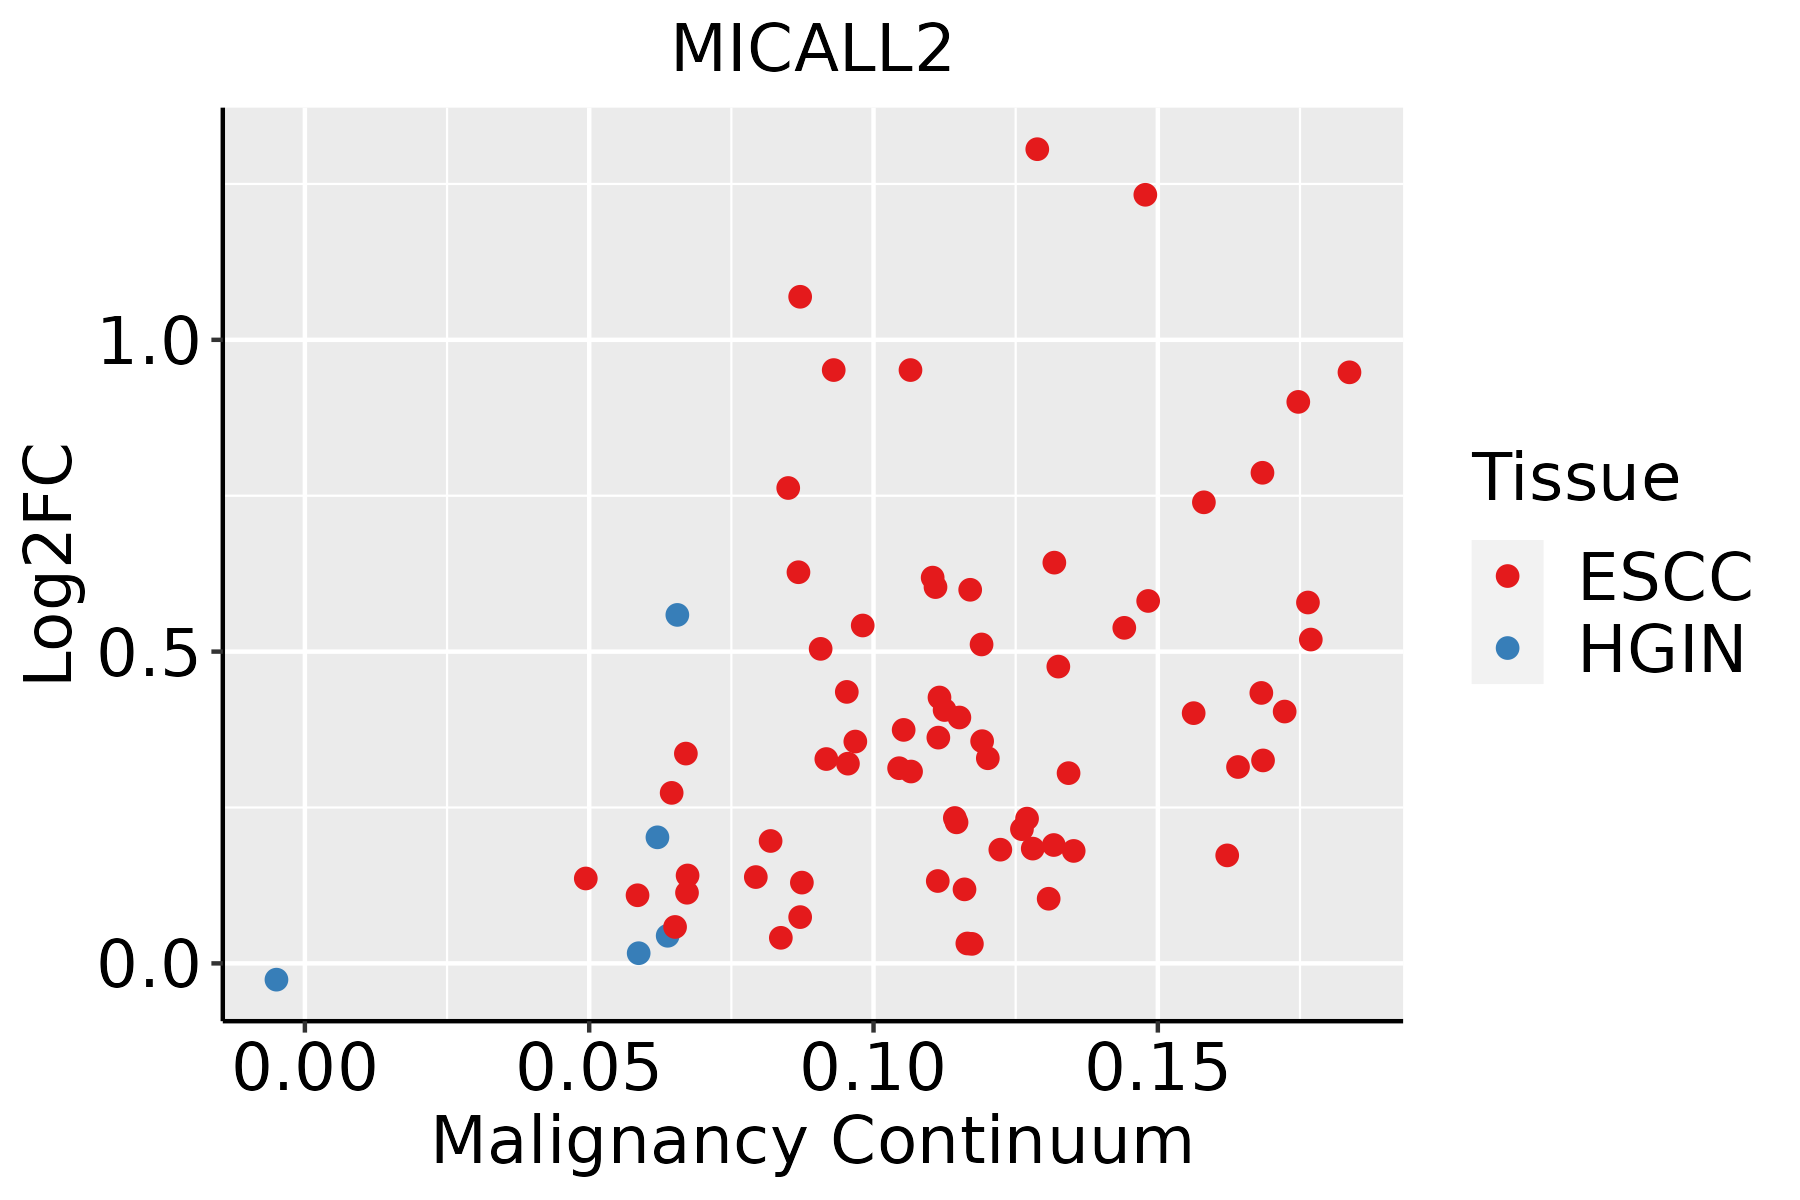 | ESCC: Esophageal squamous cell carcinoma |
| HGIN: High-grade intraepithelial neoplasias | ||
| LGIN: Low-grade intraepithelial neoplasias | ||
| GC |  | CAG: Chronic atrophic gastritis |
| CAG with IM: Chronic atrophic gastritis with intestinal metaplasia | ||
| CSG: Chronic superficial gastritis | ||
| GC: Gastric cancer | ||
| SIM: Severe intestinal metaplasia | ||
| WIM: Wild intestinal metaplasia | ||
| Liver |  | HCC: Hepatocellular carcinoma |
| NAFLD: Non-alcoholic fatty liver disease | ||
| Oral Cavity | 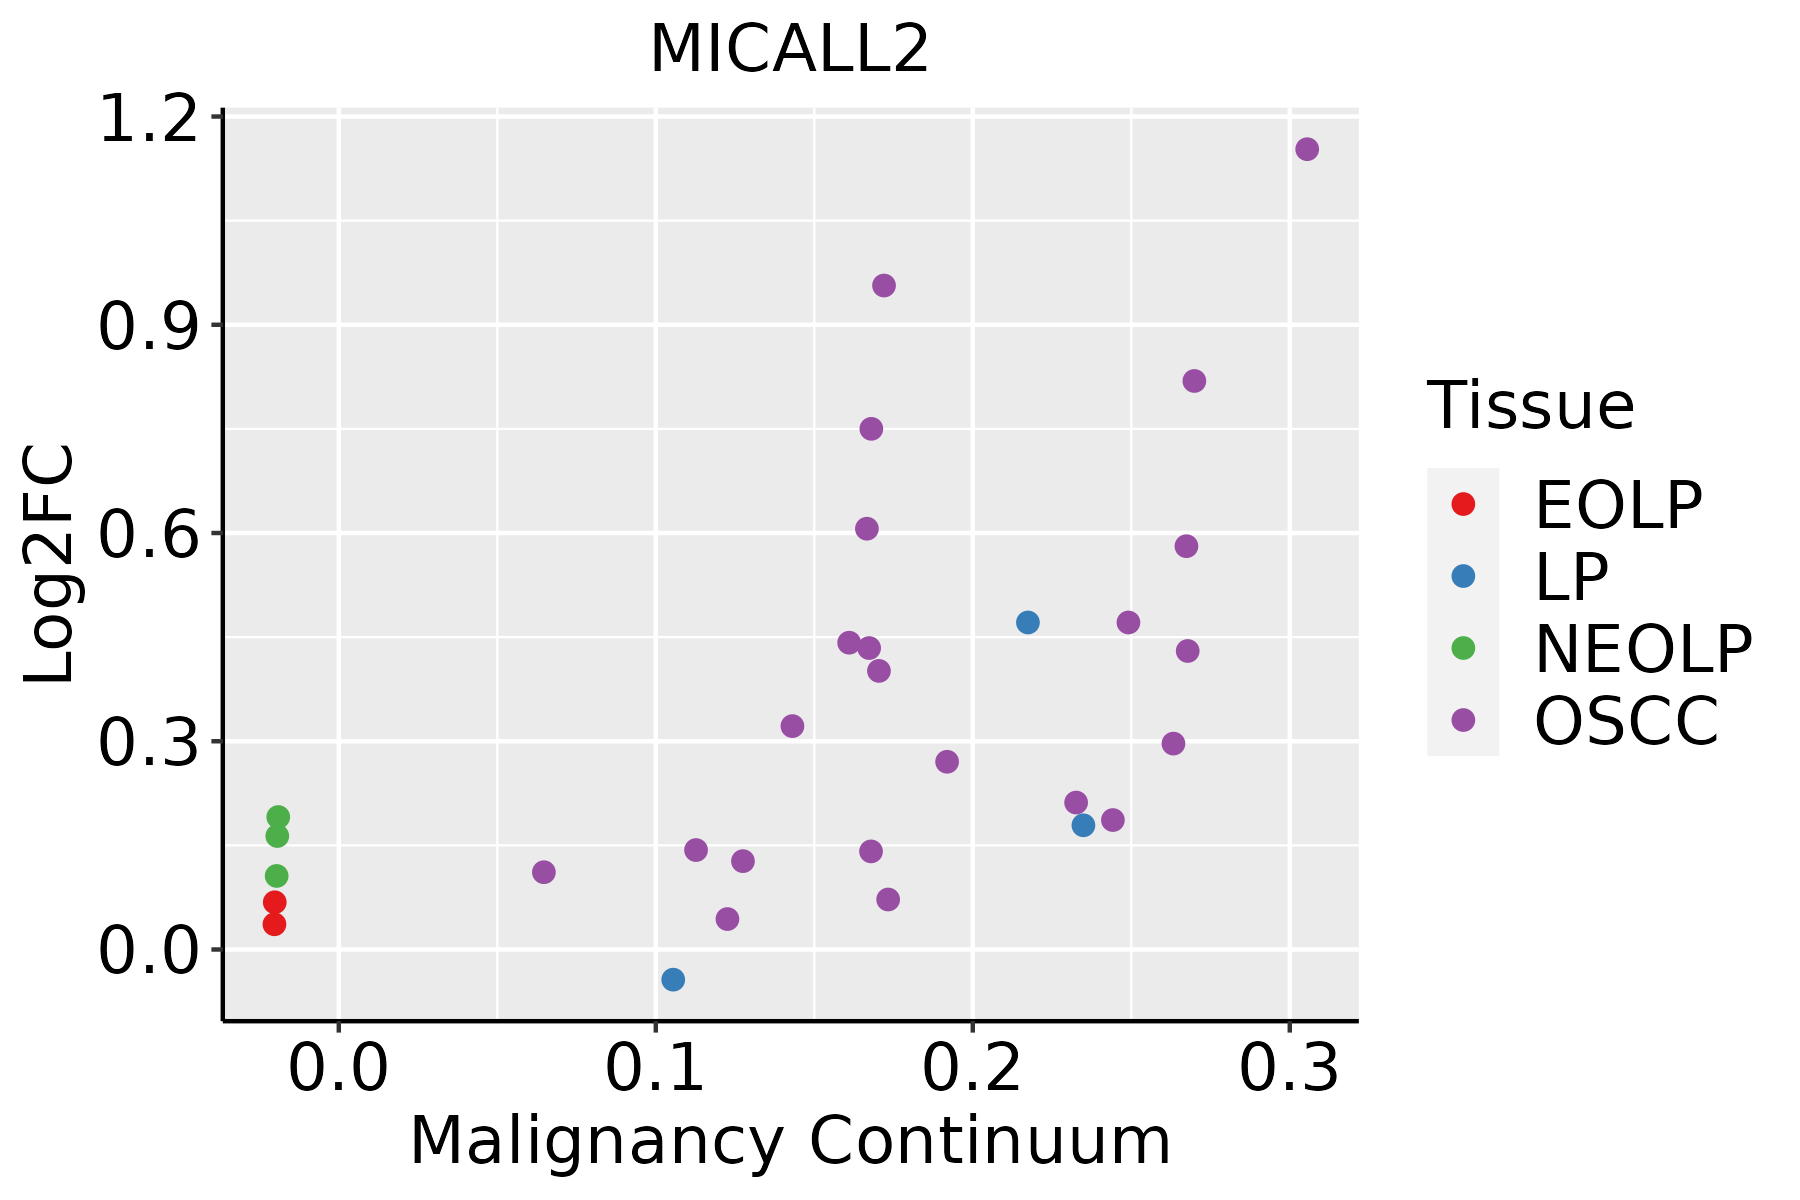 | EOLP: Erosive Oral lichen planus |
| LP: leukoplakia | ||
| NEOLP: Non-erosive oral lichen planus | ||
| OSCC: Oral squamous cell carcinoma | ||
| Thyroid | 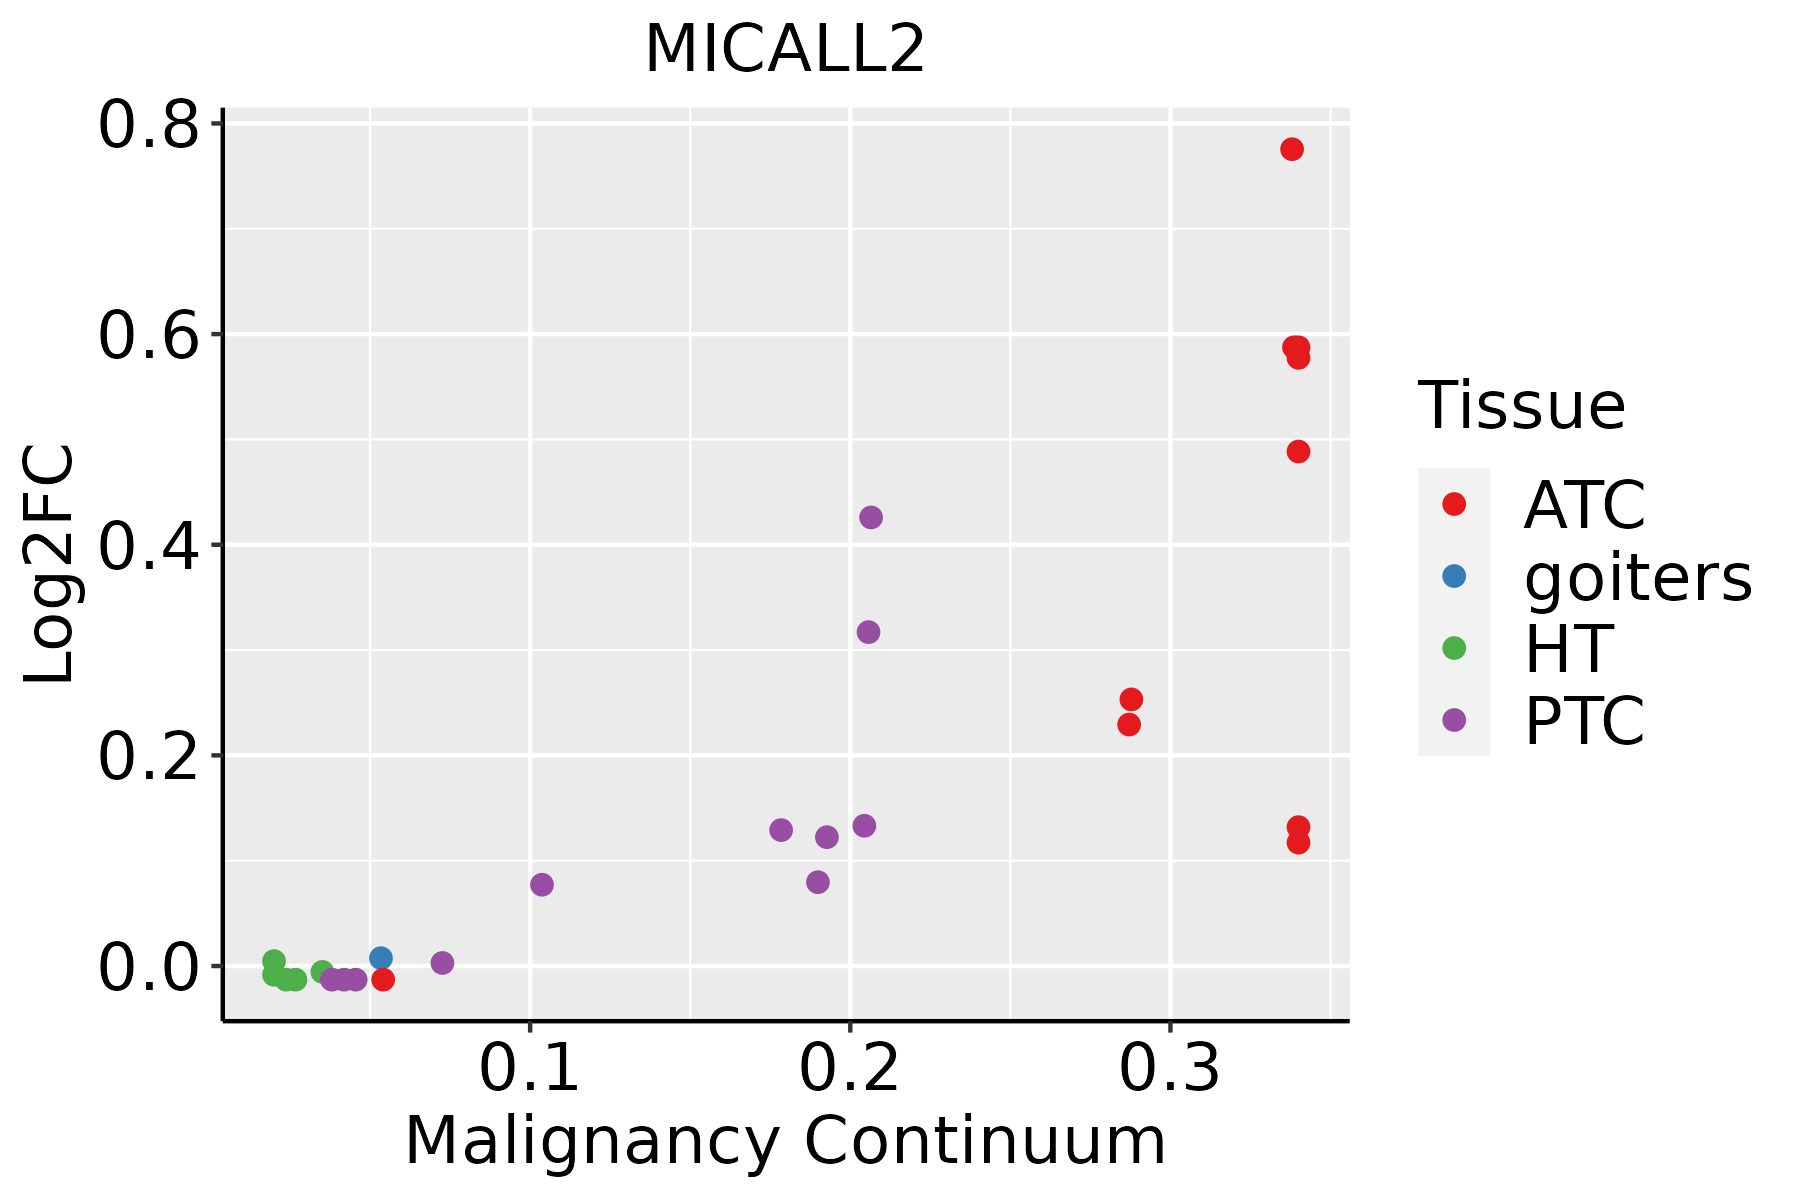 | ATC: Anaplastic thyroid cancer |
| HT: Hashimoto's thyroiditis | ||
| PTC: Papillary thyroid cancer |
| ∗log2FC in expression of this searched gene in stem-like cells from each diseased tissue sample relative to stem-like cells in normal samples in each tissue plotted against the malignancy continuum. Samples are colored based on if they are from different disease stage. |
Top |
Malignant transformation related pathway analysis |
| Find out the enriched GO biological processes and KEGG pathways involved in transition from healthy to precancer to cancer |
| Tissue | Disease Stage | Enriched GO biological Processes |
| Colorectum | AD |  |
| Colorectum | SER |  |
| Colorectum | MSS |  |
| Colorectum | MSI-H |  |
| Colorectum | FAP |  |
| ∗Top 15 enriched GO BP terms are showed in the bar plot of each disease state in each tissue. Each row represents a significant GO biological process which is colored according to the -log10(p.adjust). |
| Page: 1 2 3 4 5 6 7 8 9 |
| GO ID | Tissue | Disease Stage | Description | Gene Ratio | Bg Ratio | pvalue | p.adjust | Count |
| GO:007259411 | Stomach | CAG with IM | establishment of protein localization to organelle | 41/1050 | 422/18723 | 4.45e-04 | 6.89e-03 | 41 |
| GO:000704311 | Stomach | CAG with IM | cell-cell junction assembly | 19/1050 | 146/18723 | 5.29e-04 | 7.94e-03 | 19 |
| GO:007058511 | Stomach | CAG with IM | protein localization to mitochondrion | 17/1050 | 125/18723 | 6.13e-04 | 8.81e-03 | 17 |
| GO:012019211 | Stomach | CAG with IM | tight junction assembly | 12/1050 | 74/18723 | 7.94e-04 | 1.07e-02 | 12 |
| GO:005122211 | Stomach | CAG with IM | positive regulation of protein transport | 31/1050 | 303/18723 | 9.21e-04 | 1.19e-02 | 31 |
| GO:007265511 | Stomach | CAG with IM | establishment of protein localization to mitochondrion | 16/1050 | 120/18723 | 1.09e-03 | 1.33e-02 | 16 |
| GO:003158911 | Stomach | CAG with IM | cell-substrate adhesion | 35/1050 | 363/18723 | 1.29e-03 | 1.53e-02 | 35 |
| GO:000662611 | Stomach | CAG with IM | protein targeting to mitochondrion | 14/1050 | 100/18723 | 1.36e-03 | 1.58e-02 | 14 |
| GO:007083011 | Stomach | CAG with IM | bicellular tight junction assembly | 11/1050 | 70/18723 | 1.69e-03 | 1.84e-02 | 11 |
| GO:003432911 | Stomach | CAG with IM | cell junction assembly | 38/1050 | 420/18723 | 2.56e-03 | 2.50e-02 | 38 |
| GO:000701521 | Stomach | CSG | actin filament organization | 62/1034 | 442/18723 | 1.18e-11 | 2.70e-09 | 62 |
| GO:000683921 | Stomach | CSG | mitochondrial transport | 42/1034 | 254/18723 | 1.61e-10 | 2.75e-08 | 42 |
| GO:005125821 | Stomach | CSG | protein polymerization | 38/1034 | 297/18723 | 1.22e-06 | 6.11e-05 | 38 |
| GO:003153221 | Stomach | CSG | actin cytoskeleton reorganization | 20/1034 | 107/18723 | 1.42e-06 | 6.87e-05 | 20 |
| GO:004521621 | Stomach | CSG | cell-cell junction organization | 29/1034 | 200/18723 | 1.82e-06 | 8.48e-05 | 29 |
| GO:000815421 | Stomach | CSG | actin polymerization or depolymerization | 30/1034 | 218/18723 | 3.65e-06 | 1.53e-04 | 30 |
| GO:003004121 | Stomach | CSG | actin filament polymerization | 27/1034 | 191/18723 | 6.66e-06 | 2.48e-04 | 27 |
| GO:007259421 | Stomach | CSG | establishment of protein localization to organelle | 42/1034 | 422/18723 | 1.65e-04 | 3.28e-03 | 42 |
| GO:003444621 | Stomach | CSG | substrate adhesion-dependent cell spreading | 16/1034 | 108/18723 | 2.82e-04 | 5.00e-03 | 16 |
| GO:000660521 | Stomach | CSG | protein targeting | 33/1034 | 314/18723 | 3.03e-04 | 5.20e-03 | 33 |
| Page: 1 2 3 4 5 6 7 8 9 10 11 12 13 14 15 16 17 |
| Pathway ID | Tissue | Disease Stage | Description | Gene Ratio | Bg Ratio | pvalue | p.adjust | qvalue | Count |
| hsa04530 | Colorectum | AD | Tight junction | 76/2092 | 169/8465 | 5.49e-09 | 9.69e-08 | 6.18e-08 | 76 |
| hsa045301 | Colorectum | AD | Tight junction | 76/2092 | 169/8465 | 5.49e-09 | 9.69e-08 | 6.18e-08 | 76 |
| hsa045302 | Colorectum | SER | Tight junction | 59/1580 | 169/8465 | 3.24e-07 | 5.98e-06 | 4.34e-06 | 59 |
| hsa045303 | Colorectum | SER | Tight junction | 59/1580 | 169/8465 | 3.24e-07 | 5.98e-06 | 4.34e-06 | 59 |
| hsa0453039 | Esophagus | HGIN | Tight junction | 40/1383 | 169/8465 | 8.18e-03 | 4.71e-02 | 3.74e-02 | 40 |
| hsa04530115 | Esophagus | HGIN | Tight junction | 40/1383 | 169/8465 | 8.18e-03 | 4.71e-02 | 3.74e-02 | 40 |
| hsa04530211 | Esophagus | ESCC | Tight junction | 105/4205 | 169/8465 | 6.73e-04 | 2.23e-03 | 1.14e-03 | 105 |
| hsa04530310 | Esophagus | ESCC | Tight junction | 105/4205 | 169/8465 | 6.73e-04 | 2.23e-03 | 1.14e-03 | 105 |
| hsa0453042 | Liver | HCC | Tight junction | 110/4020 | 169/8465 | 2.45e-06 | 2.28e-05 | 1.27e-05 | 110 |
| hsa0453052 | Liver | HCC | Tight junction | 110/4020 | 169/8465 | 2.45e-06 | 2.28e-05 | 1.27e-05 | 110 |
| hsa0453030 | Oral cavity | OSCC | Tight junction | 102/3704 | 169/8465 | 8.68e-06 | 3.93e-05 | 2.00e-05 | 102 |
| hsa04530114 | Oral cavity | OSCC | Tight junction | 102/3704 | 169/8465 | 8.68e-06 | 3.93e-05 | 2.00e-05 | 102 |
| hsa0453045 | Oral cavity | NEOLP | Tight junction | 39/1112 | 169/8465 | 2.50e-04 | 1.62e-03 | 1.02e-03 | 39 |
| hsa0453055 | Oral cavity | NEOLP | Tight junction | 39/1112 | 169/8465 | 2.50e-04 | 1.62e-03 | 1.02e-03 | 39 |
| hsa0453012 | Stomach | GC | Tight junction | 33/708 | 169/8465 | 3.03e-06 | 4.65e-05 | 3.28e-05 | 33 |
| hsa0453013 | Stomach | GC | Tight junction | 33/708 | 169/8465 | 3.03e-06 | 4.65e-05 | 3.28e-05 | 33 |
| hsa0453021 | Stomach | CAG with IM | Tight junction | 32/640 | 169/8465 | 9.69e-07 | 1.62e-05 | 1.14e-05 | 32 |
| hsa0453031 | Stomach | CAG with IM | Tight junction | 32/640 | 169/8465 | 9.69e-07 | 1.62e-05 | 1.14e-05 | 32 |
| hsa0453041 | Stomach | CSG | Tight junction | 31/633 | 169/8465 | 2.29e-06 | 3.45e-05 | 2.48e-05 | 31 |
| hsa0453051 | Stomach | CSG | Tight junction | 31/633 | 169/8465 | 2.29e-06 | 3.45e-05 | 2.48e-05 | 31 |
| Page: 1 |
Top |
Cell-cell communication analysis |
| Identification of potential cell-cell interactions between two cell types and their ligand-receptor pairs for different disease states |
| Ligand | Receptor | LRpair | Pathway | Tissue | Disease Stage |
| Page: 1 |
Top |
Single-cell gene regulatory network inference analysis |
| Find out the significant the regulons (TFs) and the target genes of each regulon across cell types for different disease states |
| TF | Cell Type | Tissue | Disease Stage | Target Gene | RSS | Regulon Activity |
| ∗The dot plots of a searched regulon are shown for all cell subpopulations in each disease state of each tissue based on the regulon specific score inferred using pySCENIC and by calculating the average expression. |
| Page: 1 |
Top |
Somatic mutation of malignant transformation related genes |
| Annotation of somatic variants for genes involved in malignant transformation |
| Hugo Symbol | Variant Class | Variant Classification | dbSNP RS | HGVSc | HGVSp | HGVSp Short | SWISSPROT | BIOTYPE | SIFT | PolyPhen | Tumor Sample Barcode | Tissue | Histology | Sex | Age | Stage | Therapy Types | Drugs | Outcome |
| MICALL2 | SNV | Missense_Mutation | c.288G>C | p.Leu96Phe | p.L96F | Q8IY33 | protein_coding | deleterious(0.01) | possibly_damaging(0.906) | TCGA-3C-AALI-01 | Breast | breast invasive carcinoma | Female | <65 | I/II | Unspecific | Poly E | Complete Response | |
| MICALL2 | SNV | Missense_Mutation | novel | c.1862N>A | p.Pro621His | p.P621H | Q8IY33 | protein_coding | deleterious(0) | possibly_damaging(0.737) | TCGA-A7-A0DB-01 | Breast | breast invasive carcinoma | Female | <65 | I/II | Hormone Therapy | arimidex | SD |
| MICALL2 | SNV | Missense_Mutation | rs747674926 | c.1451N>G | p.Ser484Cys | p.S484C | Q8IY33 | protein_coding | tolerated(0.05) | benign(0.009) | TCGA-AC-A23H-01 | Breast | breast invasive carcinoma | Female | >=65 | I/II | Unknown | Unknown | PD |
| MICALL2 | insertion | Frame_Shift_Ins | rs751396826 | c.1284_1285insC | p.Gly429ArgfsTer61 | p.G429Rfs*61 | Q8IY33 | protein_coding | TCGA-BH-A18G-01 | Breast | breast invasive carcinoma | Female | >=65 | I/II | Unknown | Unknown | SD | ||
| MICALL2 | SNV | Missense_Mutation | novel | c.1291A>G | p.Ser431Gly | p.S431G | Q8IY33 | protein_coding | tolerated(1) | benign(0) | TCGA-2W-A8YY-01 | Cervix | cervical & endocervical cancer | Female | <65 | I/II | Chemotherapy | cisplatin | CR |
| MICALL2 | SNV | Missense_Mutation | rs374682289 | c.1910N>A | p.Thr637Asn | p.T637N | Q8IY33 | protein_coding | tolerated(0.07) | benign(0.307) | TCGA-C5-A2M1-01 | Cervix | cervical & endocervical cancer | Female | <65 | I/II | Unknown | Unknown | SD |
| MICALL2 | SNV | Missense_Mutation | rs760862909 | c.1138G>A | p.Gly380Arg | p.G380R | Q8IY33 | protein_coding | tolerated(0.53) | benign(0.086) | TCGA-C5-A2M2-01 | Cervix | cervical & endocervical cancer | Female | <65 | I/II | Unknown | Unknown | SD |
| MICALL2 | SNV | Missense_Mutation | novel | c.362N>T | p.Ala121Val | p.A121V | Q8IY33 | protein_coding | deleterious(0) | benign(0.042) | TCGA-EA-A410-01 | Cervix | cervical & endocervical cancer | Female | <65 | I/II | Unknown | Unknown | SD |
| MICALL2 | SNV | Missense_Mutation | c.2625N>A | p.Met875Ile | p.M875I | Q8IY33 | protein_coding | deleterious(0.01) | benign(0.231) | TCGA-IR-A3LI-01 | Cervix | cervical & endocervical cancer | Female | <65 | I/II | Chemotherapy | cisplatin | CR | |
| MICALL2 | SNV | Missense_Mutation | c.1010N>A | p.Arg337His | p.R337H | Q8IY33 | protein_coding | tolerated(0.17) | benign(0) | TCGA-LP-A7HU-01 | Cervix | cervical & endocervical cancer | Female | <65 | I/II | Unknown | Unknown | SD |
| Page: 1 2 3 4 5 6 7 |
Top |
Related drugs of malignant transformation related genes |
| Identification of chemicals and drugs interact with genes involved in malignant transfromation |
| (DGIdb 4.0) |
| Entrez ID | Symbol | Category | Interaction Types | Drug Claim Name | Drug Name | PMIDs |
| Page: 1 |

Copyright 2023-Present -The University of Texas Health Science Center at Houston |