
|
|||||
|
 | |
| |
| |
| |
| |
| |
|
Gene: ME1 |
Gene summary for ME1 |
| Gene information | Species | Human | Gene symbol | ME1 | Gene ID | 4199 |
| Gene name | malic enzyme 1 | |
| Gene Alias | HUMNDME | |
| Cytomap | 6q14.2 | |
| Gene Type | protein-coding | GO ID | GO:0005975 | UniProtAcc | P48163 |
Top |
Malignant transformation analysis |
| Identification of the aberrant gene expression in precancerous and cancerous lesions by comparing the gene expression of stem-like cells in diseased tissues with normal stem cells |
| Entrez ID | Symbol | Replicates | Species | Organ | Tissue | Adj P-value | Log2FC | Malignancy |
| 4199 | ME1 | HTA11_2487_2000001011 | Human | Colorectum | SER | 9.72e-03 | 3.49e-01 | -0.1808 |
| 4199 | ME1 | HTA11_1938_2000001011 | Human | Colorectum | AD | 8.61e-14 | 6.40e-01 | -0.0811 |
| 4199 | ME1 | HTA11_78_2000001011 | Human | Colorectum | AD | 1.81e-10 | 4.90e-01 | -0.1088 |
| 4199 | ME1 | HTA11_2112_2000001011 | Human | Colorectum | SER | 2.99e-03 | 5.26e-01 | -0.2196 |
| 4199 | ME1 | HTA11_83_2000001011 | Human | Colorectum | SER | 3.40e-04 | 3.70e-01 | -0.1526 |
| 4199 | ME1 | HTA11_1391_2000001011 | Human | Colorectum | AD | 6.76e-03 | 2.93e-01 | -0.059 |
| 4199 | ME1 | HTA11_99999970781_79442 | Human | Colorectum | MSS | 5.35e-10 | 3.61e-01 | 0.294 |
| 4199 | ME1 | HTA11_99999965104_69814 | Human | Colorectum | MSS | 3.68e-10 | 5.39e-01 | 0.281 |
| 4199 | ME1 | LZE2D | Human | Esophagus | HGIN | 2.51e-03 | 7.77e-01 | 0.0642 |
| 4199 | ME1 | LZE2T | Human | Esophagus | ESCC | 2.21e-11 | 1.25e+00 | 0.082 |
| 4199 | ME1 | LZE4T | Human | Esophagus | ESCC | 1.86e-38 | 1.37e+00 | 0.0811 |
| 4199 | ME1 | LZE7T | Human | Esophagus | ESCC | 2.15e-14 | 6.42e-01 | 0.0667 |
| 4199 | ME1 | LZE22T | Human | Esophagus | ESCC | 1.33e-06 | 6.21e-01 | 0.068 |
| 4199 | ME1 | LZE24T | Human | Esophagus | ESCC | 4.88e-13 | 3.67e-01 | 0.0596 |
| 4199 | ME1 | LZE21T | Human | Esophagus | ESCC | 2.20e-05 | 5.36e-01 | 0.0655 |
| 4199 | ME1 | P2T-E | Human | Esophagus | ESCC | 3.84e-18 | 4.00e-01 | 0.1177 |
| 4199 | ME1 | P4T-E | Human | Esophagus | ESCC | 1.81e-42 | 9.88e-01 | 0.1323 |
| 4199 | ME1 | P5T-E | Human | Esophagus | ESCC | 1.14e-17 | 3.73e-01 | 0.1327 |
| 4199 | ME1 | P8T-E | Human | Esophagus | ESCC | 1.62e-07 | 2.55e-01 | 0.0889 |
| 4199 | ME1 | P9T-E | Human | Esophagus | ESCC | 1.05e-22 | 7.34e-01 | 0.1131 |
| Page: 1 2 3 4 5 |
| Tissue | Expression Dynamics | Abbreviation |
| Colorectum (GSE201348) |  | FAP: Familial adenomatous polyposis |
| CRC: Colorectal cancer | ||
| Colorectum (HTA11) | 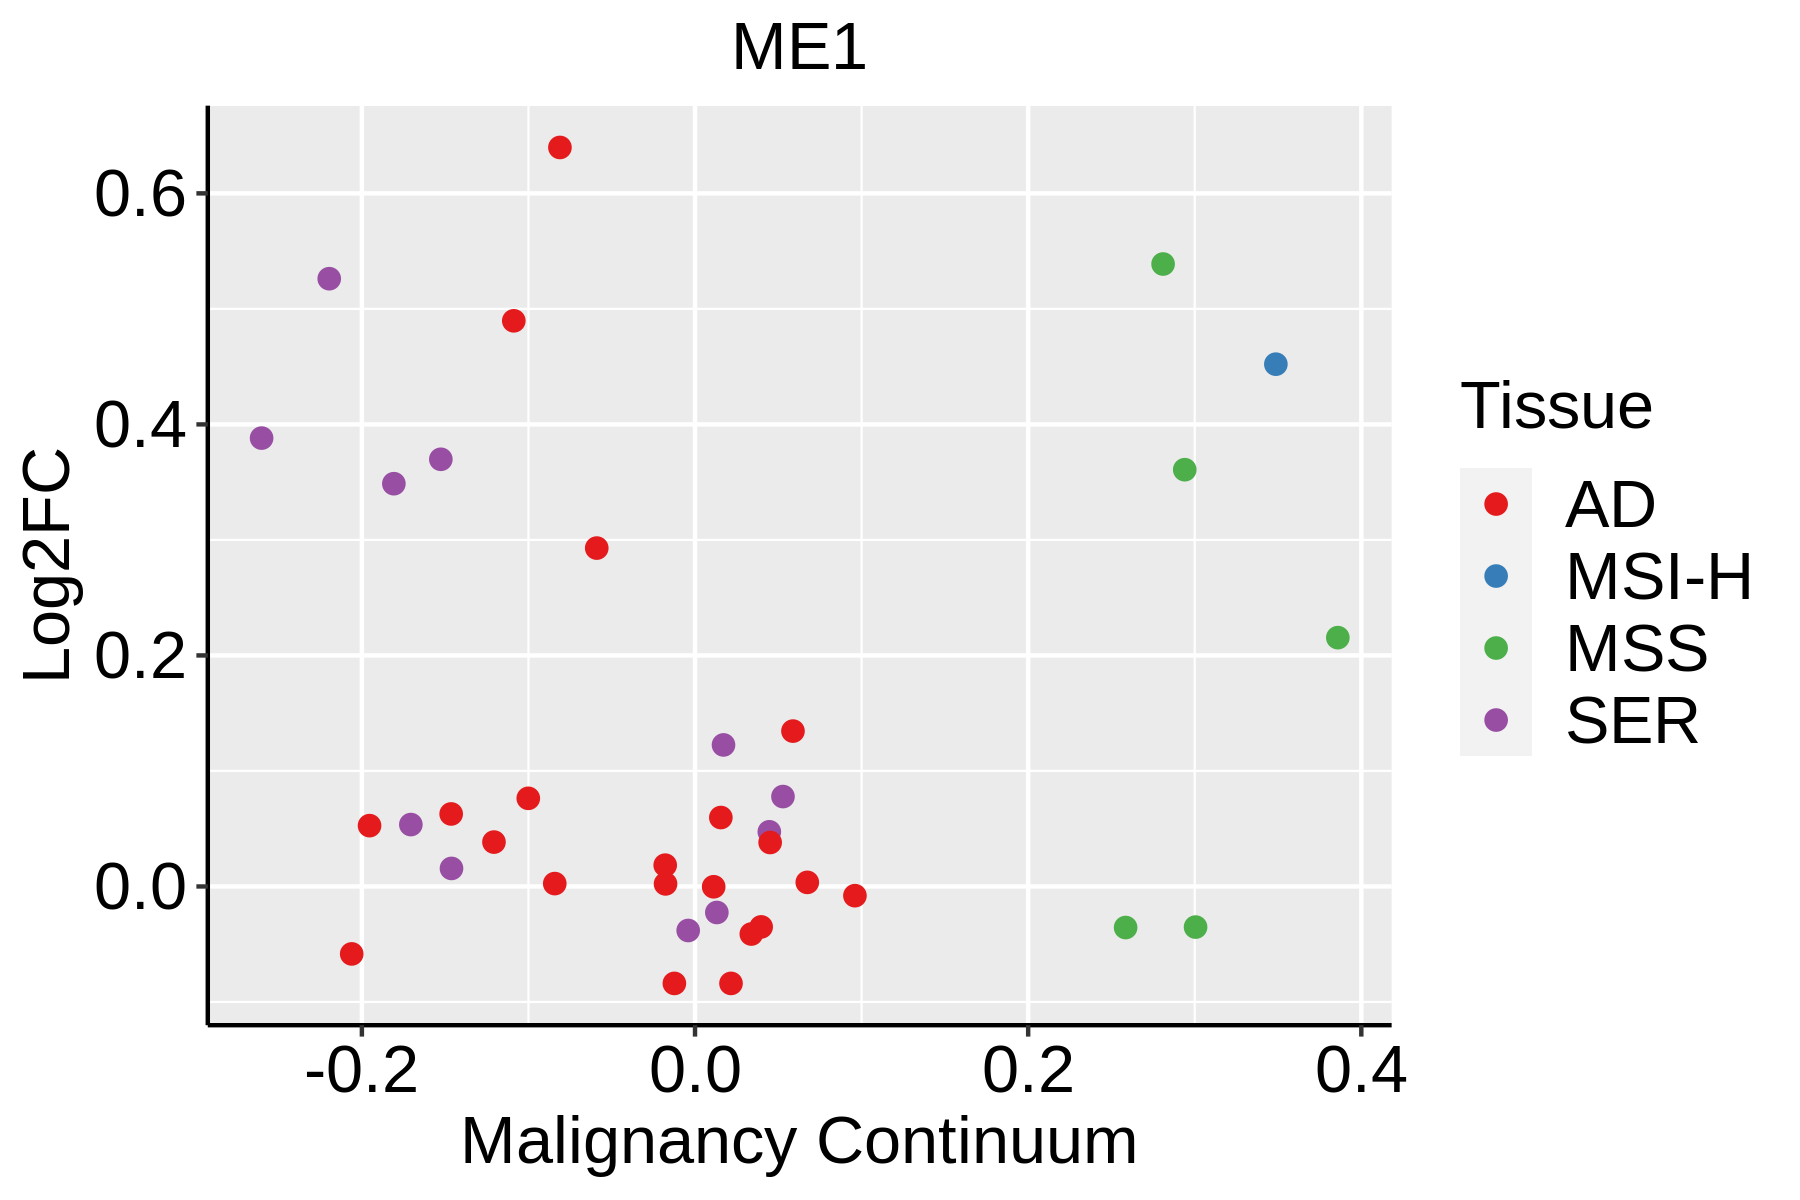 | AD: Adenomas |
| SER: Sessile serrated lesions | ||
| MSI-H: Microsatellite-high colorectal cancer | ||
| MSS: Microsatellite stable colorectal cancer | ||
| Esophagus | 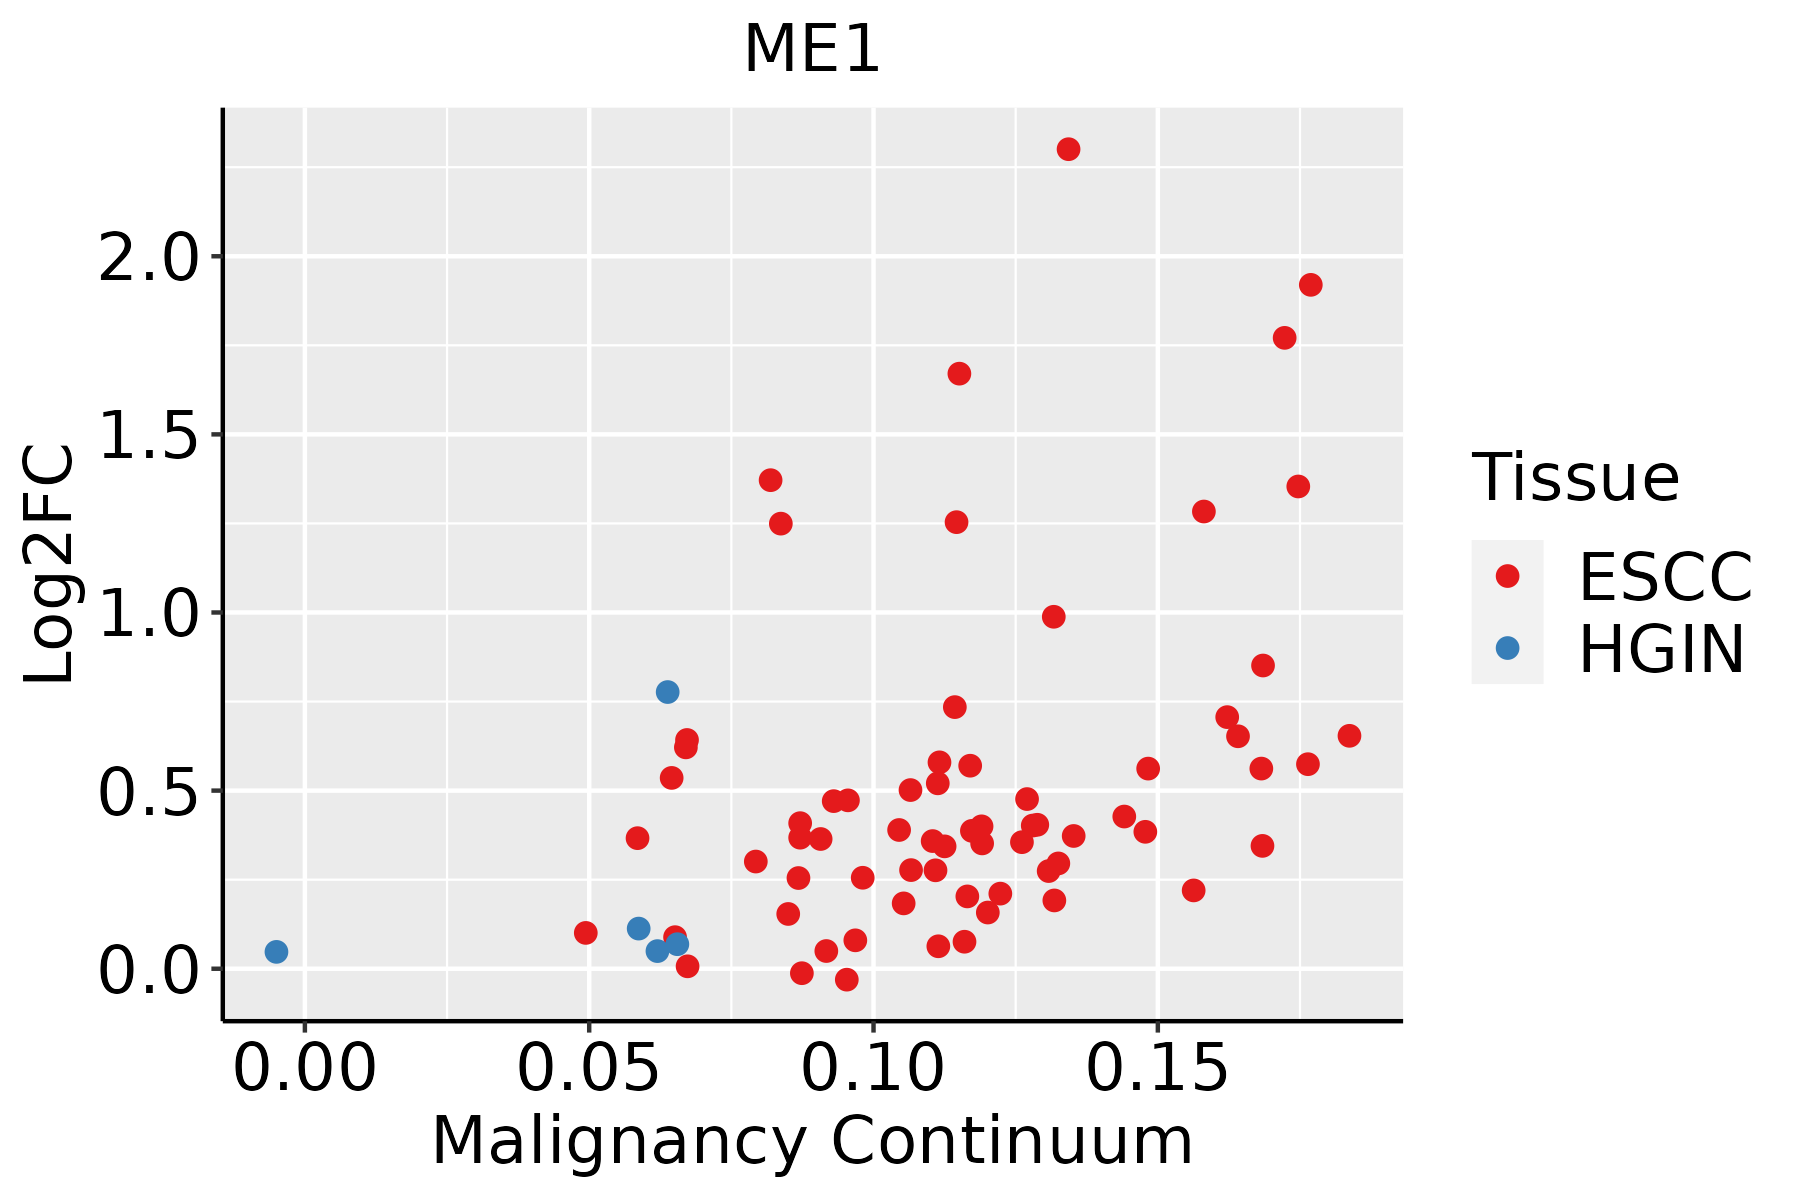 | ESCC: Esophageal squamous cell carcinoma |
| HGIN: High-grade intraepithelial neoplasias | ||
| LGIN: Low-grade intraepithelial neoplasias | ||
| Liver |  | HCC: Hepatocellular carcinoma |
| NAFLD: Non-alcoholic fatty liver disease | ||
| Oral Cavity | 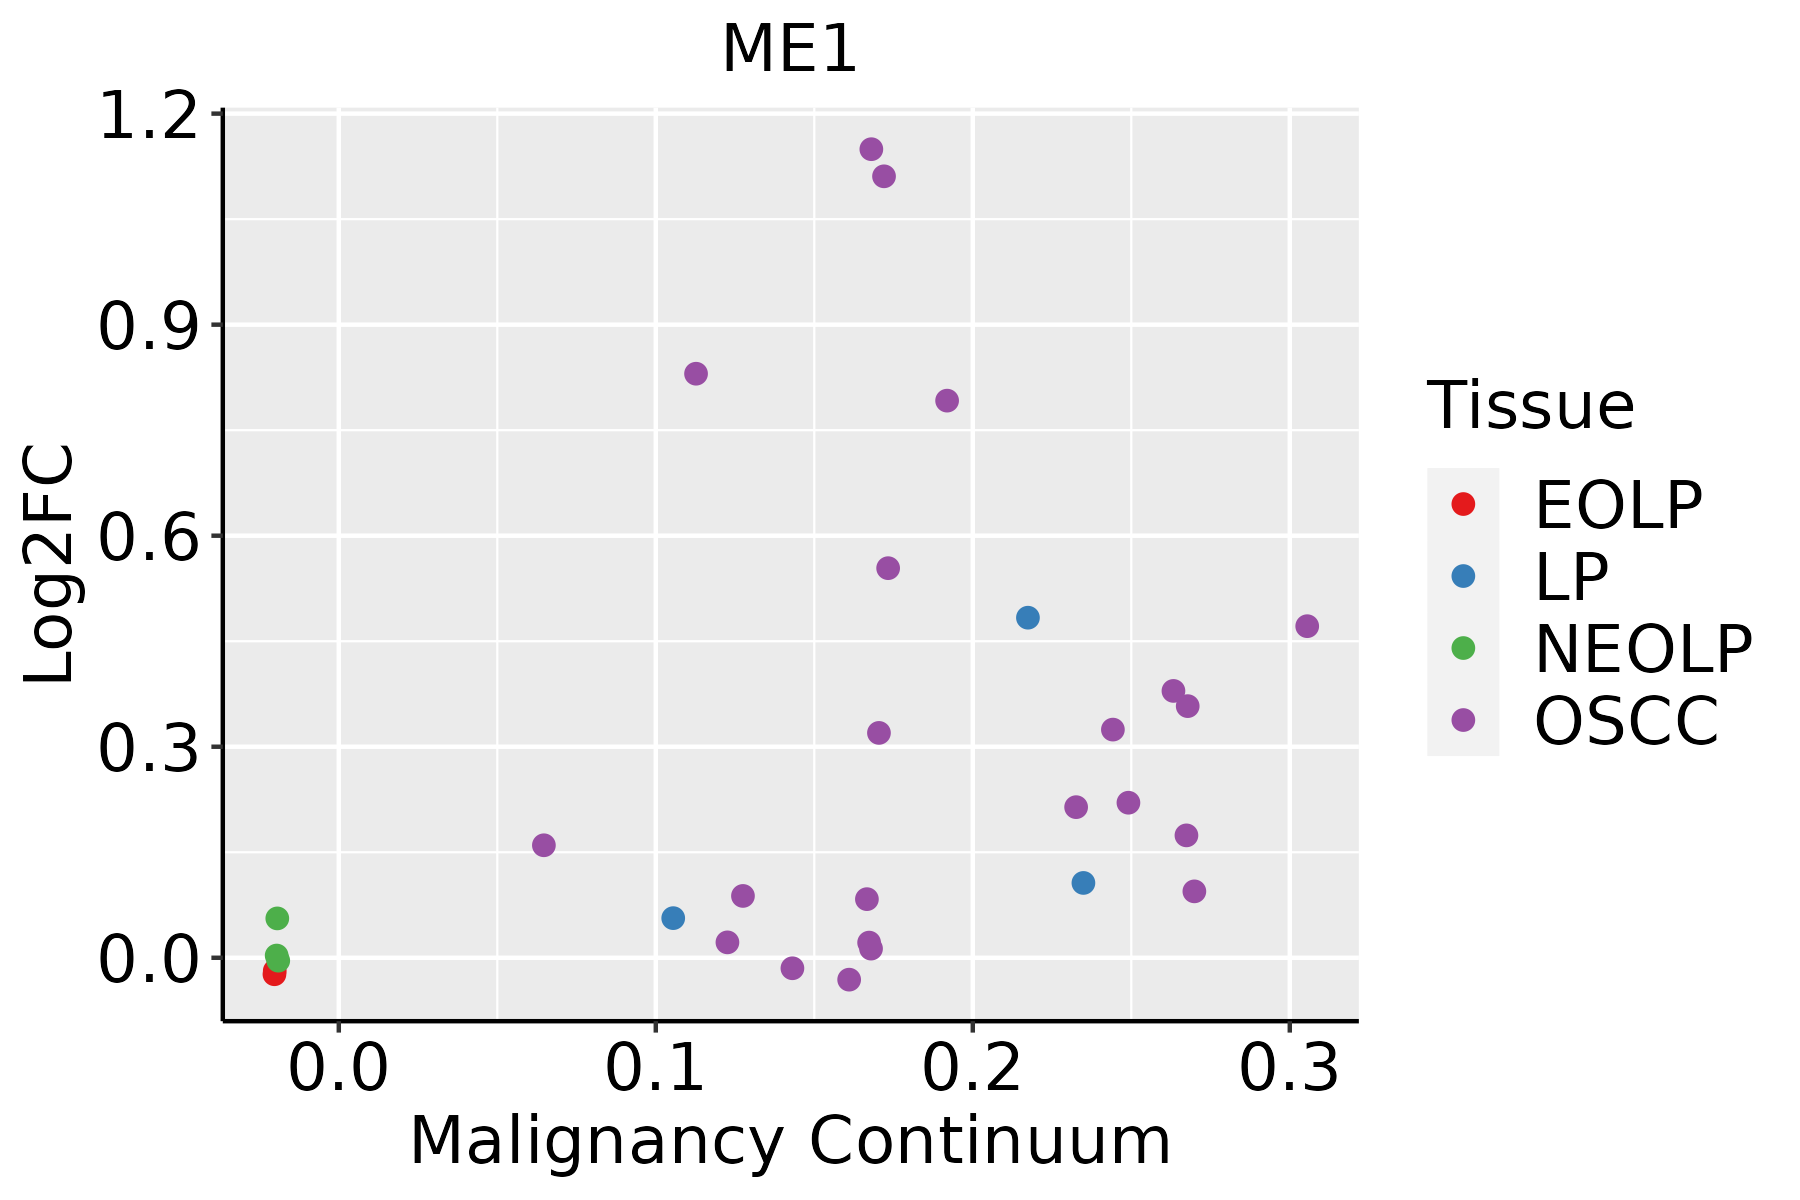 | EOLP: Erosive Oral lichen planus |
| LP: leukoplakia | ||
| NEOLP: Non-erosive oral lichen planus | ||
| OSCC: Oral squamous cell carcinoma | ||
| Thyroid | 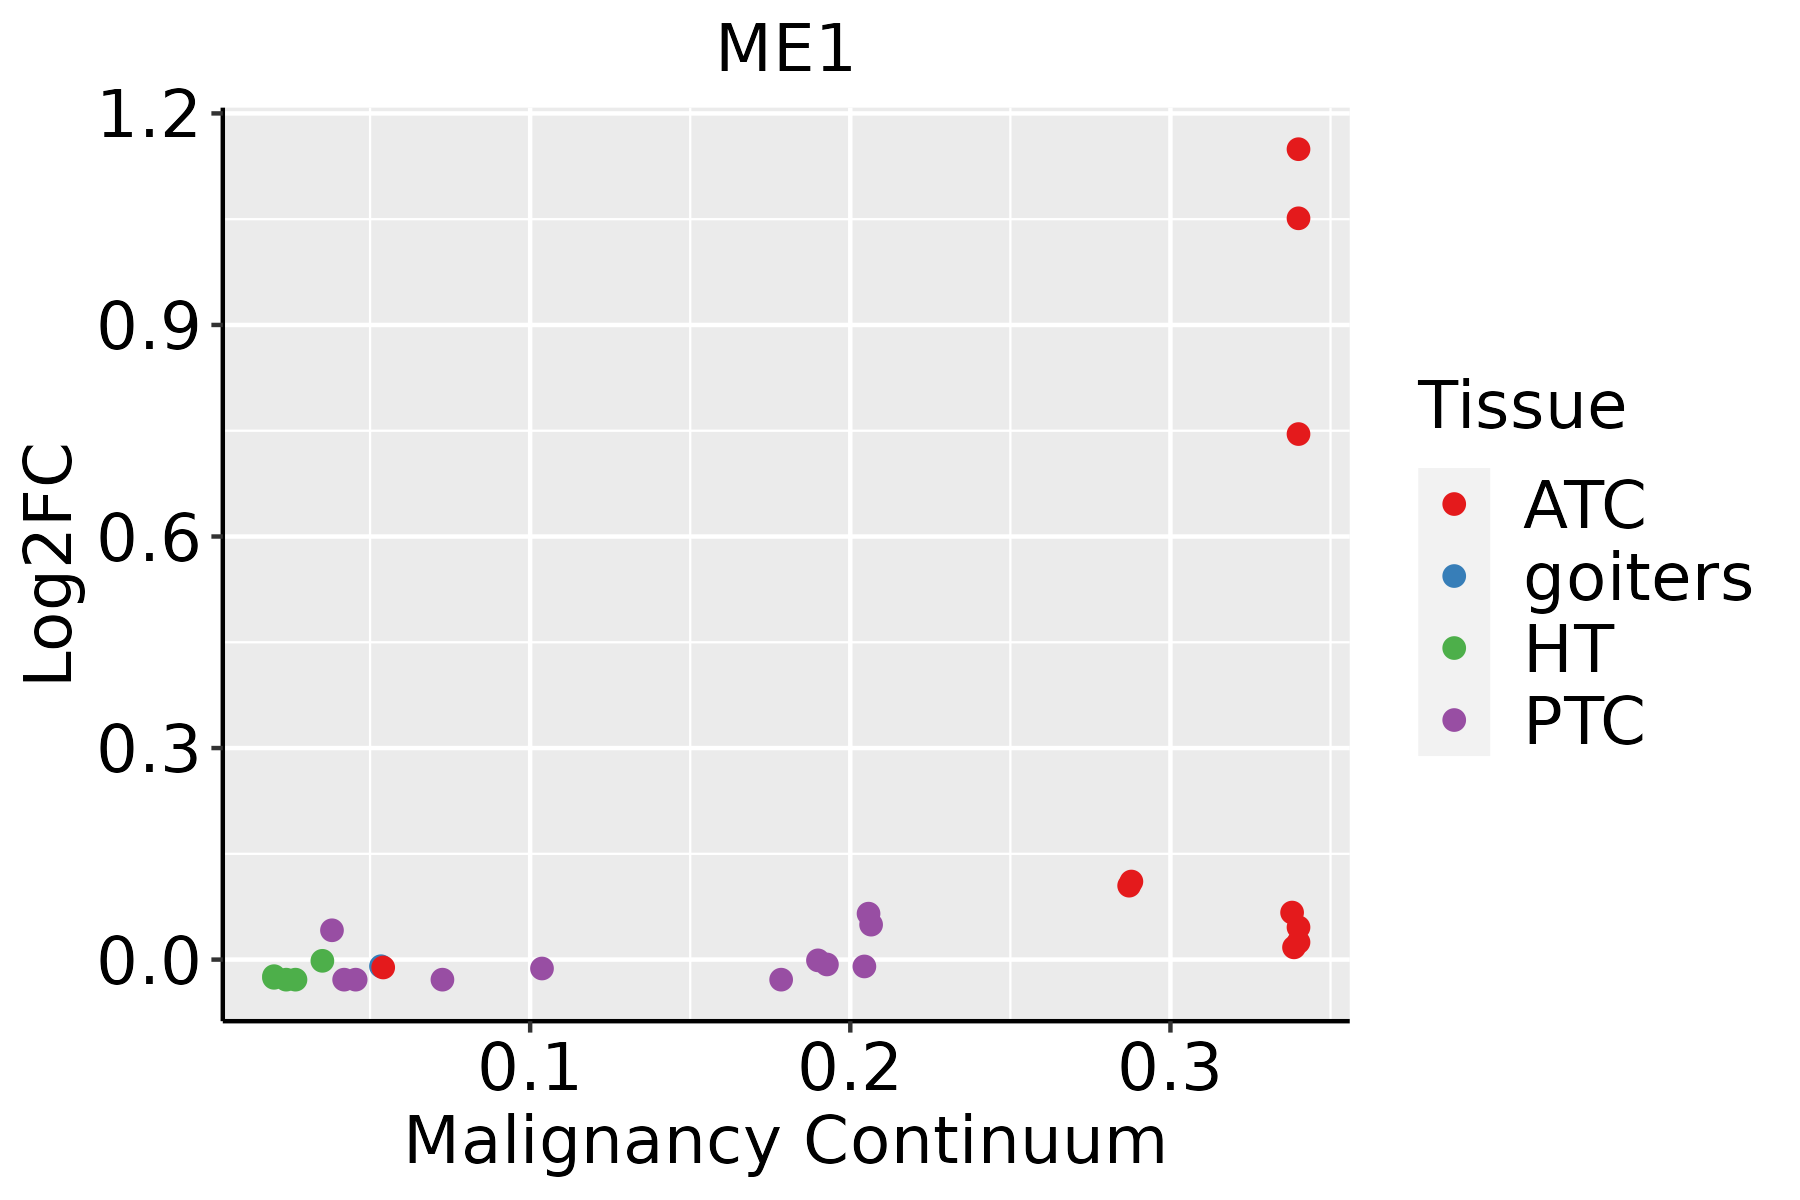 | ATC: Anaplastic thyroid cancer |
| HT: Hashimoto's thyroiditis | ||
| PTC: Papillary thyroid cancer |
| ∗log2FC in expression of this searched gene in stem-like cells from each diseased tissue sample relative to stem-like cells in normal samples in each tissue plotted against the malignancy continuum. Samples are colored based on if they are from different disease stage. |
Top |
Malignant transformation related pathway analysis |
| Find out the enriched GO biological processes and KEGG pathways involved in transition from healthy to precancer to cancer |
| Tissue | Disease Stage | Enriched GO biological Processes |
| Colorectum | AD |  |
| Colorectum | SER |  |
| Colorectum | MSS |  |
| Colorectum | MSI-H |  |
| Colorectum | FAP |  |
| ∗Top 15 enriched GO BP terms are showed in the bar plot of each disease state in each tissue. Each row represents a significant GO biological process which is colored according to the -log10(p.adjust). |
| Page: 1 2 3 4 5 6 7 8 9 |
| GO ID | Tissue | Disease Stage | Description | Gene Ratio | Bg Ratio | pvalue | p.adjust | Count |
| GO:0051099 | Colorectum | AD | positive regulation of binding | 66/3918 | 173/18723 | 1.47e-07 | 6.64e-06 | 66 |
| GO:0009145 | Colorectum | AD | purine nucleoside triphosphate biosynthetic process | 34/3918 | 69/18723 | 1.54e-07 | 6.78e-06 | 34 |
| GO:0009199 | Colorectum | AD | ribonucleoside triphosphate metabolic process | 40/3918 | 89/18723 | 3.04e-07 | 1.21e-05 | 40 |
| GO:0009152 | Colorectum | AD | purine ribonucleotide biosynthetic process | 64/3918 | 169/18723 | 3.09e-07 | 1.22e-05 | 64 |
| GO:0009206 | Colorectum | AD | purine ribonucleoside triphosphate biosynthetic process | 33/3918 | 68/18723 | 3.68e-07 | 1.43e-05 | 33 |
| GO:0009743 | Colorectum | AD | response to carbohydrate | 86/3918 | 253/18723 | 8.43e-07 | 2.90e-05 | 86 |
| GO:0009201 | Colorectum | AD | ribonucleoside triphosphate biosynthetic process | 34/3918 | 74/18723 | 1.23e-06 | 4.01e-05 | 34 |
| GO:0030099 | Colorectum | AD | myeloid cell differentiation | 119/3918 | 381/18723 | 1.24e-06 | 4.01e-05 | 119 |
| GO:0009260 | Colorectum | AD | ribonucleotide biosynthetic process | 66/3918 | 182/18723 | 1.25e-06 | 4.02e-05 | 66 |
| GO:0030879 | Colorectum | AD | mammary gland development | 53/3918 | 137/18723 | 1.46e-06 | 4.58e-05 | 53 |
| GO:0009132 | Colorectum | AD | nucleoside diphosphate metabolic process | 49/3918 | 124/18723 | 1.75e-06 | 5.31e-05 | 49 |
| GO:0046939 | Colorectum | AD | nucleotide phosphorylation | 42/3918 | 101/18723 | 1.99e-06 | 5.92e-05 | 42 |
| GO:0009142 | Colorectum | AD | nucleoside triphosphate biosynthetic process | 37/3918 | 85/18723 | 2.16e-06 | 6.35e-05 | 37 |
| GO:0046390 | Colorectum | AD | ribose phosphate biosynthetic process | 67/3918 | 190/18723 | 3.21e-06 | 9.05e-05 | 67 |
| GO:0052547 | Colorectum | AD | regulation of peptidase activity | 137/3918 | 461/18723 | 4.12e-06 | 1.12e-04 | 137 |
| GO:0034284 | Colorectum | AD | response to monosaccharide | 76/3918 | 225/18723 | 4.64e-06 | 1.23e-04 | 76 |
| GO:0010952 | Colorectum | AD | positive regulation of peptidase activity | 68/3918 | 197/18723 | 6.30e-06 | 1.59e-04 | 68 |
| GO:0006165 | Colorectum | AD | nucleoside diphosphate phosphorylation | 40/3918 | 99/18723 | 8.02e-06 | 1.93e-04 | 40 |
| GO:0006164 | Colorectum | AD | purine nucleotide biosynthetic process | 66/3918 | 191/18723 | 8.22e-06 | 1.97e-04 | 66 |
| GO:0033500 | Colorectum | AD | carbohydrate homeostasis | 84/3918 | 259/18723 | 9.10e-06 | 2.15e-04 | 84 |
| Page: 1 2 3 4 5 6 7 8 9 10 11 12 13 14 15 16 17 18 19 20 21 22 23 24 25 26 27 28 29 30 31 32 33 34 35 36 37 38 39 40 41 42 43 44 45 46 47 48 49 50 51 52 53 54 55 56 57 58 59 60 61 62 63 64 65 66 67 68 69 70 71 72 73 74 75 76 77 78 79 80 81 82 83 84 85 86 87 88 89 90 91 92 93 94 95 96 97 98 99 |
| Pathway ID | Tissue | Disease Stage | Description | Gene Ratio | Bg Ratio | pvalue | p.adjust | qvalue | Count |
| hsa01200 | Colorectum | AD | Carbon metabolism | 55/2092 | 115/8465 | 5.53e-08 | 8.42e-07 | 5.37e-07 | 55 |
| hsa00620 | Colorectum | AD | Pyruvate metabolism | 28/2092 | 47/8465 | 3.71e-07 | 5.41e-06 | 3.45e-06 | 28 |
| hsa012001 | Colorectum | AD | Carbon metabolism | 55/2092 | 115/8465 | 5.53e-08 | 8.42e-07 | 5.37e-07 | 55 |
| hsa006201 | Colorectum | AD | Pyruvate metabolism | 28/2092 | 47/8465 | 3.71e-07 | 5.41e-06 | 3.45e-06 | 28 |
| hsa006202 | Colorectum | SER | Pyruvate metabolism | 22/1580 | 47/8465 | 9.62e-06 | 1.33e-04 | 9.67e-05 | 22 |
| hsa012002 | Colorectum | SER | Carbon metabolism | 40/1580 | 115/8465 | 2.77e-05 | 3.41e-04 | 2.47e-04 | 40 |
| hsa006203 | Colorectum | SER | Pyruvate metabolism | 22/1580 | 47/8465 | 9.62e-06 | 1.33e-04 | 9.67e-05 | 22 |
| hsa012003 | Colorectum | SER | Carbon metabolism | 40/1580 | 115/8465 | 2.77e-05 | 3.41e-04 | 2.47e-04 | 40 |
| hsa006204 | Colorectum | MSS | Pyruvate metabolism | 24/1875 | 47/8465 | 1.25e-05 | 1.35e-04 | 8.27e-05 | 24 |
| hsa012004 | Colorectum | MSS | Carbon metabolism | 43/1875 | 115/8465 | 1.37e-04 | 1.17e-03 | 7.19e-04 | 43 |
| hsa006205 | Colorectum | MSS | Pyruvate metabolism | 24/1875 | 47/8465 | 1.25e-05 | 1.35e-04 | 8.27e-05 | 24 |
| hsa012005 | Colorectum | MSS | Carbon metabolism | 43/1875 | 115/8465 | 1.37e-04 | 1.17e-03 | 7.19e-04 | 43 |
| hsa0062010 | Esophagus | HGIN | Pyruvate metabolism | 16/1383 | 47/8465 | 2.27e-03 | 1.95e-02 | 1.55e-02 | 16 |
| hsa0120016 | Esophagus | HGIN | Carbon metabolism | 31/1383 | 115/8465 | 2.51e-03 | 2.10e-02 | 1.67e-02 | 31 |
| hsa0062013 | Esophagus | HGIN | Pyruvate metabolism | 16/1383 | 47/8465 | 2.27e-03 | 1.95e-02 | 1.55e-02 | 16 |
| hsa0120017 | Esophagus | HGIN | Carbon metabolism | 31/1383 | 115/8465 | 2.51e-03 | 2.10e-02 | 1.67e-02 | 31 |
| hsa0120023 | Esophagus | ESCC | Carbon metabolism | 79/4205 | 115/8465 | 2.50e-05 | 1.21e-04 | 6.22e-05 | 79 |
| hsa0062023 | Esophagus | ESCC | Pyruvate metabolism | 32/4205 | 47/8465 | 8.11e-03 | 1.94e-02 | 9.94e-03 | 32 |
| hsa0120033 | Esophagus | ESCC | Carbon metabolism | 79/4205 | 115/8465 | 2.50e-05 | 1.21e-04 | 6.22e-05 | 79 |
| hsa0062033 | Esophagus | ESCC | Pyruvate metabolism | 32/4205 | 47/8465 | 8.11e-03 | 1.94e-02 | 9.94e-03 | 32 |
| Page: 1 2 |
Top |
Cell-cell communication analysis |
| Identification of potential cell-cell interactions between two cell types and their ligand-receptor pairs for different disease states |
| Ligand | Receptor | LRpair | Pathway | Tissue | Disease Stage |
| Page: 1 |
Top |
Single-cell gene regulatory network inference analysis |
| Find out the significant the regulons (TFs) and the target genes of each regulon across cell types for different disease states |
| TF | Cell Type | Tissue | Disease Stage | Target Gene | RSS | Regulon Activity |
| ∗The dot plots of a searched regulon are shown for all cell subpopulations in each disease state of each tissue based on the regulon specific score inferred using pySCENIC and by calculating the average expression. |
| Page: 1 |
Top |
Somatic mutation of malignant transformation related genes |
| Annotation of somatic variants for genes involved in malignant transformation |
| Hugo Symbol | Variant Class | Variant Classification | dbSNP RS | HGVSc | HGVSp | HGVSp Short | SWISSPROT | BIOTYPE | SIFT | PolyPhen | Tumor Sample Barcode | Tissue | Histology | Sex | Age | Stage | Therapy Types | Drugs | Outcome |
| ME1 | SNV | Missense_Mutation | novel | c.181A>C | p.Asn61His | p.N61H | P48163 | protein_coding | deleterious(0.02) | possibly_damaging(0.787) | TCGA-2W-A8YY-01 | Cervix | cervical & endocervical cancer | Female | <65 | I/II | Chemotherapy | cisplatin | CR |
| ME1 | SNV | Missense_Mutation | c.1364N>A | p.Ser455Tyr | p.S455Y | P48163 | protein_coding | deleterious(0.02) | probably_damaging(0.967) | TCGA-FU-A3HZ-01 | Cervix | cervical & endocervical cancer | Female | <65 | I/II | Chemotherapy | cisplatin | CR | |
| ME1 | SNV | Missense_Mutation | c.1696N>G | p.Ile566Val | p.I566V | P48163 | protein_coding | tolerated_low_confidence(1) | benign(0) | TCGA-A6-6780-01 | Colorectum | colon adenocarcinoma | Male | >=65 | I/II | Unknown | Unknown | SD | |
| ME1 | SNV | Missense_Mutation | c.455N>T | p.Asp152Val | p.D152V | P48163 | protein_coding | deleterious(0) | probably_damaging(0.998) | TCGA-AA-3811-01 | Colorectum | colon adenocarcinoma | Female | >=65 | III/IV | Unknown | Unknown | PD | |
| ME1 | SNV | Missense_Mutation | rs775383665 | c.1030C>T | p.Arg344Cys | p.R344C | P48163 | protein_coding | deleterious(0) | probably_damaging(0.996) | TCGA-AA-3842-01 | Colorectum | colon adenocarcinoma | Male | <65 | III/IV | Chemotherapy | folinic | PD |
| ME1 | SNV | Missense_Mutation | novel | c.1688T>C | p.Val563Ala | p.V563A | P48163 | protein_coding | tolerated(1) | benign(0) | TCGA-AA-3950-01 | Colorectum | colon adenocarcinoma | Female | >=65 | I/II | Unknown | Unknown | SD |
| ME1 | SNV | Missense_Mutation | c.200N>T | p.Ser67Phe | p.S67F | P48163 | protein_coding | deleterious(0.02) | possibly_damaging(0.624) | TCGA-AA-3973-01 | Colorectum | colon adenocarcinoma | Male | >=65 | III/IV | Targeted Molecular therapy | bevacizumab | SD | |
| ME1 | SNV | Missense_Mutation | c.133N>A | p.Pro45Thr | p.P45T | P48163 | protein_coding | deleterious(0) | probably_damaging(1) | TCGA-AA-A01I-01 | Colorectum | colon adenocarcinoma | Male | >=65 | I/II | Unknown | Unknown | SD | |
| ME1 | SNV | Missense_Mutation | rs868866711 | c.385N>A | p.Asp129Asn | p.D129N | P48163 | protein_coding | deleterious(0.01) | probably_damaging(1) | TCGA-AZ-4315-01 | Colorectum | colon adenocarcinoma | Male | <65 | I/II | Unknown | Unknown | SD |
| ME1 | SNV | Missense_Mutation | novel | c.178N>C | p.Lys60Gln | p.K60Q | P48163 | protein_coding | tolerated(0.47) | benign(0.051) | TCGA-CA-6717-01 | Colorectum | colon adenocarcinoma | Male | <65 | I/II | Chemotherapy | oxaliplatin | CR |
| Page: 1 2 3 4 5 6 7 |
Top |
Related drugs of malignant transformation related genes |
| Identification of chemicals and drugs interact with genes involved in malignant transfromation |
| (DGIdb 4.0) |
| Entrez ID | Symbol | Category | Interaction Types | Drug Claim Name | Drug Name | PMIDs |
| Page: 1 |

Copyright 2023-Present -The University of Texas Health Science Center at Houston |