Schematic overview of the cellular and molecular mechanisms involved in the cancer progression, including the proposed cellular and molecular mechanisms in cancer cells trajectory. AT1: alveolar type 1 cells; AT2: alveolar type 2 cells; AAH: atypical adenomatous hyperplasia; AIS: adenocarcinoma in situ; MIA: minimally invasive adenocarcinoma; IA: invasive adenocarcinoma; EMT: epithelial-mesenchymal transition

Home

Download

Statistics

Help

Contact

Center for Computational Systems Medicine
leaf

Gene summary

leaf

Malignant transformation analysis

leaf

Malignant transformation related pathway analysis

leaf

Cell-cell communication analysis

leaf

Single-cell gene regulatory network inference analysis

leaf

Somatic mutation of malignant transformation related genes

leaf

Related drugs of malignant transformation related genes

Gene: MDFI

Gene summary for MDFI

check button Gene summary.

Gene informationSpeciesHuman
Gene symbol

MDFI

Gene ID

4188

Gene nameMyoD family inhibitor
Gene AliasI-MF
Cytomap6p21.1
Gene Typeprotein-coding
GO ID

GO:0000003

UniProtAcc

A0A024RCY2


Top

Malignant transformation analysis

check button Identification of the aberrant gene expression in precancerous and cancerous lesions by comparing the gene expression of stem-like cells in diseased tissues with normal stem cells
check button Malignant transformation involving gene list.
Entrez IDSymbolReplicatesSpeciesOrganTissueAdj P-valueLog2FCMalignancy
4188MDFIGSM4909281HumanBreastIDC2.90e-558.29e-010.21
4188MDFIGSM4909282HumanBreastIDC5.21e-204.08e-01-0.0288
4188MDFIGSM4909285HumanBreastIDC8.44e-527.31e-010.21
4188MDFIGSM4909305HumanBreastIDC9.84e-042.39e-010.0436
4188MDFIGSM4909306HumanBreastIDC6.38e-062.77e-010.1564
4188MDFIGSM4909312HumanBreastIDC1.92e-226.23e-010.1552
4188MDFIbrca1HumanBreastPrecancer7.51e-031.65e-01-0.0338
4188MDFIDCIS2HumanBreastDCIS1.18e-167.62e-020.0085
4188MDFILZE4THumanEsophagusESCC6.13e-101.60e-010.0811
4188MDFILZE22THumanEsophagusESCC1.02e-064.37e-010.068
4188MDFILZE24THumanEsophagusESCC3.62e-082.16e-010.0596
4188MDFIP1T-EHumanEsophagusESCC2.39e-084.54e-010.0875
4188MDFIP2T-EHumanEsophagusESCC4.28e-901.72e+000.1177
4188MDFIP4T-EHumanEsophagusESCC6.77e-347.98e-010.1323
4188MDFIP5T-EHumanEsophagusESCC3.41e-245.27e-010.1327
4188MDFIP8T-EHumanEsophagusESCC7.37e-211.60e-010.0889
4188MDFIP9T-EHumanEsophagusESCC2.78e-092.31e-010.1131
4188MDFIP10T-EHumanEsophagusESCC2.72e-284.77e-010.116
4188MDFIP11T-EHumanEsophagusESCC4.20e-157.55e-010.1426
4188MDFIP12T-EHumanEsophagusESCC5.39e-082.57e-030.1122
Page: 1 2 3 4 5 6 

check button Transcriptomic changes along malignancy continuum.
TissueExpression DynamicsAbbreviation
BreastThe image shows the transcriptomic changes along malignancy continuum.log2FC in expression of this searched gene in stem-like cells from each diseased tissue sample relative to stem-like cells in normal samples in each tissue plotted against the malignancy continuum. Samples are colored based on if they are from different disease stage.
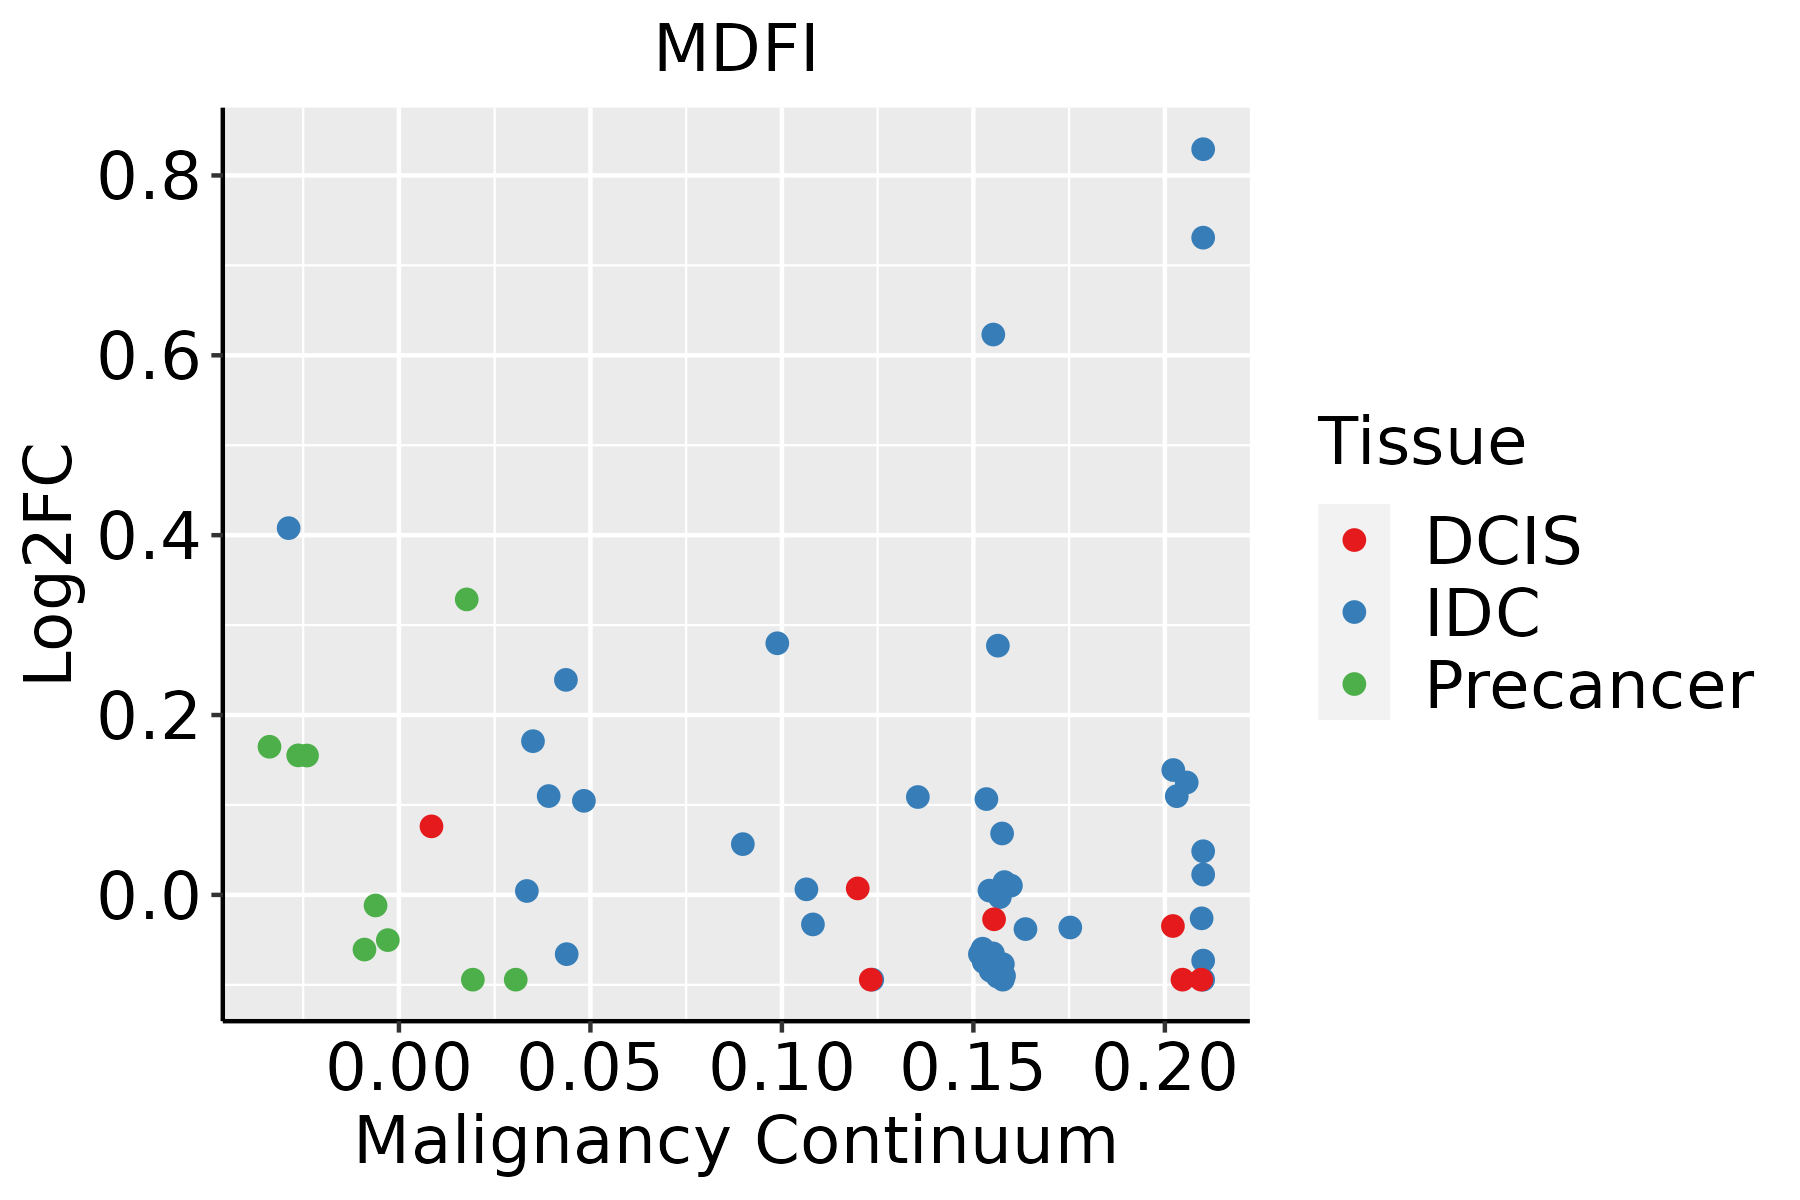
IDC: Invasive ductal carcinoma
DCIS: Ductal carcinoma in situ
Precancer(BRCA1-mut): Precancerous lesion from BRCA1 mutation carriers
EsophagusThe image shows the transcriptomic changes along malignancy continuum.log2FC in expression of this searched gene in stem-like cells from each diseased tissue sample relative to stem-like cells in normal samples in each tissue plotted against the malignancy continuum. Samples are colored based on if they are from different disease stage.
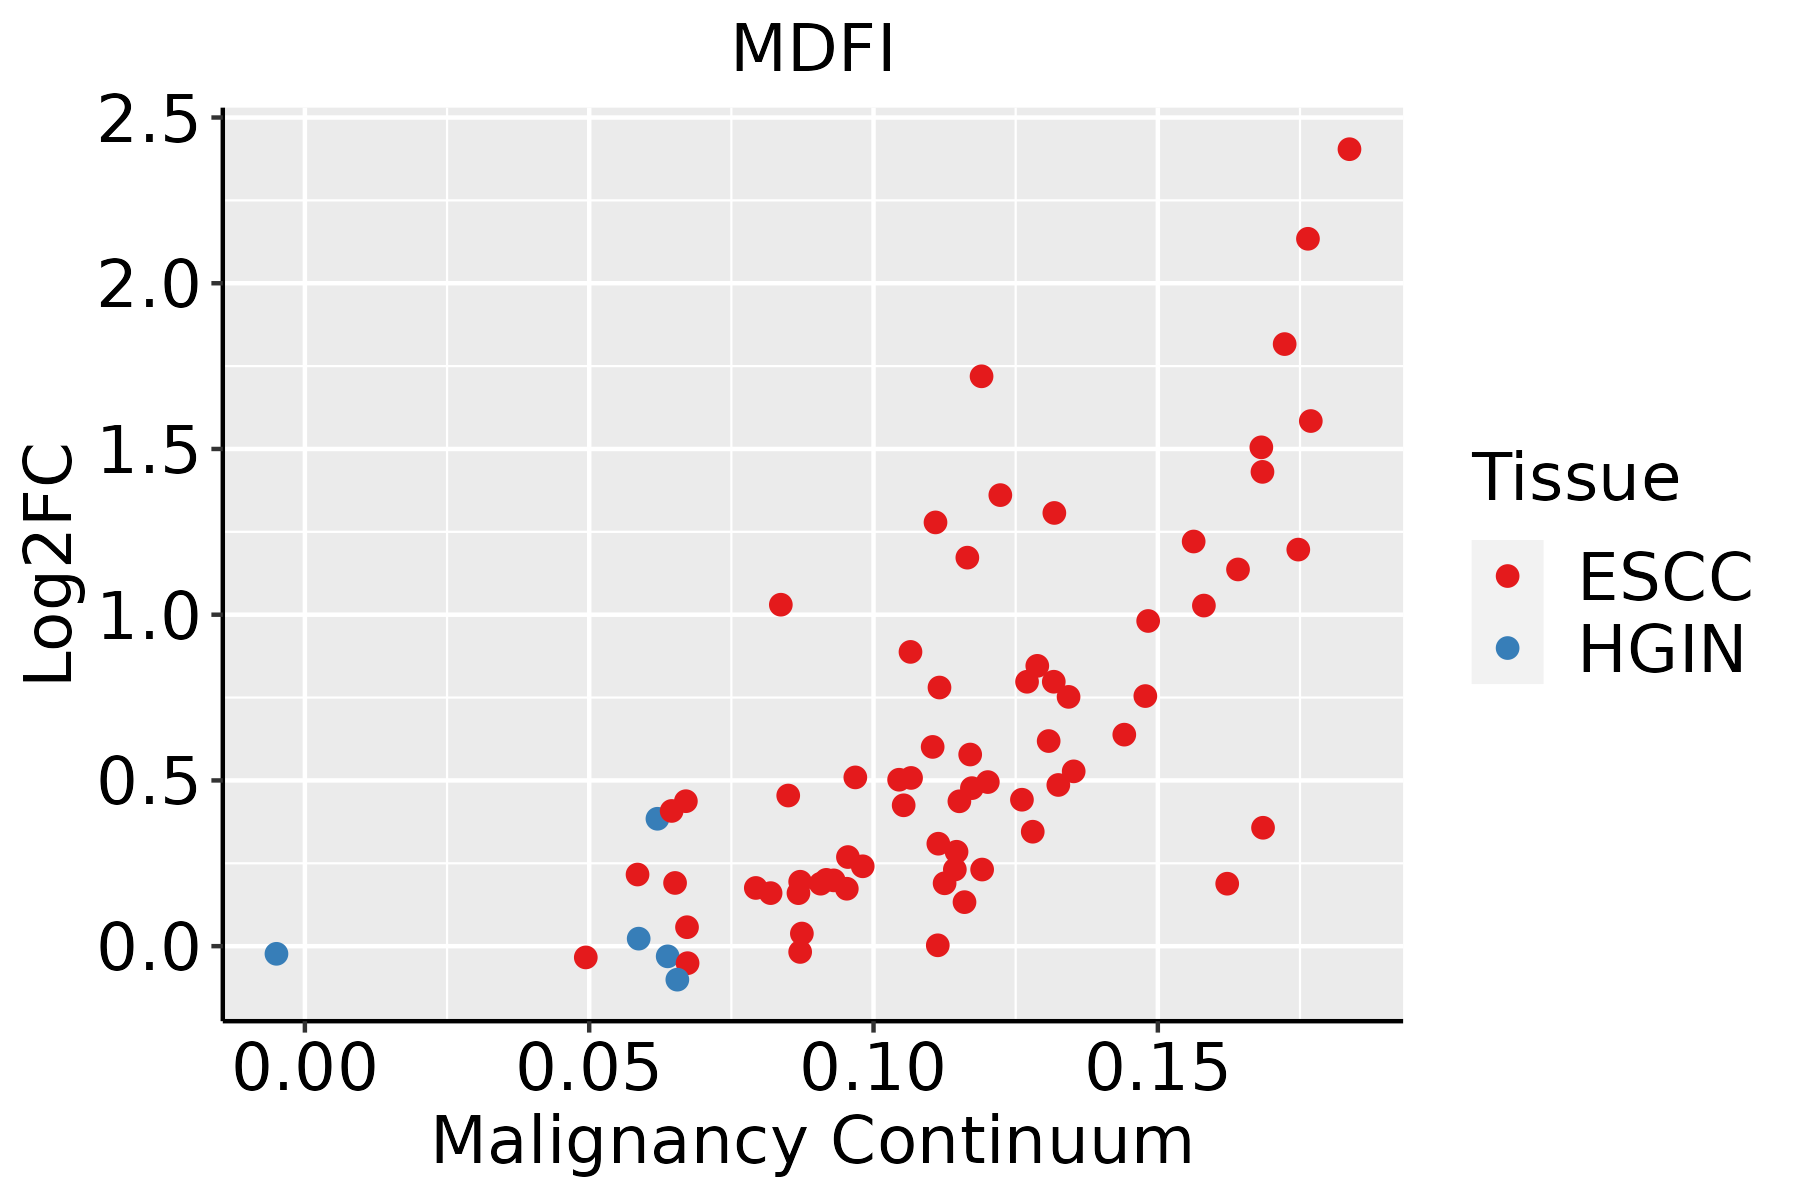
ESCC: Esophageal squamous cell carcinoma
HGIN: High-grade intraepithelial neoplasias
LGIN: Low-grade intraepithelial neoplasias
LiverThe image shows the transcriptomic changes along malignancy continuum.log2FC in expression of this searched gene in stem-like cells from each diseased tissue sample relative to stem-like cells in normal samples in each tissue plotted against the malignancy continuum. Samples are colored based on if they are from different disease stage.HCC: Hepatocellular carcinoma
NAFLD: Non-alcoholic fatty liver disease
Oral CavityThe image shows the transcriptomic changes along malignancy continuum.log2FC in expression of this searched gene in stem-like cells from each diseased tissue sample relative to stem-like cells in normal samples in each tissue plotted against the malignancy continuum. Samples are colored based on if they are from different disease stage.EOLP: Erosive Oral lichen planus
LP: leukoplakia
NEOLP: Non-erosive oral lichen planus
OSCC: Oral squamous cell carcinoma
SkinThe image shows the transcriptomic changes along malignancy continuum.log2FC in expression of this searched gene in stem-like cells from each diseased tissue sample relative to stem-like cells in normal samples in each tissue plotted against the malignancy continuum. Samples are colored based on if they are from different disease stage.
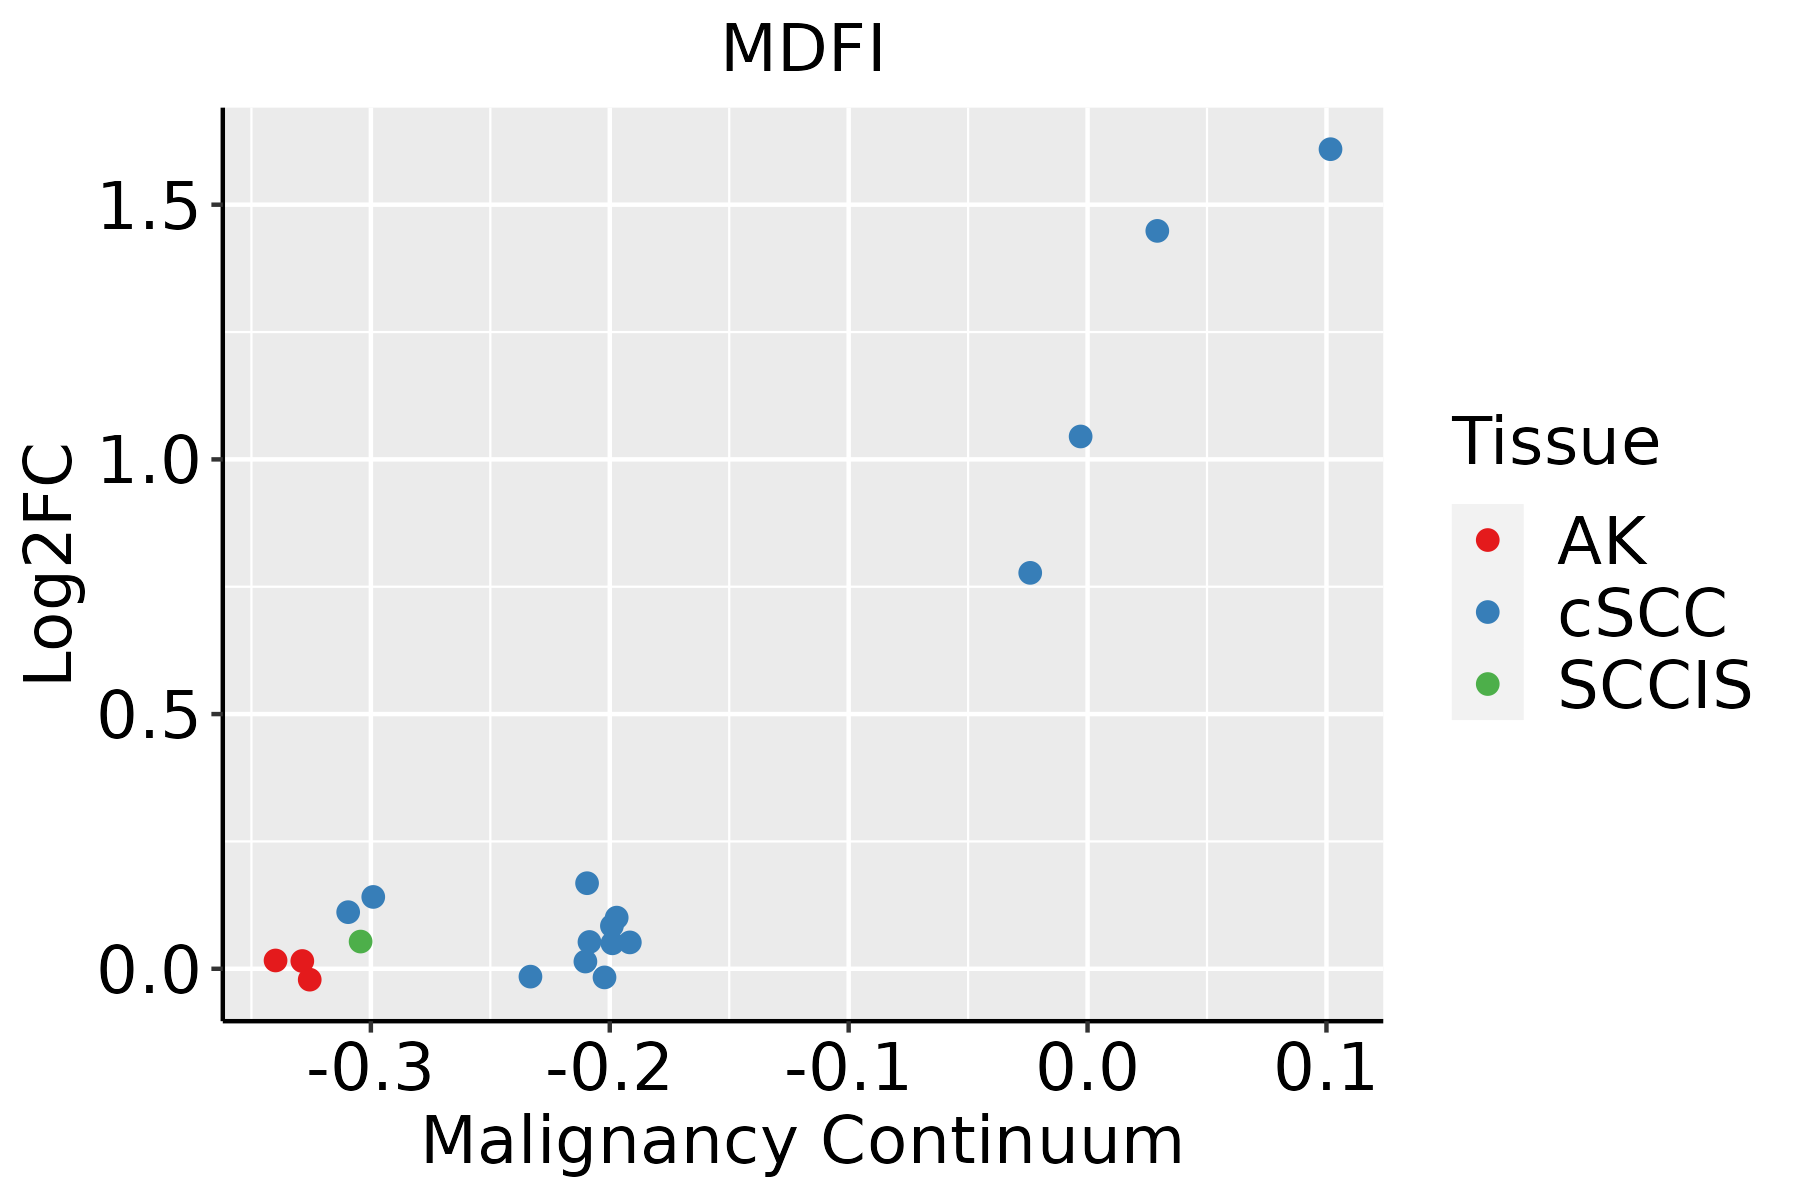
AK: Actinic keratosis
cSCC: Cutaneous squamous cell carcinoma
SCCIS:squamous cell carcinoma in situ
ThyroidThe image shows the transcriptomic changes along malignancy continuum.log2FC in expression of this searched gene in stem-like cells from each diseased tissue sample relative to stem-like cells in normal samples in each tissue plotted against the malignancy continuum. Samples are colored based on if they are from different disease stage.
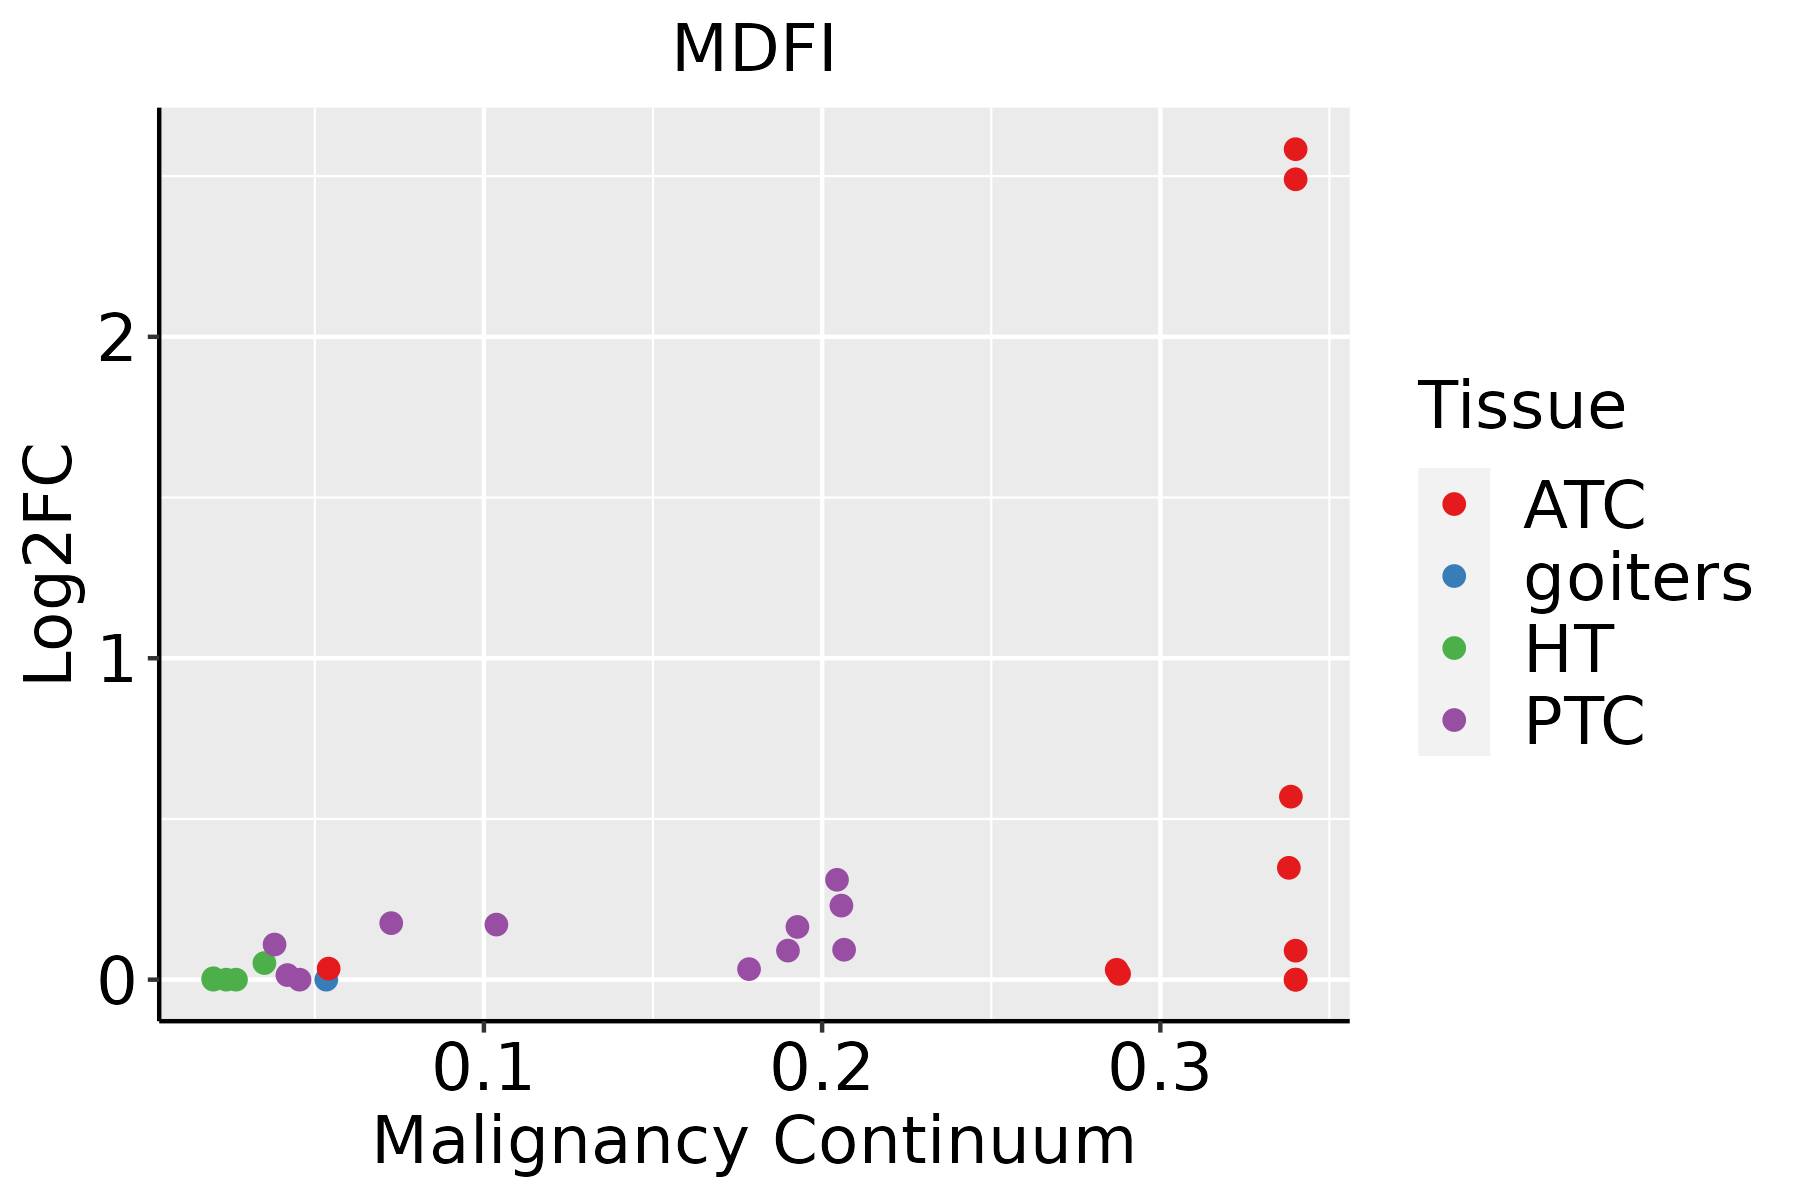
ATC: Anaplastic thyroid cancer
HT: Hashimoto's thyroiditis
PTC: Papillary thyroid cancer
∗log2FC in expression of this searched gene in stem-like cells from each diseased tissue sample relative to stem-like cells in normal samples in each tissue plotted against the malignancy continuum. Samples are colored based on if they are from different disease stage.

Top

Malignant transformation related pathway analysis

check buttonFind out the enriched GO biological processes and KEGG pathways involved in transition from healthy to precancer to cancer
check button Figure of enriched GO biological processes.
TissueDisease StageEnriched GO biological Processes
ColorectumADGO analysis - Figure of enriched GO biological processes: Top 15 enriched GO BP terms are showed in the bar plot of each disease state in each tissue. Each row represents a significant GO biological process which is colored according to the -log10(p.adjust).
ColorectumSERGO analysis - Figure of enriched GO biological processes: Top 15 enriched GO BP terms are showed in the bar plot of each disease state in each tissue. Each row represents a significant GO biological process which is colored according to the -log10(p.adjust).
ColorectumMSSGO analysis - Figure of enriched GO biological processes: Top 15 enriched GO BP terms are showed in the bar plot of each disease state in each tissue. Each row represents a significant GO biological process which is colored according to the -log10(p.adjust).
ColorectumMSI-HGO analysis - Figure of enriched GO biological processes: Top 15 enriched GO BP terms are showed in the bar plot of each disease state in each tissue. Each row represents a significant GO biological process which is colored according to the -log10(p.adjust).
ColorectumFAPGO analysis - Figure of enriched GO biological processes: Top 15 enriched GO BP terms are showed in the bar plot of each disease state in each tissue. Each row represents a significant GO biological process which is colored according to the -log10(p.adjust).
∗Top 15 enriched GO BP terms are showed in the bar plot of each disease state in each tissue. Each row represents a significant GO biological process which is colored according to the -log10(p.adjust).
Page: 1 2 3 4 5 6 7 8 9 

check button Enriched GO biological processes.
GO IDTissueDisease StageDescriptionGene RatioBg Ratiopvaluep.adjustCount
GO:019873825ThyroidATCcell-cell signaling by wnt234/6293446/187239.26e-178.25e-15234
GO:0046822112ThyroidATCregulation of nucleocytoplasmic transport75/6293106/187235.49e-153.62e-1375
GO:003011125ThyroidATCregulation of Wnt signaling pathway177/6293328/187231.83e-141.05e-12177
GO:190018023ThyroidATCregulation of protein localization to nucleus87/6293136/187233.94e-131.79e-1187
GO:001908023ThyroidATCviral gene expression64/629394/187238.44e-123.16e-1064
GO:004518532ThyroidATCmaintenance of protein location64/629394/187238.44e-123.16e-1064
GO:000170126ThyroidATCin utero embryonic development183/6293367/187236.62e-112.11e-09183
GO:001703822ThyroidATCprotein import110/6293206/187233.49e-098.09e-08110
GO:005079228ThyroidATCregulation of viral process90/6293164/187231.61e-083.23e-0790
GO:004852424ThyroidATCpositive regulation of viral process44/629365/187232.00e-083.93e-0744
GO:005117018ThyroidATCimport into nucleus86/6293159/187238.02e-081.40e-0686
GO:190382816ThyroidATCnegative regulation of cellular protein localization67/6293117/187231.23e-072.06e-0667
GO:000660617ThyroidATCprotein import into nucleus83/6293155/187232.38e-073.70e-0683
GO:005110027ThyroidATCnegative regulation of binding86/6293162/187232.41e-073.73e-0686
GO:190458918ThyroidATCregulation of protein import41/629363/187233.19e-074.76e-0641
GO:006145827ThyroidATCreproductive system development193/6293427/187233.32e-074.92e-06193
GO:003109826ThyroidATCstress-activated protein kinase signaling cascade120/6293247/187237.06e-079.46e-06120
GO:005123532ThyroidATCmaintenance of location152/6293327/187237.84e-071.04e-05152
GO:004860825ThyroidATCreproductive structure development190/6293424/187238.40e-071.11e-05190
GO:005140326ThyroidATCstress-activated MAPK cascade115/6293239/187232.17e-062.58e-05115
Page: 1 2 3 4 5 6 7 8 9 10 11 12 13 14 15 

check button Enriched KEGG pathways.
Pathway IDTissueDisease StageDescriptionGene RatioBg Ratiopvaluep.adjustqvalueCount
Page: 1 

Top

Cell-cell communication analysis

check buttonIdentification of potential cell-cell interactions between two cell types and their ligand-receptor pairs for different disease states
LigandReceptorLRpairPathwayTissueDisease Stage
Page: 1 

Top

Single-cell gene regulatory network inference analysis

check buttonFind out the significant the regulons (TFs) and the target genes of each regulon across cell types for different disease states
TFCell TypeTissueDisease StageTarget GeneRSSRegulon Activity
∗The dot plots of a searched regulon are shown for all cell subpopulations in each disease state of each tissue based on the regulon specific score inferred using pySCENIC and by calculating the average expression.
Page: 1 

Top

Somatic mutation of malignant transformation related genes

check buttonAnnotation of somatic variants for genes involved in malignant transformation
Hugo SymbolVariant ClassVariant ClassificationdbSNP RSHGVScHGVSpHGVSp ShortSWISSPROTBIOTYPESIFTPolyPhenTumor Sample BarcodeTissueHistologySexAgeStageTherapy TypesDrugsOutcome
MDFISNVMissense_Mutationc.522C>Gp.Cys174Trpp.C174WQ99750protein_codingdeleterious(0)probably_damaging(0.999)TCGA-AO-A0J6-01Breastbreast invasive carcinomaFemale<65I/IIChemotherapydoxorubicinSD
MDFIinsertionNonsense_Mutationnovelc.637_638insTGGGATTACAGGCATGAGCCACTGGGCCCGGCCGACTTCTCTTAp.Asp213ValfsTer6p.D213Vfs*6Q99750protein_codingTCGA-A2-A0CU-01Breastbreast invasive carcinomaFemale>=65I/IIHormone TherapytamoxiphenSD
MDFISNVMissense_Mutationc.500N>Ap.Cys167Tyrp.C167YQ99750protein_codingdeleterious(0)probably_damaging(0.988)TCGA-CK-4951-01Colorectumcolon adenocarcinomaFemale>=65I/IIUnknownUnknownPD
MDFISNVMissense_Mutationc.500N>Ap.Cys167Tyrp.C167YQ99750protein_codingdeleterious(0)probably_damaging(0.988)TCGA-AG-3909-01Colorectumrectum adenocarcinomaFemale>=65III/IVChemotherapyfolinicCR
MDFISNVMissense_Mutationrs770572756c.343N>Tp.Arg115Trpp.R115WQ99750protein_codingdeleterious(0.03)possibly_damaging(0.528)TCGA-AJ-A3BG-01Endometriumuterine corpus endometrioid carcinomaFemale>=65I/IIChemotherapycarboplatinPD
MDFISNVMissense_Mutationnovelc.446N>Gp.Lys149Argp.K149RQ99750protein_codingtolerated(0.17)benign(0.01)TCGA-AX-A3G9-01Endometriumuterine corpus endometrioid carcinomaFemale<65III/IVChemotherapycarboplatinSD
MDFISNVMissense_Mutationrs768704952c.382N>Tp.Arg128Trpp.R128WQ99750protein_codingdeleterious(0)probably_damaging(0.992)TCGA-B5-A11H-01Endometriumuterine corpus endometrioid carcinomaFemale>=65III/IVHormone TherapymegaceSD
MDFISNVMissense_Mutationrs753464609c.170N>Tp.Ala57Valp.A57VQ99750protein_codingtolerated(0.88)benign(0.003)TCGA-B5-A3FC-01Endometriumuterine corpus endometrioid carcinomaFemale<65I/IIUnknownUnknownSD
MDFISNVMissense_Mutationrs767995449c.409N>Ap.Ala137Thrp.A137TQ99750protein_codingtolerated(0.68)benign(0.009)TCGA-D1-A167-01Endometriumuterine corpus endometrioid carcinomaFemale>=65I/IIUnknownUnknownSD
MDFISNVMissense_Mutationnovelc.371N>Tp.Pro124Leup.P124LQ99750protein_codingdeleterious(0)benign(0.036)TCGA-EY-A215-01Endometriumuterine corpus endometrioid carcinomaFemale<65I/IIUnknownUnknownSD
Page: 1 2 

Top

Related drugs of malignant transformation related genes

check buttonIdentification of chemicals and drugs interact with genes involved in malignant transfromation
(DGIdb 4.0)
Entrez IDSymbolCategoryInteraction TypesDrug Claim NameDrug NamePMIDs
Page: 1