
|
|||||
|
 | |
| |
| |
| |
| |
| |
|
Gene: LCMT1 |
Gene summary for LCMT1 |
| Gene information | Species | Human | Gene symbol | LCMT1 | Gene ID | 51451 |
| Gene name | leucine carboxyl methyltransferase 1 | |
| Gene Alias | CGI-68 | |
| Cytomap | 16p12.1 | |
| Gene Type | protein-coding | GO ID | GO:0000070 | UniProtAcc | Q9UIC8 |
Top |
Malignant transformation analysis |
| Identification of the aberrant gene expression in precancerous and cancerous lesions by comparing the gene expression of stem-like cells in diseased tissues with normal stem cells |
| Entrez ID | Symbol | Replicates | Species | Organ | Tissue | Adj P-value | Log2FC | Malignancy |
| 51451 | LCMT1 | HTA11_347_2000001011 | Human | Colorectum | AD | 8.80e-12 | 5.38e-01 | -0.1954 |
| 51451 | LCMT1 | HTA11_696_2000001011 | Human | Colorectum | AD | 1.01e-02 | 2.86e-01 | -0.1464 |
| 51451 | LCMT1 | HTA11_1391_2000001011 | Human | Colorectum | AD | 8.77e-03 | 3.88e-01 | -0.059 |
| 51451 | LCMT1 | A015-C-203 | Human | Colorectum | FAP | 4.63e-04 | -1.44e-01 | -0.1294 |
| 51451 | LCMT1 | A002-C-201 | Human | Colorectum | FAP | 3.18e-03 | -1.54e-01 | 0.0324 |
| 51451 | LCMT1 | A002-C-205 | Human | Colorectum | FAP | 9.34e-05 | -8.06e-02 | -0.1236 |
| 51451 | LCMT1 | A015-C-006 | Human | Colorectum | FAP | 7.66e-03 | -1.32e-01 | -0.0994 |
| 51451 | LCMT1 | A002-C-114 | Human | Colorectum | FAP | 4.70e-04 | -1.07e-01 | -0.1561 |
| 51451 | LCMT1 | A015-C-104 | Human | Colorectum | FAP | 1.05e-05 | -1.75e-01 | -0.1899 |
| 51451 | LCMT1 | A002-C-016 | Human | Colorectum | FAP | 4.00e-02 | -1.16e-01 | 0.0521 |
| 51451 | LCMT1 | A015-C-002 | Human | Colorectum | FAP | 1.39e-02 | -1.96e-01 | -0.0763 |
| 51451 | LCMT1 | A002-C-116 | Human | Colorectum | FAP | 5.07e-06 | -1.58e-01 | -0.0452 |
| 51451 | LCMT1 | A018-E-020 | Human | Colorectum | FAP | 1.58e-04 | -1.72e-01 | -0.2034 |
| 51451 | LCMT1 | F034 | Human | Colorectum | FAP | 7.38e-03 | -1.14e-01 | -0.0665 |
| 51451 | LCMT1 | LZE4T | Human | Esophagus | ESCC | 6.75e-12 | 2.87e-01 | 0.0811 |
| 51451 | LCMT1 | LZE5T | Human | Esophagus | ESCC | 3.06e-05 | 1.95e-01 | 0.0514 |
| 51451 | LCMT1 | LZE7T | Human | Esophagus | ESCC | 8.69e-11 | 4.51e-01 | 0.0667 |
| 51451 | LCMT1 | LZE8T | Human | Esophagus | ESCC | 3.32e-10 | 3.30e-01 | 0.067 |
| 51451 | LCMT1 | LZE20T | Human | Esophagus | ESCC | 1.04e-02 | 9.06e-02 | 0.0662 |
| 51451 | LCMT1 | LZE22T | Human | Esophagus | ESCC | 1.58e-05 | 3.81e-01 | 0.068 |
| Page: 1 2 3 4 5 6 7 |
| Tissue | Expression Dynamics | Abbreviation |
| Colorectum (GSE201348) |  | FAP: Familial adenomatous polyposis |
| CRC: Colorectal cancer | ||
| Colorectum (HTA11) |  | AD: Adenomas |
| SER: Sessile serrated lesions | ||
| MSI-H: Microsatellite-high colorectal cancer | ||
| MSS: Microsatellite stable colorectal cancer | ||
| Esophagus | 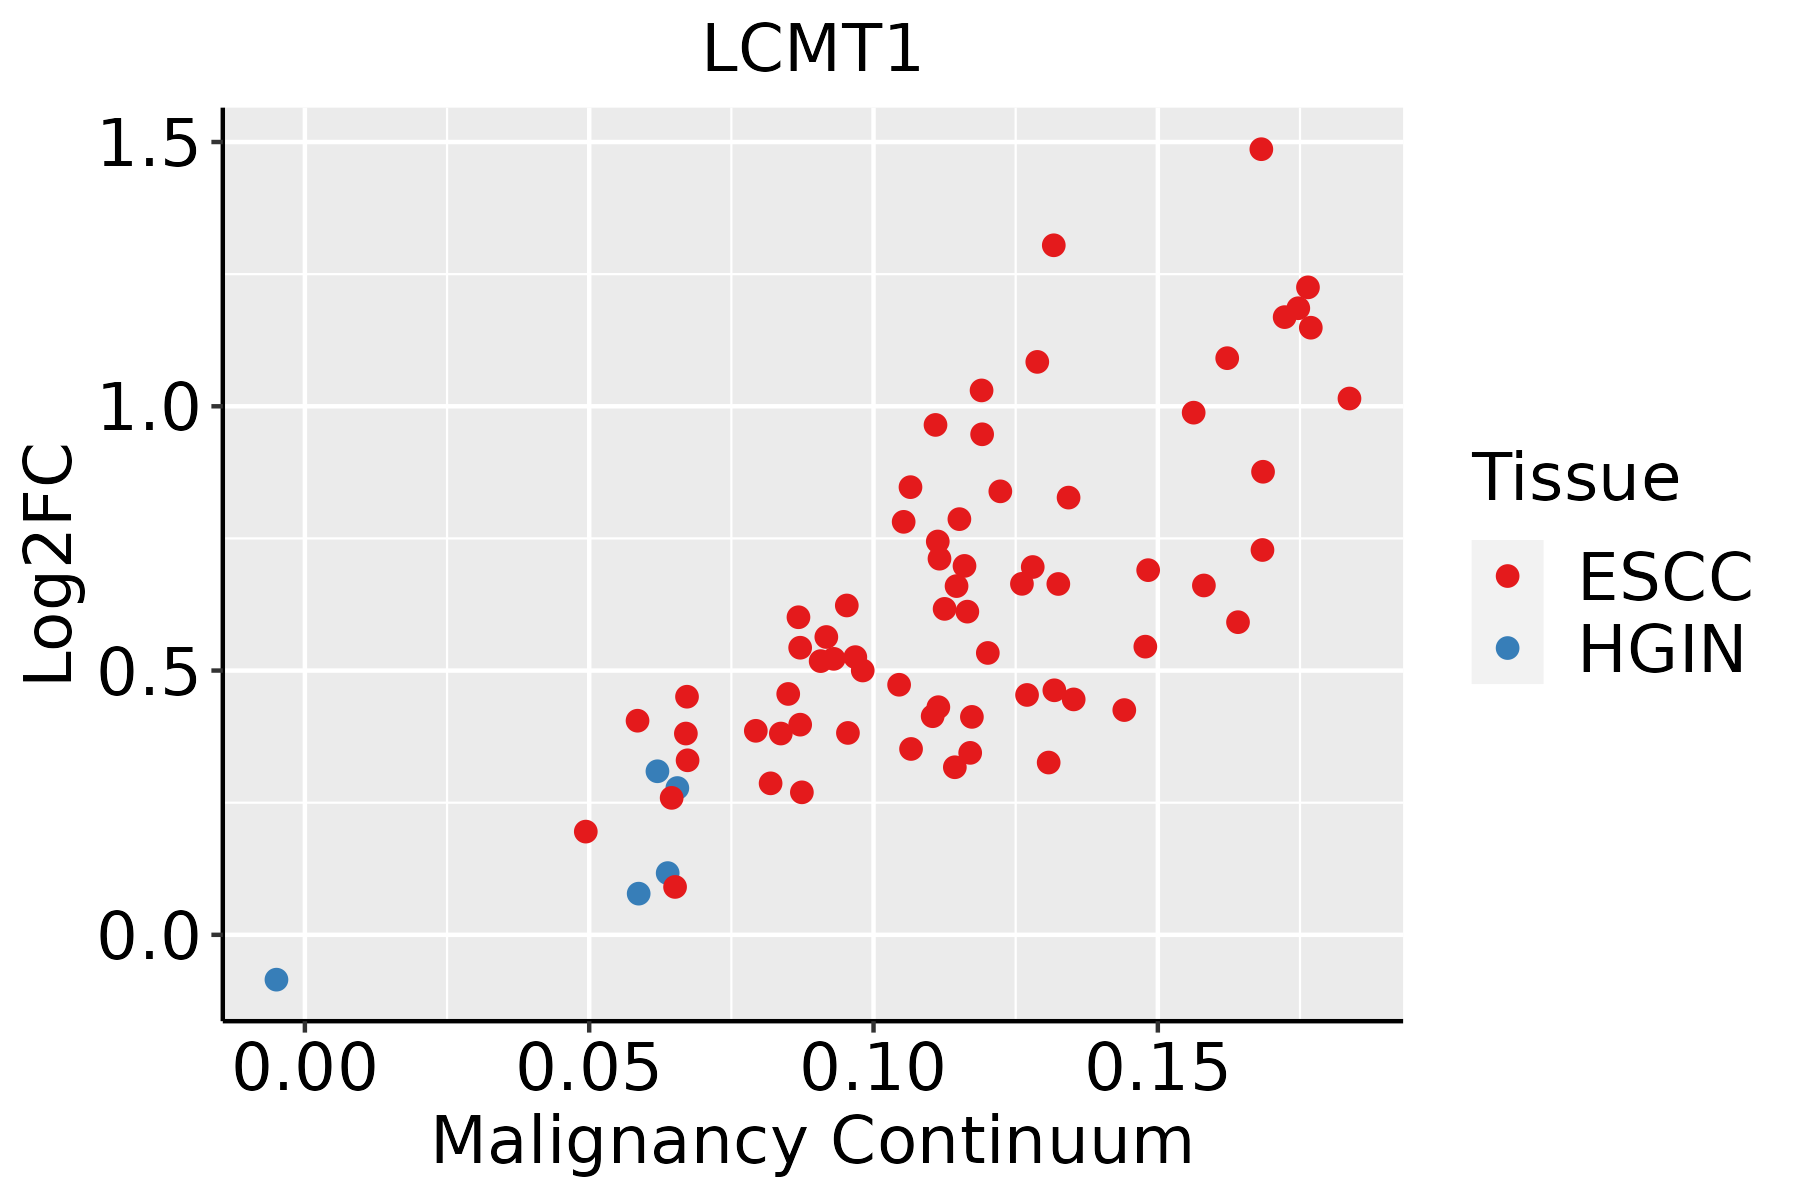 | ESCC: Esophageal squamous cell carcinoma |
| HGIN: High-grade intraepithelial neoplasias | ||
| LGIN: Low-grade intraepithelial neoplasias | ||
| Liver | 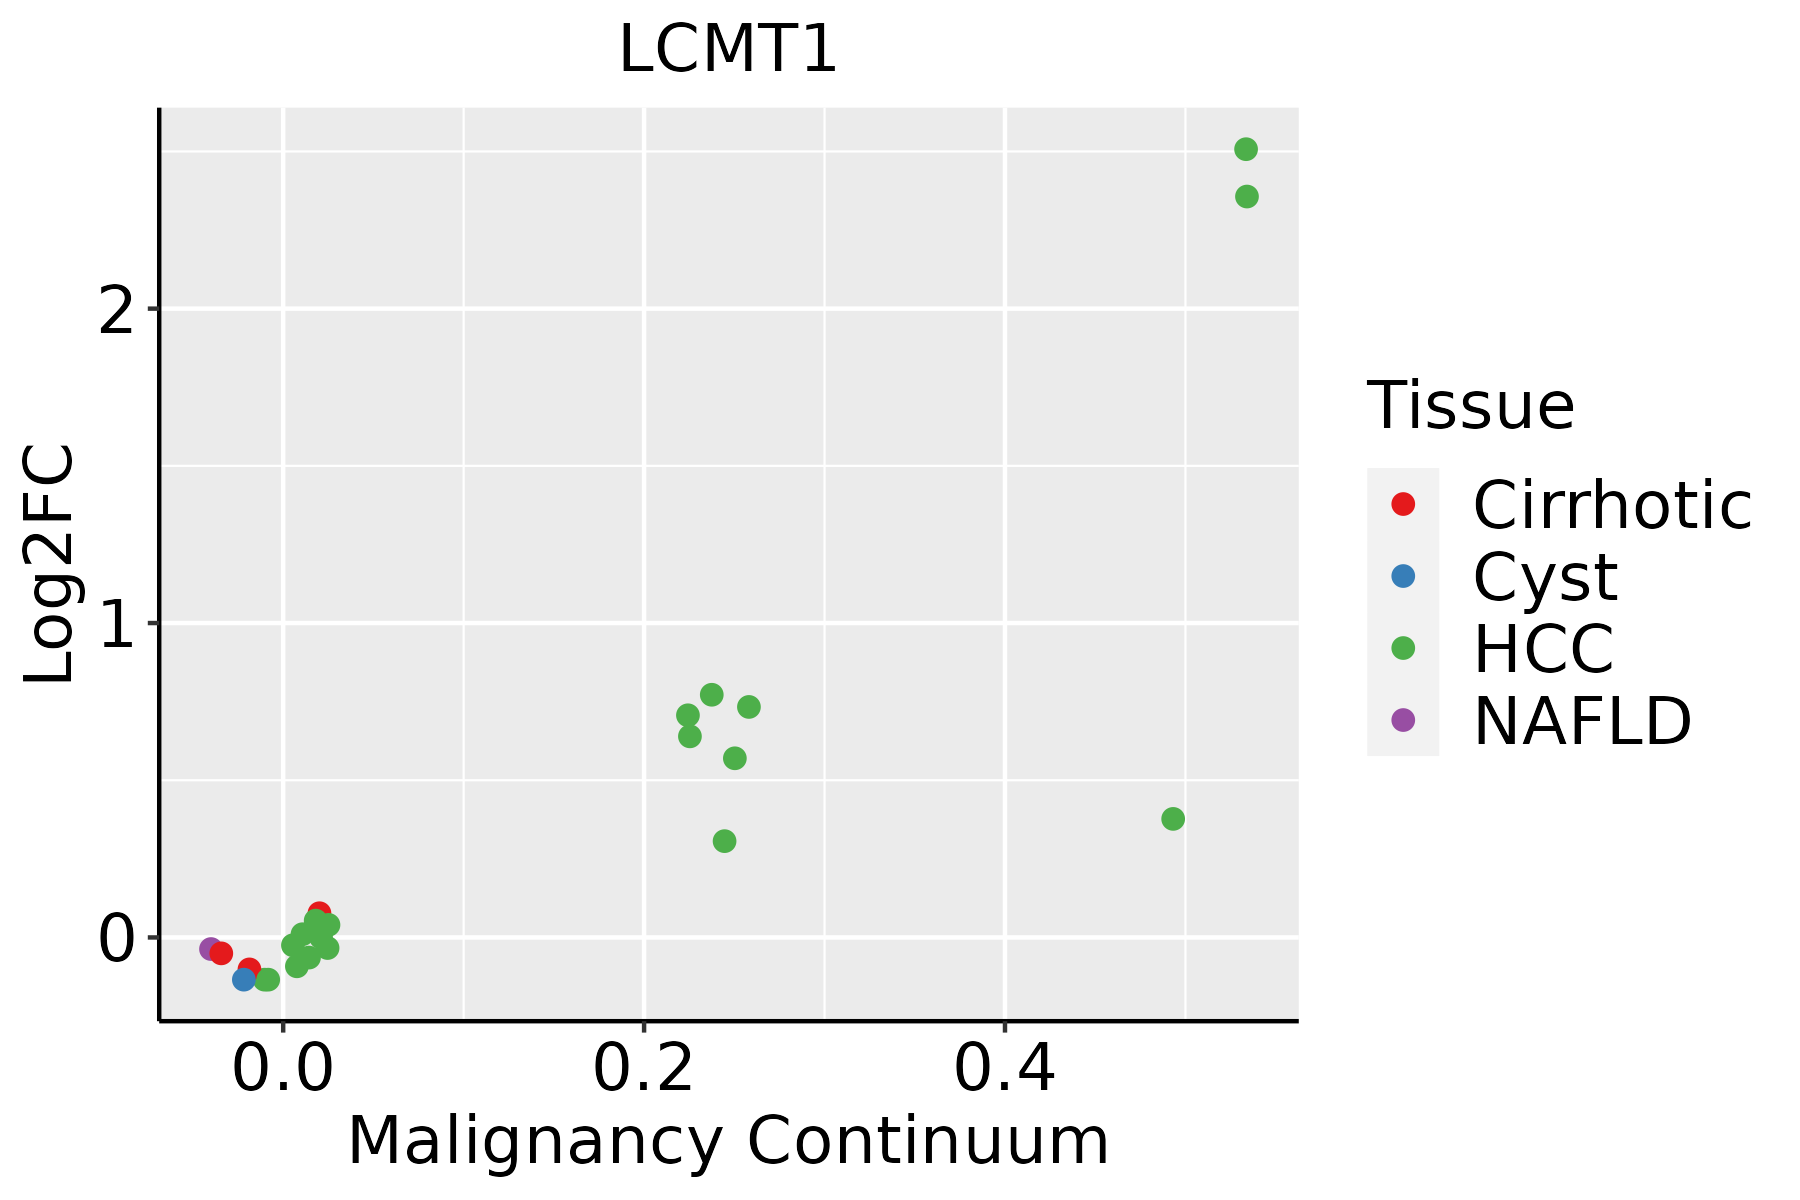 | HCC: Hepatocellular carcinoma |
| NAFLD: Non-alcoholic fatty liver disease | ||
| Oral Cavity | 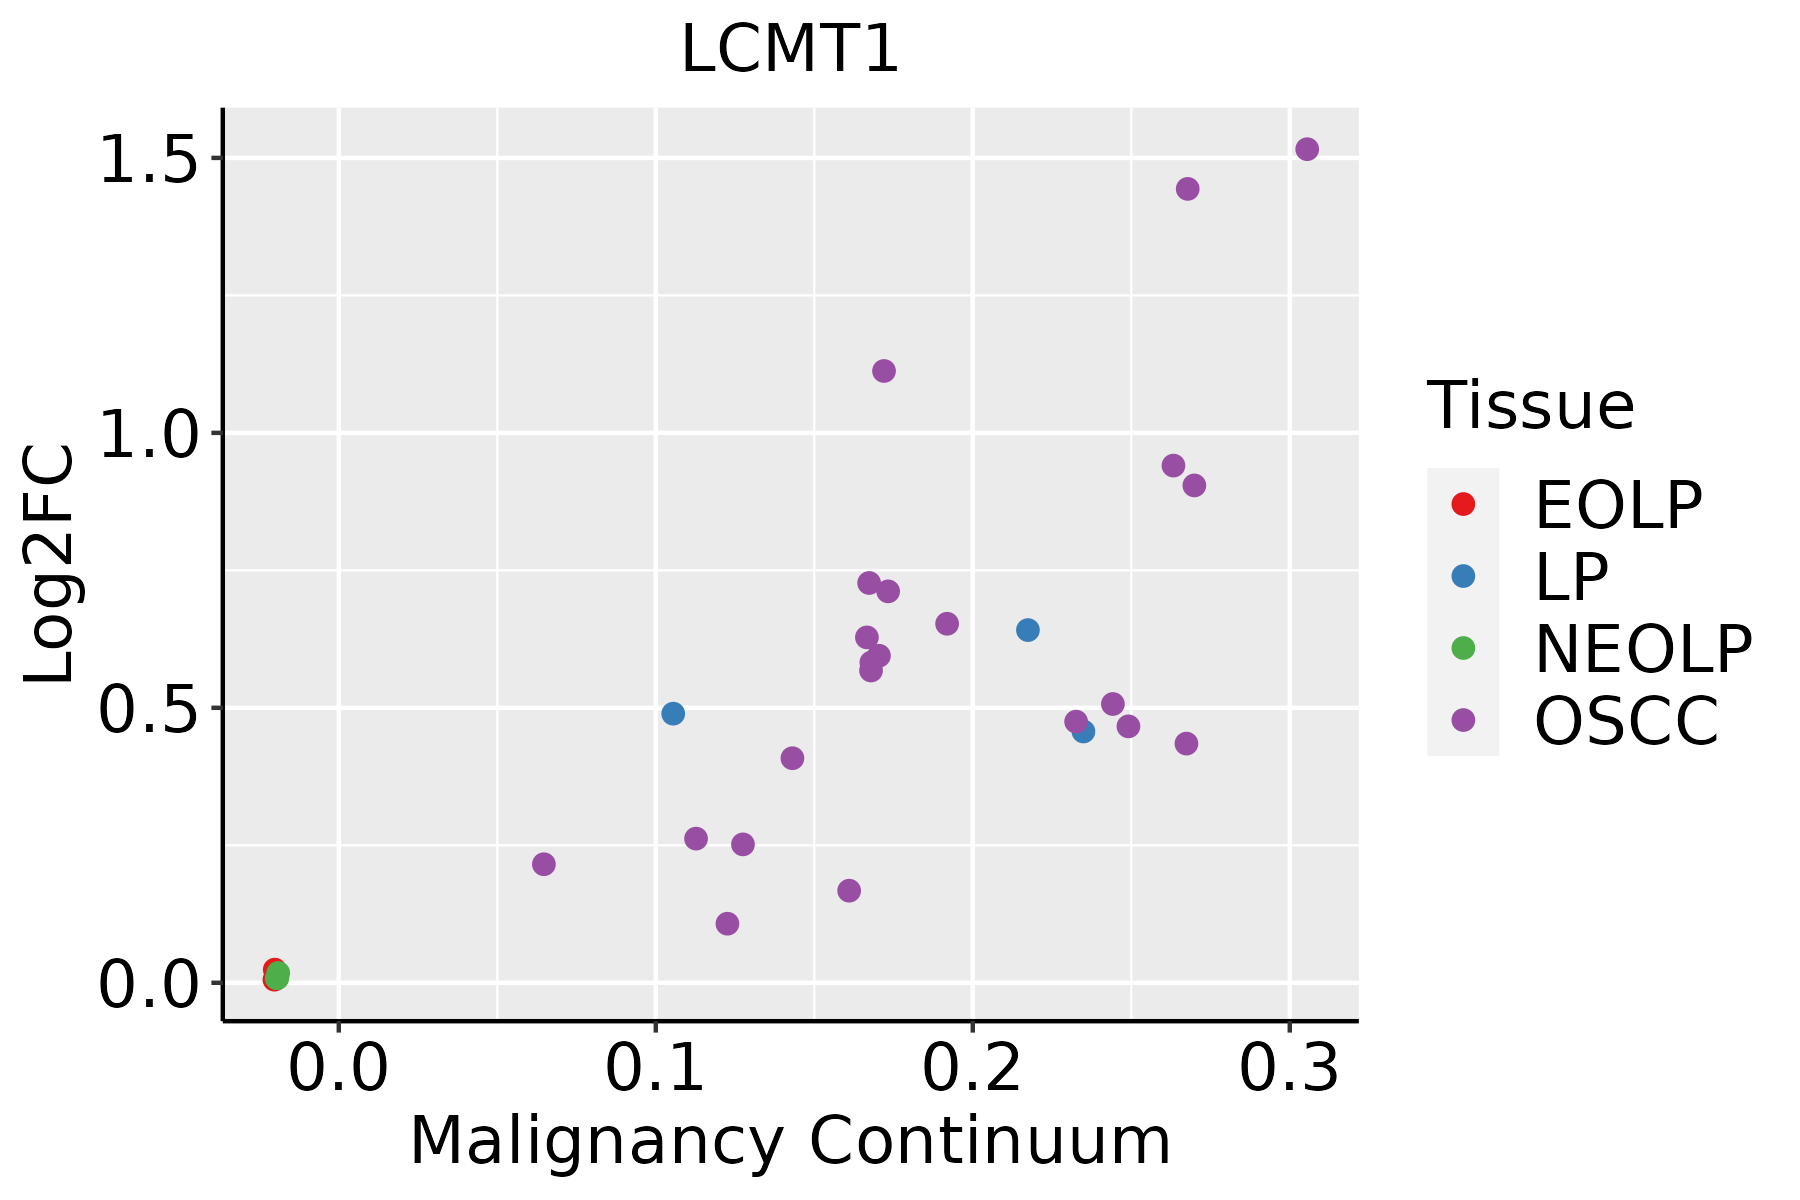 | EOLP: Erosive Oral lichen planus |
| LP: leukoplakia | ||
| NEOLP: Non-erosive oral lichen planus | ||
| OSCC: Oral squamous cell carcinoma | ||
| Skin | 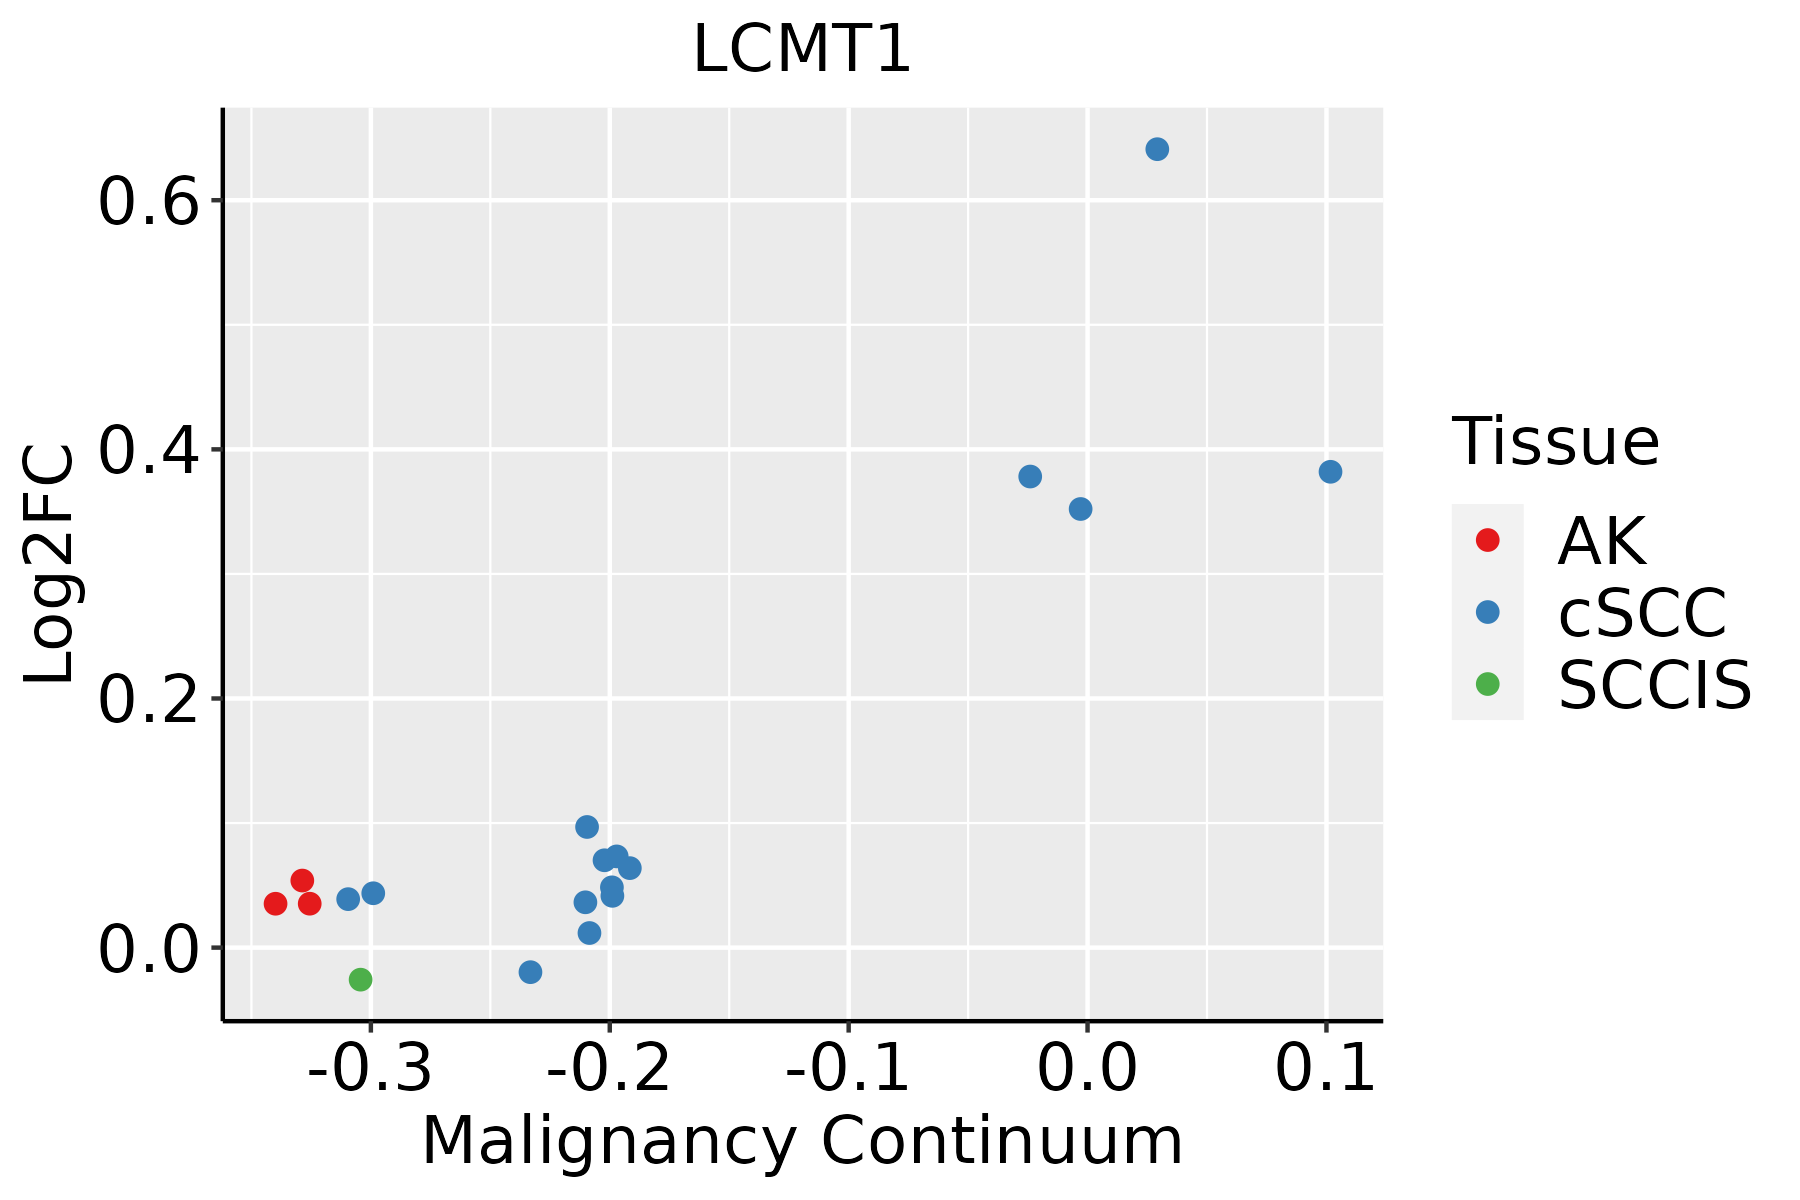 | AK: Actinic keratosis |
| cSCC: Cutaneous squamous cell carcinoma | ||
| SCCIS:squamous cell carcinoma in situ | ||
| Thyroid | 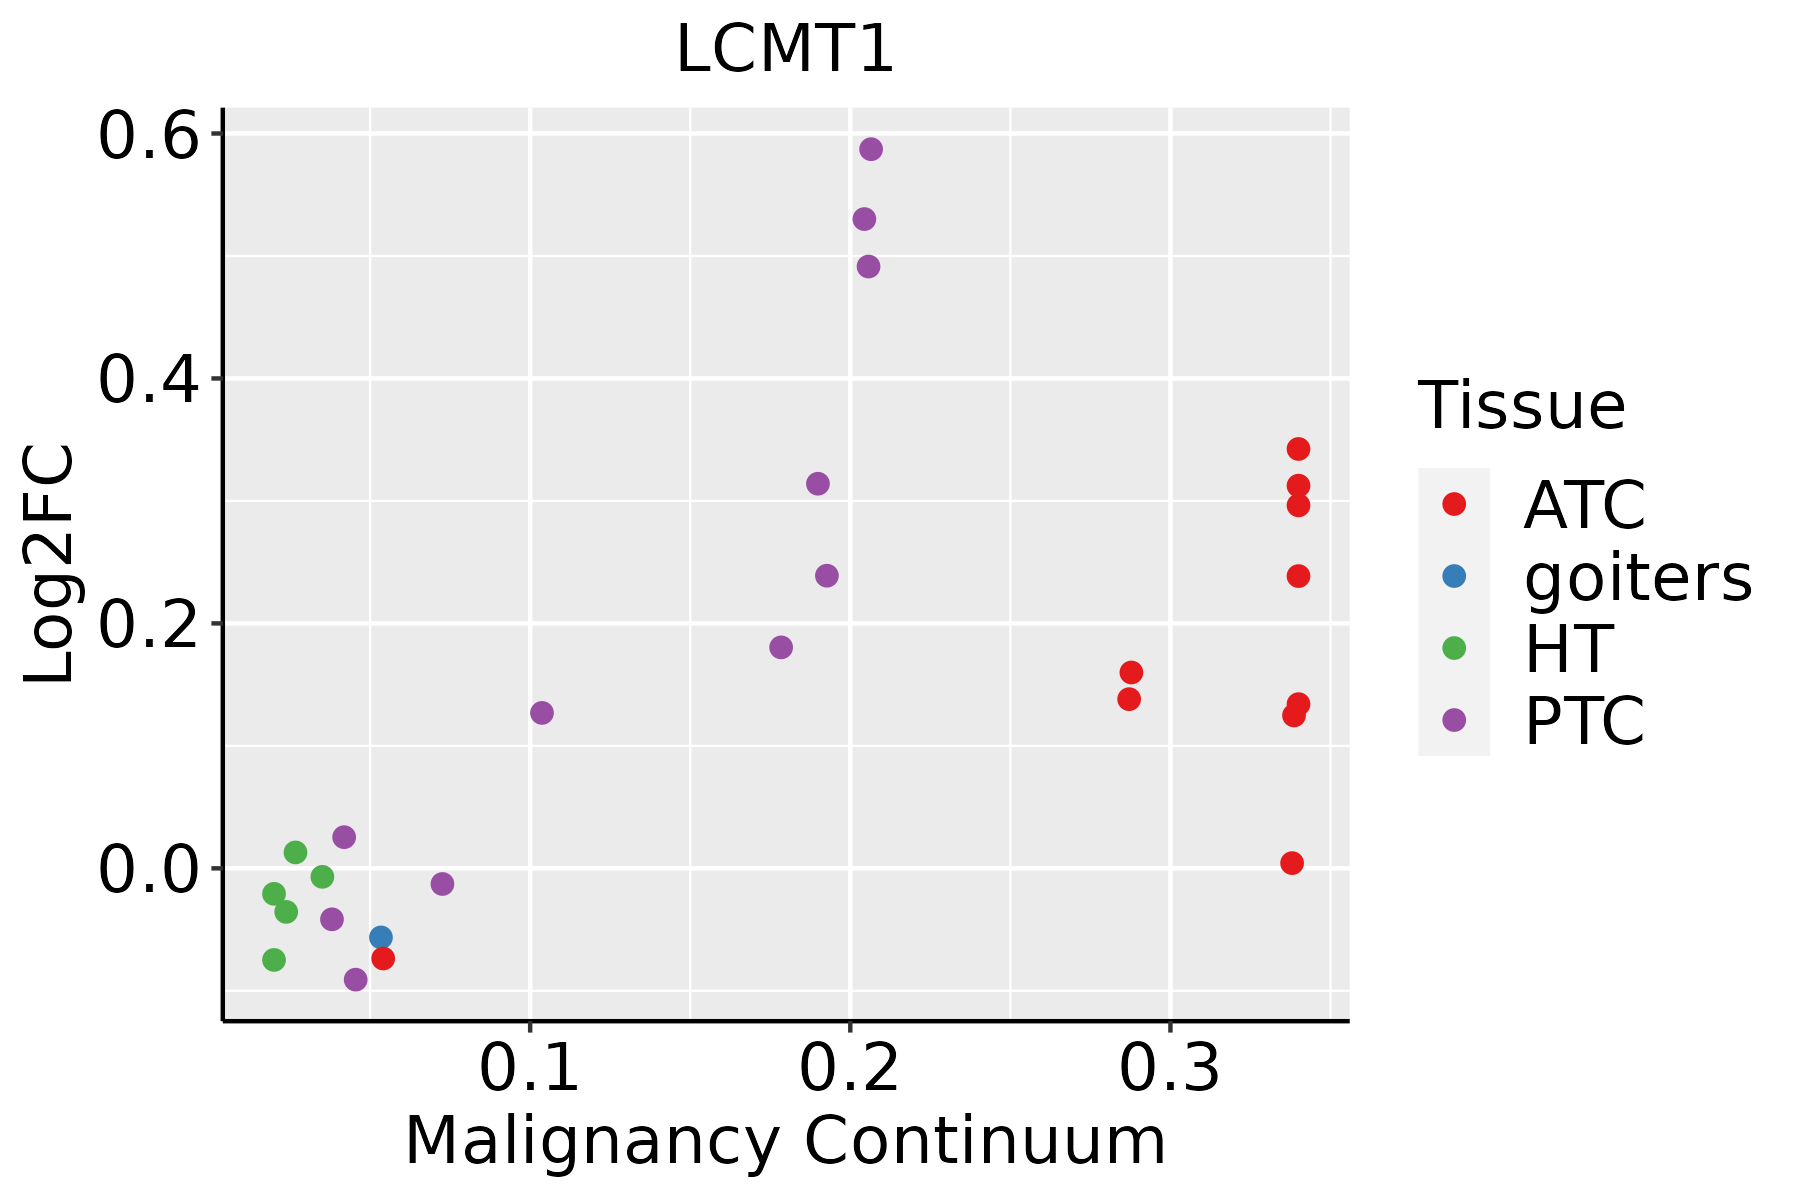 | ATC: Anaplastic thyroid cancer |
| HT: Hashimoto's thyroiditis | ||
| PTC: Papillary thyroid cancer |
| ∗log2FC in expression of this searched gene in stem-like cells from each diseased tissue sample relative to stem-like cells in normal samples in each tissue plotted against the malignancy continuum. Samples are colored based on if they are from different disease stage. |
Top |
Malignant transformation related pathway analysis |
| Find out the enriched GO biological processes and KEGG pathways involved in transition from healthy to precancer to cancer |
| Tissue | Disease Stage | Enriched GO biological Processes |
| Colorectum | AD |  |
| Colorectum | SER |  |
| Colorectum | MSS |  |
| Colorectum | MSI-H |  |
| Colorectum | FAP |  |
| ∗Top 15 enriched GO BP terms are showed in the bar plot of each disease state in each tissue. Each row represents a significant GO biological process which is colored according to the -log10(p.adjust). |
| Page: 1 2 3 4 5 6 7 8 9 |
| GO ID | Tissue | Disease Stage | Description | Gene Ratio | Bg Ratio | pvalue | p.adjust | Count |
| GO:00109653 | Skin | cSCC | regulation of mitotic sister chromatid separation | 38/4864 | 65/18723 | 3.03e-08 | 8.18e-07 | 38 |
| GO:190198714 | Skin | cSCC | regulation of cell cycle phase transition | 150/4864 | 390/18723 | 3.21e-08 | 8.61e-07 | 150 |
| GO:00070884 | Skin | cSCC | regulation of mitotic nuclear division | 55/4864 | 110/18723 | 5.62e-08 | 1.44e-06 | 55 |
| GO:00513063 | Skin | cSCC | mitotic sister chromatid separation | 38/4864 | 67/18723 | 9.27e-08 | 2.22e-06 | 38 |
| GO:00447843 | Skin | cSCC | metaphase/anaphase transition of cell cycle | 37/4864 | 65/18723 | 1.20e-07 | 2.79e-06 | 37 |
| GO:19020993 | Skin | cSCC | regulation of metaphase/anaphase transition of cell cycle | 36/4864 | 63/18723 | 1.55e-07 | 3.51e-06 | 36 |
| GO:00517832 | Skin | cSCC | regulation of nuclear division | 64/4864 | 139/18723 | 2.49e-07 | 5.25e-06 | 64 |
| GO:20012514 | Skin | cSCC | negative regulation of chromosome organization | 43/4864 | 86/18723 | 1.53e-06 | 2.61e-05 | 43 |
| GO:190199114 | Skin | cSCC | negative regulation of mitotic cell cycle phase transition | 75/4864 | 179/18723 | 2.38e-06 | 3.84e-05 | 75 |
| GO:00330473 | Skin | cSCC | regulation of mitotic sister chromatid segregation | 27/4864 | 46/18723 | 2.71e-06 | 4.30e-05 | 27 |
| GO:004593014 | Skin | cSCC | negative regulation of mitotic cell cycle | 93/4864 | 235/18723 | 3.14e-06 | 4.89e-05 | 93 |
| GO:004578613 | Skin | cSCC | negative regulation of cell cycle | 140/4864 | 385/18723 | 3.64e-06 | 5.50e-05 | 140 |
| GO:00458394 | Skin | cSCC | negative regulation of mitotic nuclear division | 27/4864 | 48/18723 | 8.24e-06 | 1.10e-04 | 27 |
| GO:00517844 | Skin | cSCC | negative regulation of nuclear division | 30/4864 | 56/18723 | 9.93e-06 | 1.30e-04 | 30 |
| GO:00513043 | Skin | cSCC | chromosome separation | 44/4864 | 96/18723 | 2.05e-05 | 2.40e-04 | 44 |
| GO:000008611 | Skin | cSCC | G2/M transition of mitotic cell cycle | 58/4864 | 137/18723 | 2.19e-05 | 2.54e-04 | 58 |
| GO:00458413 | Skin | cSCC | negative regulation of mitotic metaphase/anaphase transition | 23/4864 | 40/18723 | 2.37e-05 | 2.72e-04 | 23 |
| GO:190198812 | Skin | cSCC | negative regulation of cell cycle phase transition | 94/4864 | 249/18723 | 2.65e-05 | 3.00e-04 | 94 |
| GO:001094812 | Skin | cSCC | negative regulation of cell cycle process | 108/4864 | 294/18723 | 2.75e-05 | 3.09e-04 | 108 |
| GO:00070943 | Skin | cSCC | mitotic spindle assembly checkpoint | 22/4864 | 38/18723 | 3.07e-05 | 3.40e-04 | 22 |
| Page: 1 2 3 4 5 6 7 8 9 10 11 12 13 14 15 16 17 18 19 20 |
| Pathway ID | Tissue | Disease Stage | Description | Gene Ratio | Bg Ratio | pvalue | p.adjust | qvalue | Count |
| Page: 1 |
Top |
Cell-cell communication analysis |
| Identification of potential cell-cell interactions between two cell types and their ligand-receptor pairs for different disease states |
| Ligand | Receptor | LRpair | Pathway | Tissue | Disease Stage |
| Page: 1 |
Top |
Single-cell gene regulatory network inference analysis |
| Find out the significant the regulons (TFs) and the target genes of each regulon across cell types for different disease states |
| TF | Cell Type | Tissue | Disease Stage | Target Gene | RSS | Regulon Activity |
| ∗The dot plots of a searched regulon are shown for all cell subpopulations in each disease state of each tissue based on the regulon specific score inferred using pySCENIC and by calculating the average expression. |
| Page: 1 |
Top |
Somatic mutation of malignant transformation related genes |
| Annotation of somatic variants for genes involved in malignant transformation |
| Hugo Symbol | Variant Class | Variant Classification | dbSNP RS | HGVSc | HGVSp | HGVSp Short | SWISSPROT | BIOTYPE | SIFT | PolyPhen | Tumor Sample Barcode | Tissue | Histology | Sex | Age | Stage | Therapy Types | Drugs | Outcome |
| LCMT1 | SNV | Missense_Mutation | rs189072726 | c.835N>A | p.Val279Ile | p.V279I | Q9UIC8 | protein_coding | tolerated(0.46) | benign(0) | TCGA-B6-A0RT-01 | Breast | breast invasive carcinoma | Female | <65 | III/IV | Unknown | Unknown | SD |
| LCMT1 | SNV | Missense_Mutation | c.910N>A | p.Glu304Lys | p.E304K | Q9UIC8 | protein_coding | deleterious(0) | probably_damaging(0.999) | TCGA-C5-A1BN-01 | Cervix | cervical & endocervical cancer | Female | <65 | I/II | Chemotherapy | cisplatin | PD | |
| LCMT1 | SNV | Missense_Mutation | c.514N>T | p.Leu172Phe | p.L172F | Q9UIC8 | protein_coding | deleterious(0) | probably_damaging(0.999) | TCGA-DS-A0VN-01 | Cervix | cervical & endocervical cancer | Female | <65 | I/II | Chemotherapy | cisplatin | SD | |
| LCMT1 | SNV | Missense_Mutation | c.290T>A | p.Leu97His | p.L97H | Q9UIC8 | protein_coding | deleterious(0) | probably_damaging(0.999) | TCGA-D5-5541-01 | Colorectum | colon adenocarcinoma | Male | <65 | III/IV | Chemotherapy | calcium | SD | |
| LCMT1 | SNV | Missense_Mutation | c.233G>A | p.Ser78Asn | p.S78N | Q9UIC8 | protein_coding | tolerated(0.56) | benign(0) | TCGA-NH-A5IV-01 | Colorectum | colon adenocarcinoma | Female | >=65 | I/II | Unknown | Unknown | SD | |
| LCMT1 | SNV | Missense_Mutation | c.206G>T | p.Gly69Val | p.G69V | Q9UIC8 | protein_coding | deleterious(0) | probably_damaging(1) | TCGA-AG-3890-01 | Colorectum | rectum adenocarcinoma | Male | <65 | I/II | Unknown | Unknown | SD | |
| LCMT1 | SNV | Missense_Mutation | novel | c.462N>T | p.Gln154His | p.Q154H | Q9UIC8 | protein_coding | tolerated(0.18) | benign(0.415) | TCGA-A5-A0G2-01 | Endometrium | uterine corpus endometrioid carcinoma | Female | <65 | III/IV | Unknown | Unknown | SD |
| LCMT1 | SNV | Missense_Mutation | rs568089895 | c.799N>T | p.Arg267Trp | p.R267W | Q9UIC8 | protein_coding | deleterious(0) | probably_damaging(1) | TCGA-AX-A06F-01 | Endometrium | uterine corpus endometrioid carcinoma | Female | <65 | III/IV | Chemotherapy | carboplatin | SD |
| LCMT1 | SNV | Missense_Mutation | rs189072726 | c.835N>A | p.Val279Ile | p.V279I | Q9UIC8 | protein_coding | tolerated(0.46) | benign(0) | TCGA-AX-A0J1-01 | Endometrium | uterine corpus endometrioid carcinoma | Female | >=65 | I/II | Unknown | Unknown | SD |
| LCMT1 | SNV | Missense_Mutation | novel | c.327N>T | p.Lys109Asn | p.K109N | Q9UIC8 | protein_coding | deleterious(0) | probably_damaging(0.984) | TCGA-AX-A1CE-01 | Endometrium | uterine corpus endometrioid carcinoma | Female | <65 | I/II | Unspecific | Paclitaxel | SD |
| Page: 1 2 3 |
Top |
Related drugs of malignant transformation related genes |
| Identification of chemicals and drugs interact with genes involved in malignant transfromation |
| (DGIdb 4.0) |
| Entrez ID | Symbol | Category | Interaction Types | Drug Claim Name | Drug Name | PMIDs |
| Page: 1 |

Copyright 2023-Present -The University of Texas Health Science Center at Houston |