
|
|||||
|
 | |
| |
| |
| |
| |
| |
|
Gene: LAPTM5 |
Gene summary for LAPTM5 |
| Gene information | Species | Human | Gene symbol | LAPTM5 | Gene ID | 7805 |
| Gene name | lysosomal protein transmembrane 5 | |
| Gene Alias | CLAST6 | |
| Cytomap | 1p35.2 | |
| Gene Type | protein-coding | GO ID | GO:0000165 | UniProtAcc | Q13571 |
Top |
Malignant transformation analysis |
| Identification of the aberrant gene expression in precancerous and cancerous lesions by comparing the gene expression of stem-like cells in diseased tissues with normal stem cells |
| Entrez ID | Symbol | Replicates | Species | Organ | Tissue | Adj P-value | Log2FC | Malignancy |
| 7805 | LAPTM5 | M1 | Human | Breast | IDC | 7.41e-16 | 5.22e-01 | 0.1577 |
| 7805 | LAPTM5 | NCCBC11 | Human | Breast | DCIS | 8.25e-03 | 4.45e-01 | 0.1232 |
| 7805 | LAPTM5 | NCCBC14 | Human | Breast | DCIS | 1.51e-06 | 3.87e-01 | 0.2021 |
| 7805 | LAPTM5 | NCCBC3 | Human | Breast | DCIS | 6.01e-31 | 7.91e-01 | 0.1198 |
| 7805 | LAPTM5 | NCCBC5 | Human | Breast | DCIS | 2.35e-11 | 4.84e-01 | 0.2046 |
| 7805 | LAPTM5 | P1 | Human | Breast | IDC | 1.32e-05 | 3.16e-01 | 0.1527 |
| 7805 | LAPTM5 | P2 | Human | Breast | IDC | 6.11e-03 | 3.26e-01 | 0.21 |
| 7805 | LAPTM5 | CA_HPV_3 | Human | Cervix | CC | 2.89e-03 | -3.74e-01 | 0.0414 |
| 7805 | LAPTM5 | CCI_1 | Human | Cervix | CC | 1.64e-10 | -8.69e-01 | 0.528 |
| 7805 | LAPTM5 | CCI_2 | Human | Cervix | CC | 1.76e-07 | -8.47e-01 | 0.5249 |
| 7805 | LAPTM5 | CCI_3 | Human | Cervix | CC | 3.83e-10 | -8.22e-01 | 0.516 |
| 7805 | LAPTM5 | CCII_1 | Human | Cervix | CC | 5.72e-17 | -8.58e-01 | 0.3249 |
| 7805 | LAPTM5 | Tumor | Human | Cervix | CC | 1.02e-46 | -8.52e-01 | 0.1241 |
| 7805 | LAPTM5 | sample1 | Human | Cervix | CC | 1.90e-11 | -8.14e-01 | 0.0959 |
| 7805 | LAPTM5 | sample3 | Human | Cervix | CC | 9.39e-44 | -8.55e-01 | 0.1387 |
| 7805 | LAPTM5 | H2 | Human | Cervix | HSIL_HPV | 3.95e-33 | -8.12e-01 | 0.0632 |
| 7805 | LAPTM5 | L1 | Human | Cervix | CC | 1.90e-05 | -6.03e-01 | 0.0802 |
| 7805 | LAPTM5 | T1 | Human | Cervix | CC | 2.20e-28 | -8.41e-01 | 0.0918 |
| 7805 | LAPTM5 | T2 | Human | Cervix | CC | 4.23e-09 | -8.69e-01 | 0.0709 |
| 7805 | LAPTM5 | T3 | Human | Cervix | CC | 4.20e-39 | -8.55e-01 | 0.1389 |
| Page: 1 2 3 4 |
| Tissue | Expression Dynamics | Abbreviation |
| Breast | 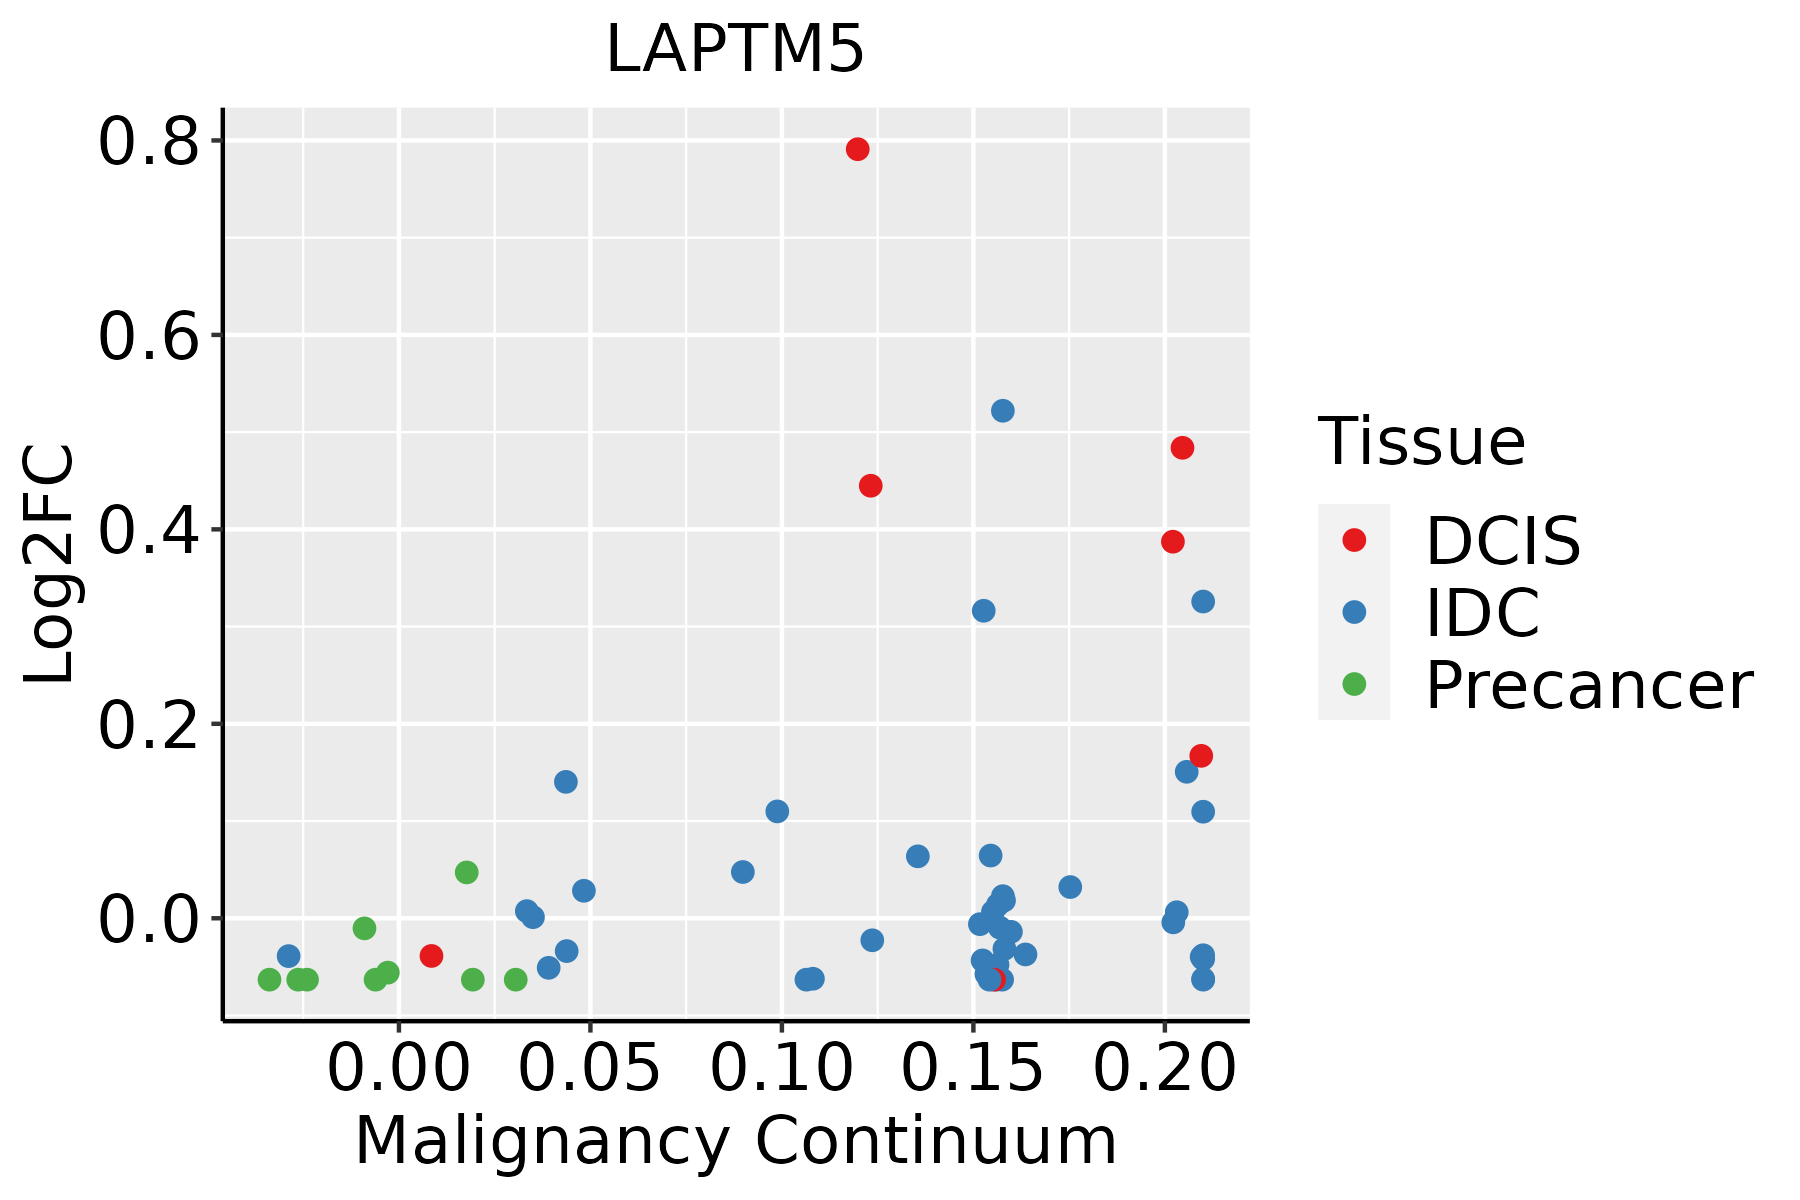 | IDC: Invasive ductal carcinoma |
| DCIS: Ductal carcinoma in situ | ||
| Precancer(BRCA1-mut): Precancerous lesion from BRCA1 mutation carriers | ||
| Cervix | 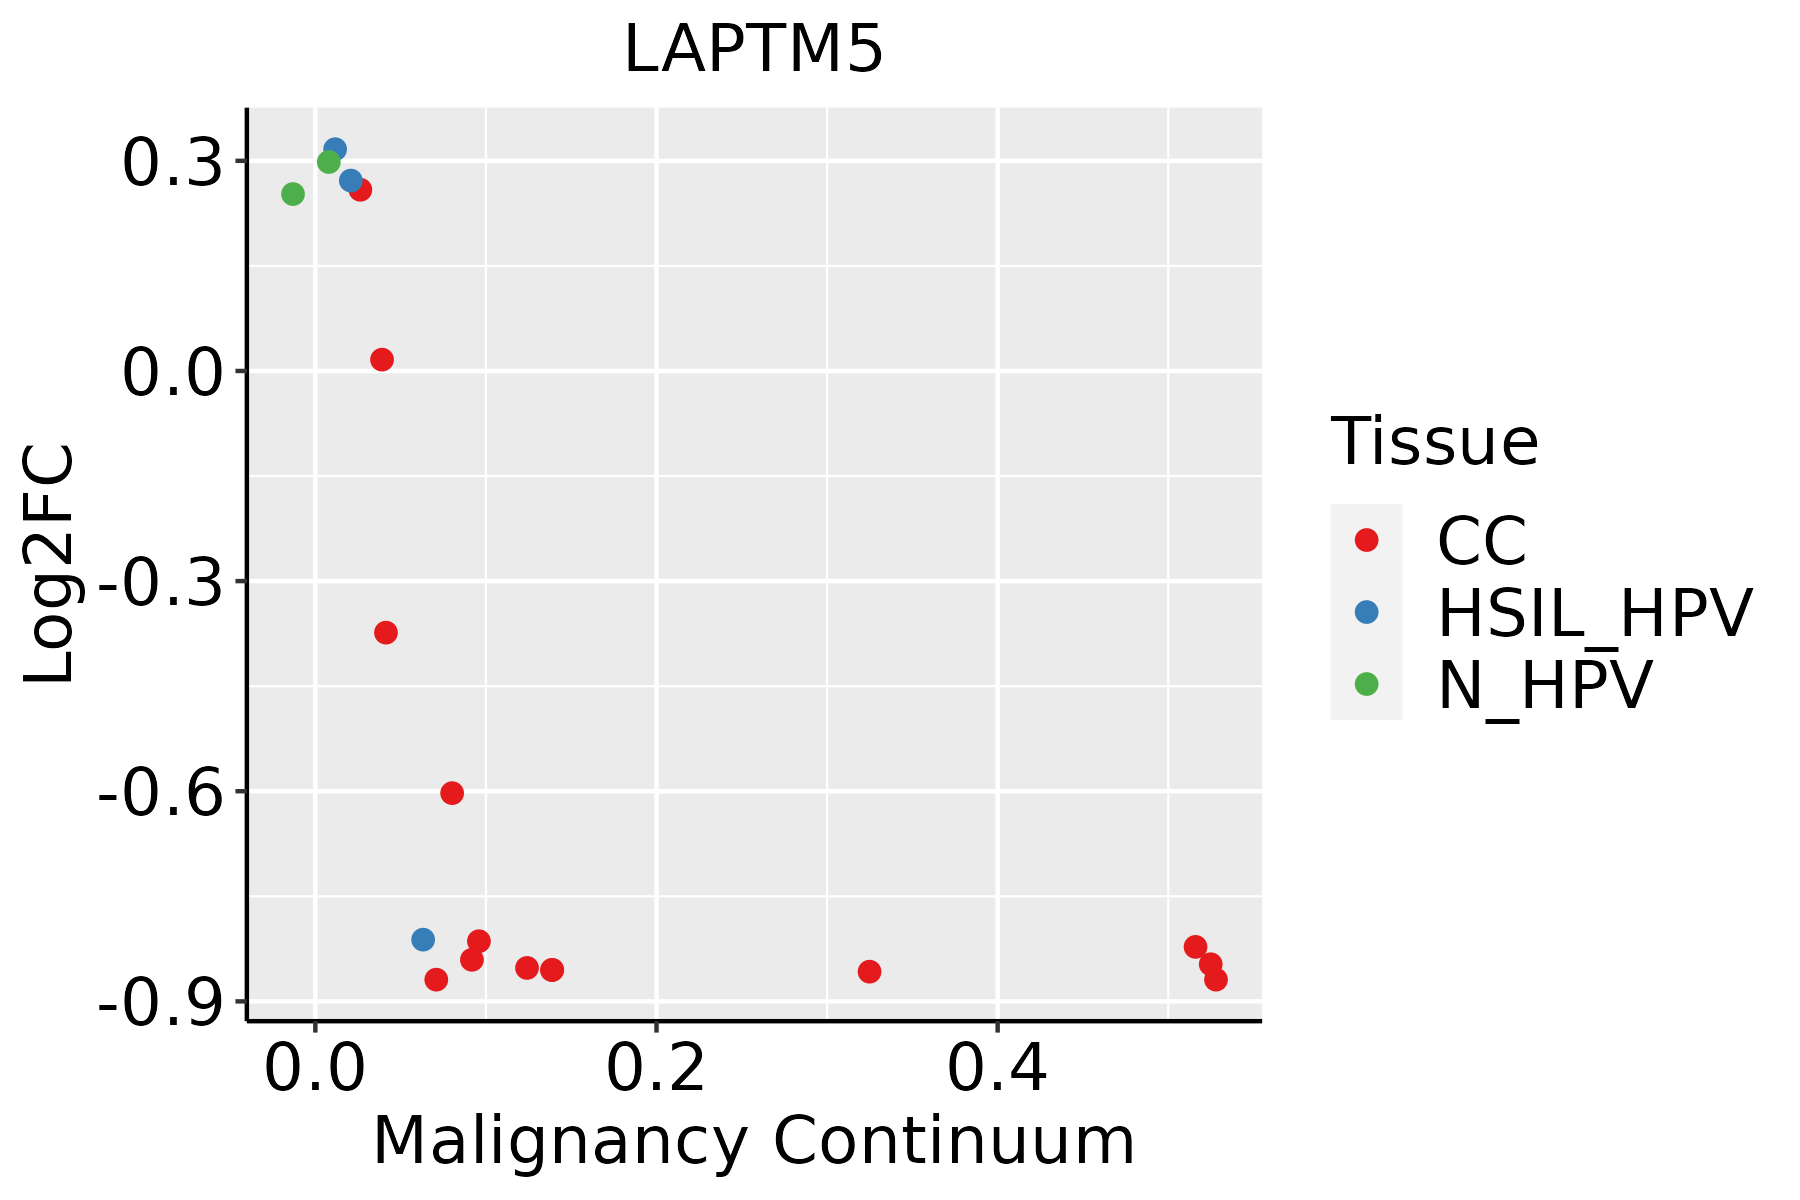 | CC: Cervix cancer |
| HSIL_HPV: HPV-infected high-grade squamous intraepithelial lesions | ||
| N_HPV: HPV-infected normal cervix | ||
| Esophagus | 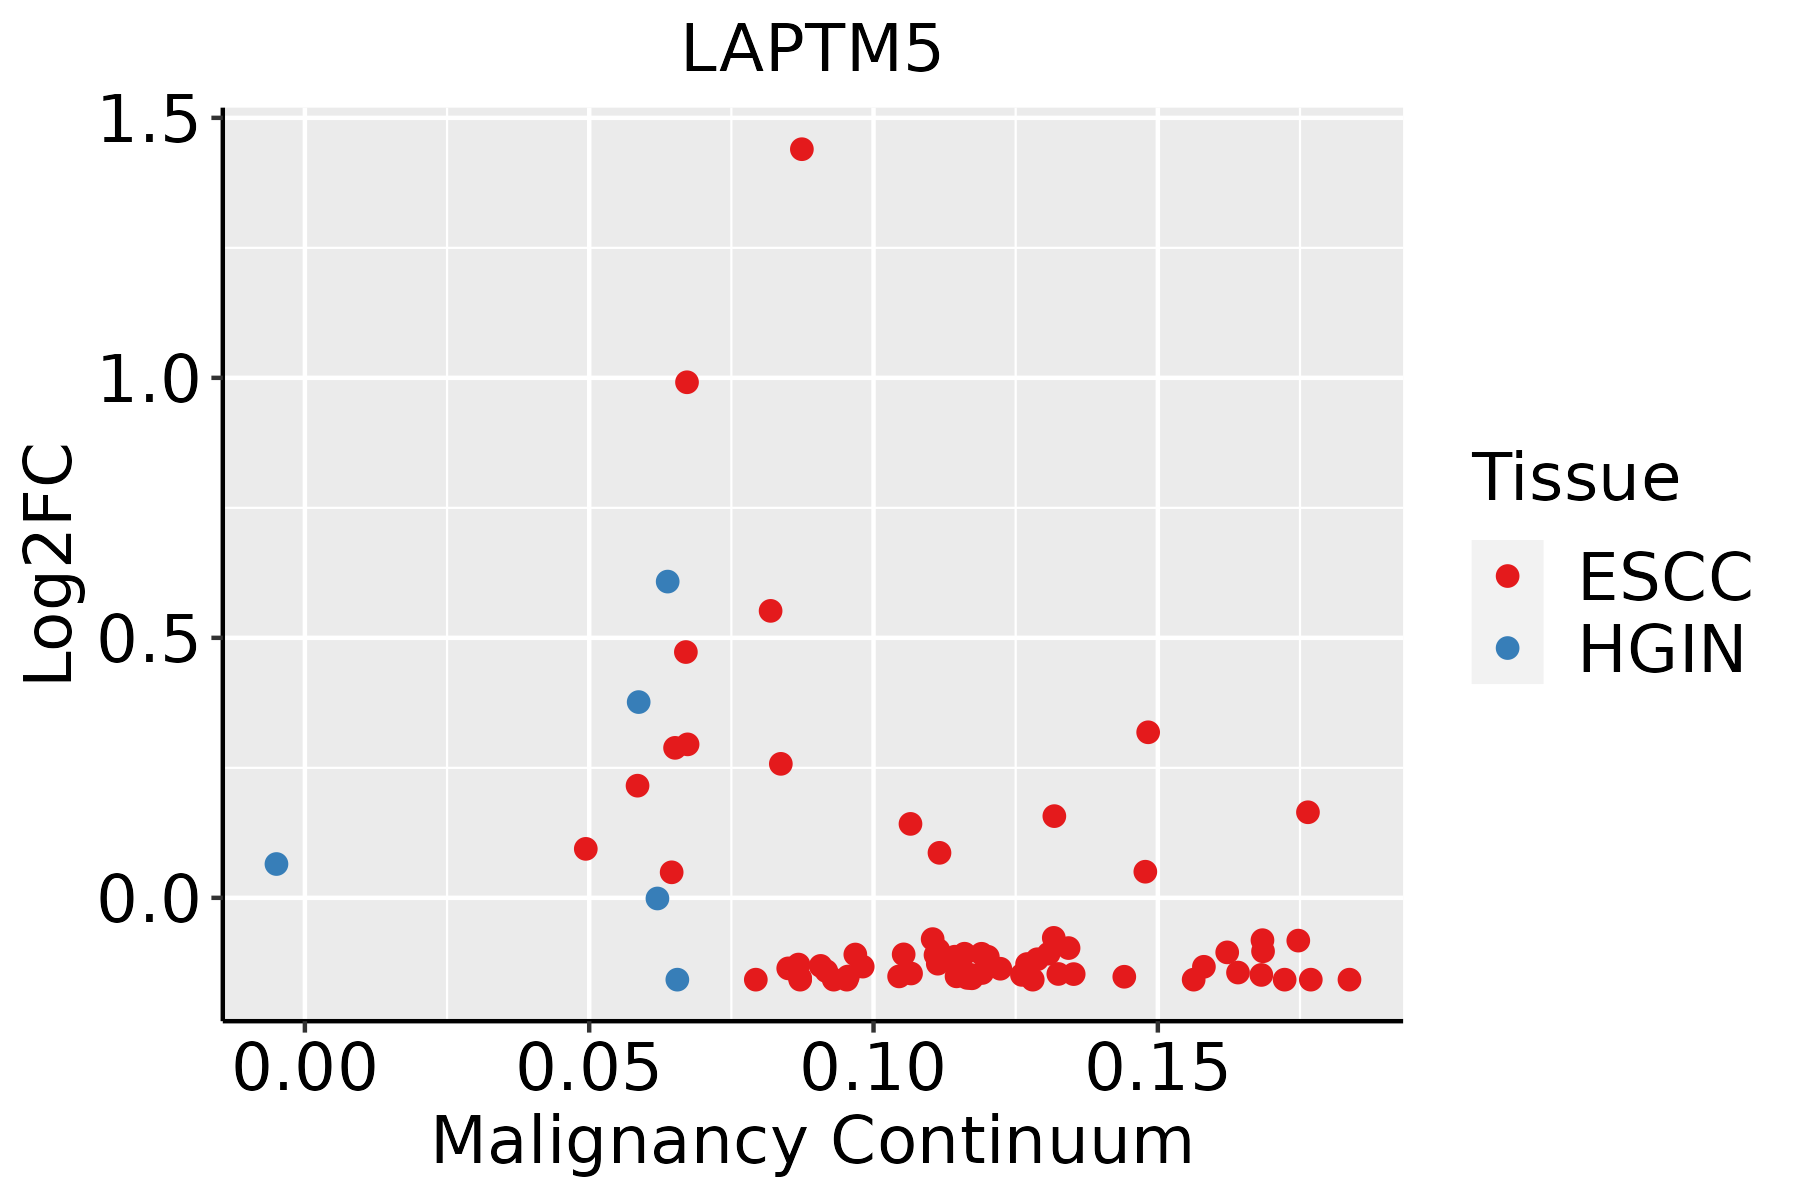 | ESCC: Esophageal squamous cell carcinoma |
| HGIN: High-grade intraepithelial neoplasias | ||
| LGIN: Low-grade intraepithelial neoplasias | ||
| Liver | 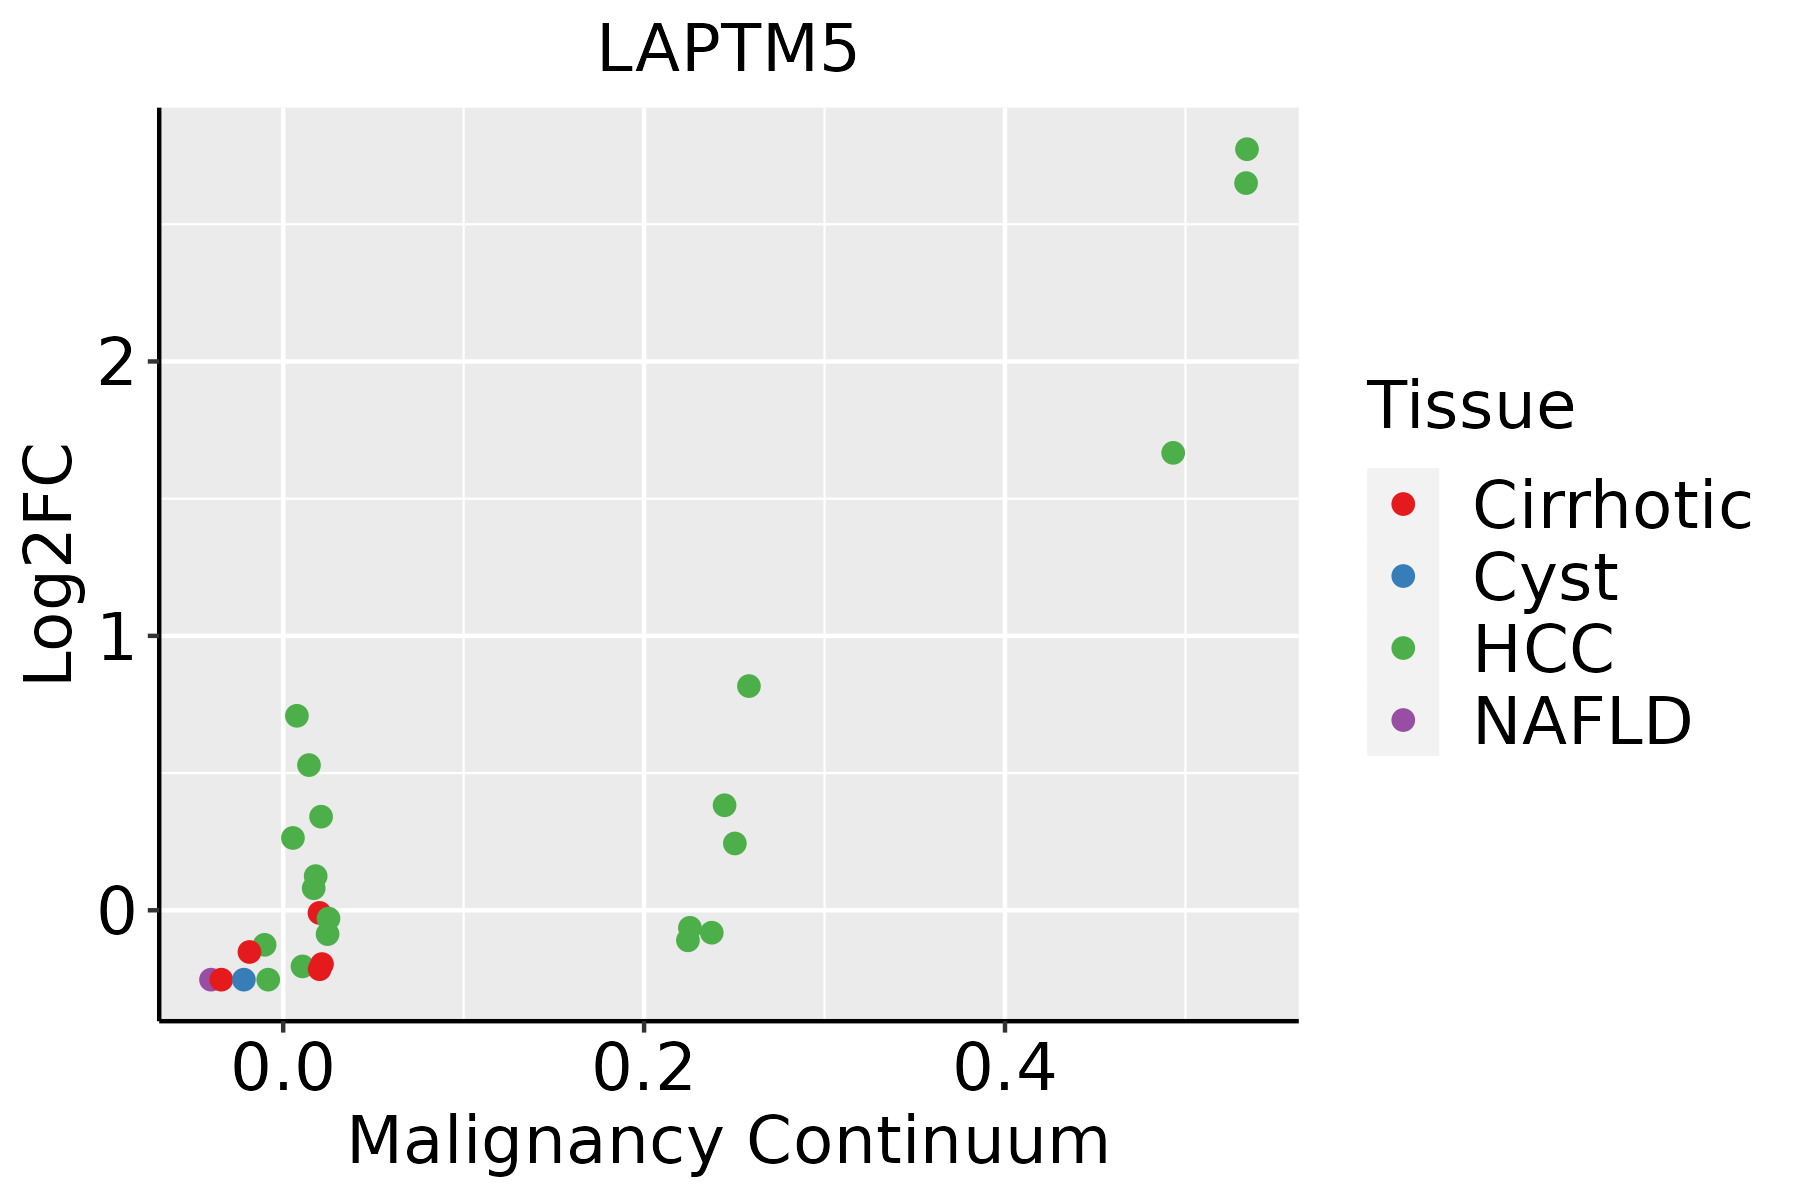 | HCC: Hepatocellular carcinoma |
| NAFLD: Non-alcoholic fatty liver disease | ||
| Oral Cavity | 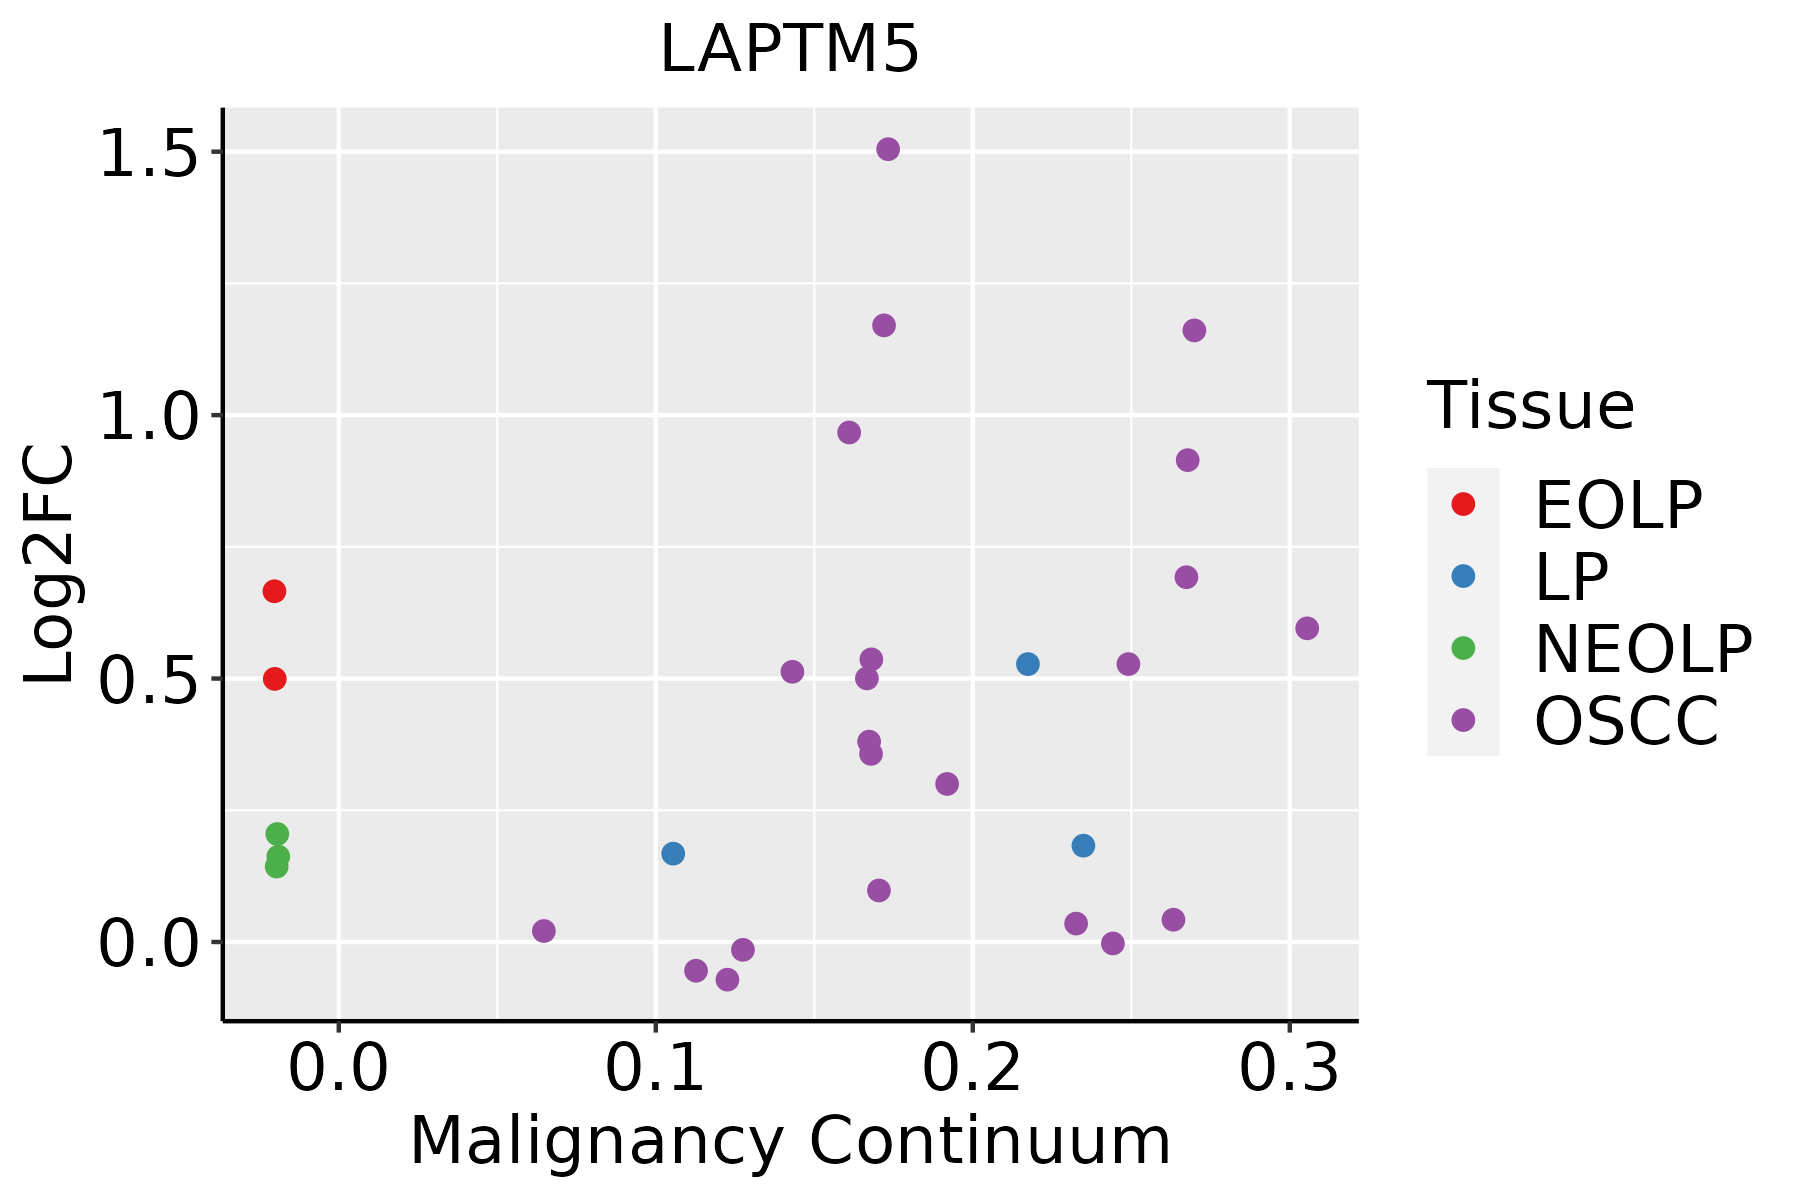 | EOLP: Erosive Oral lichen planus |
| LP: leukoplakia | ||
| NEOLP: Non-erosive oral lichen planus | ||
| OSCC: Oral squamous cell carcinoma | ||
| Prostate |  | BPH: Benign Prostatic Hyperplasia |
| Thyroid | 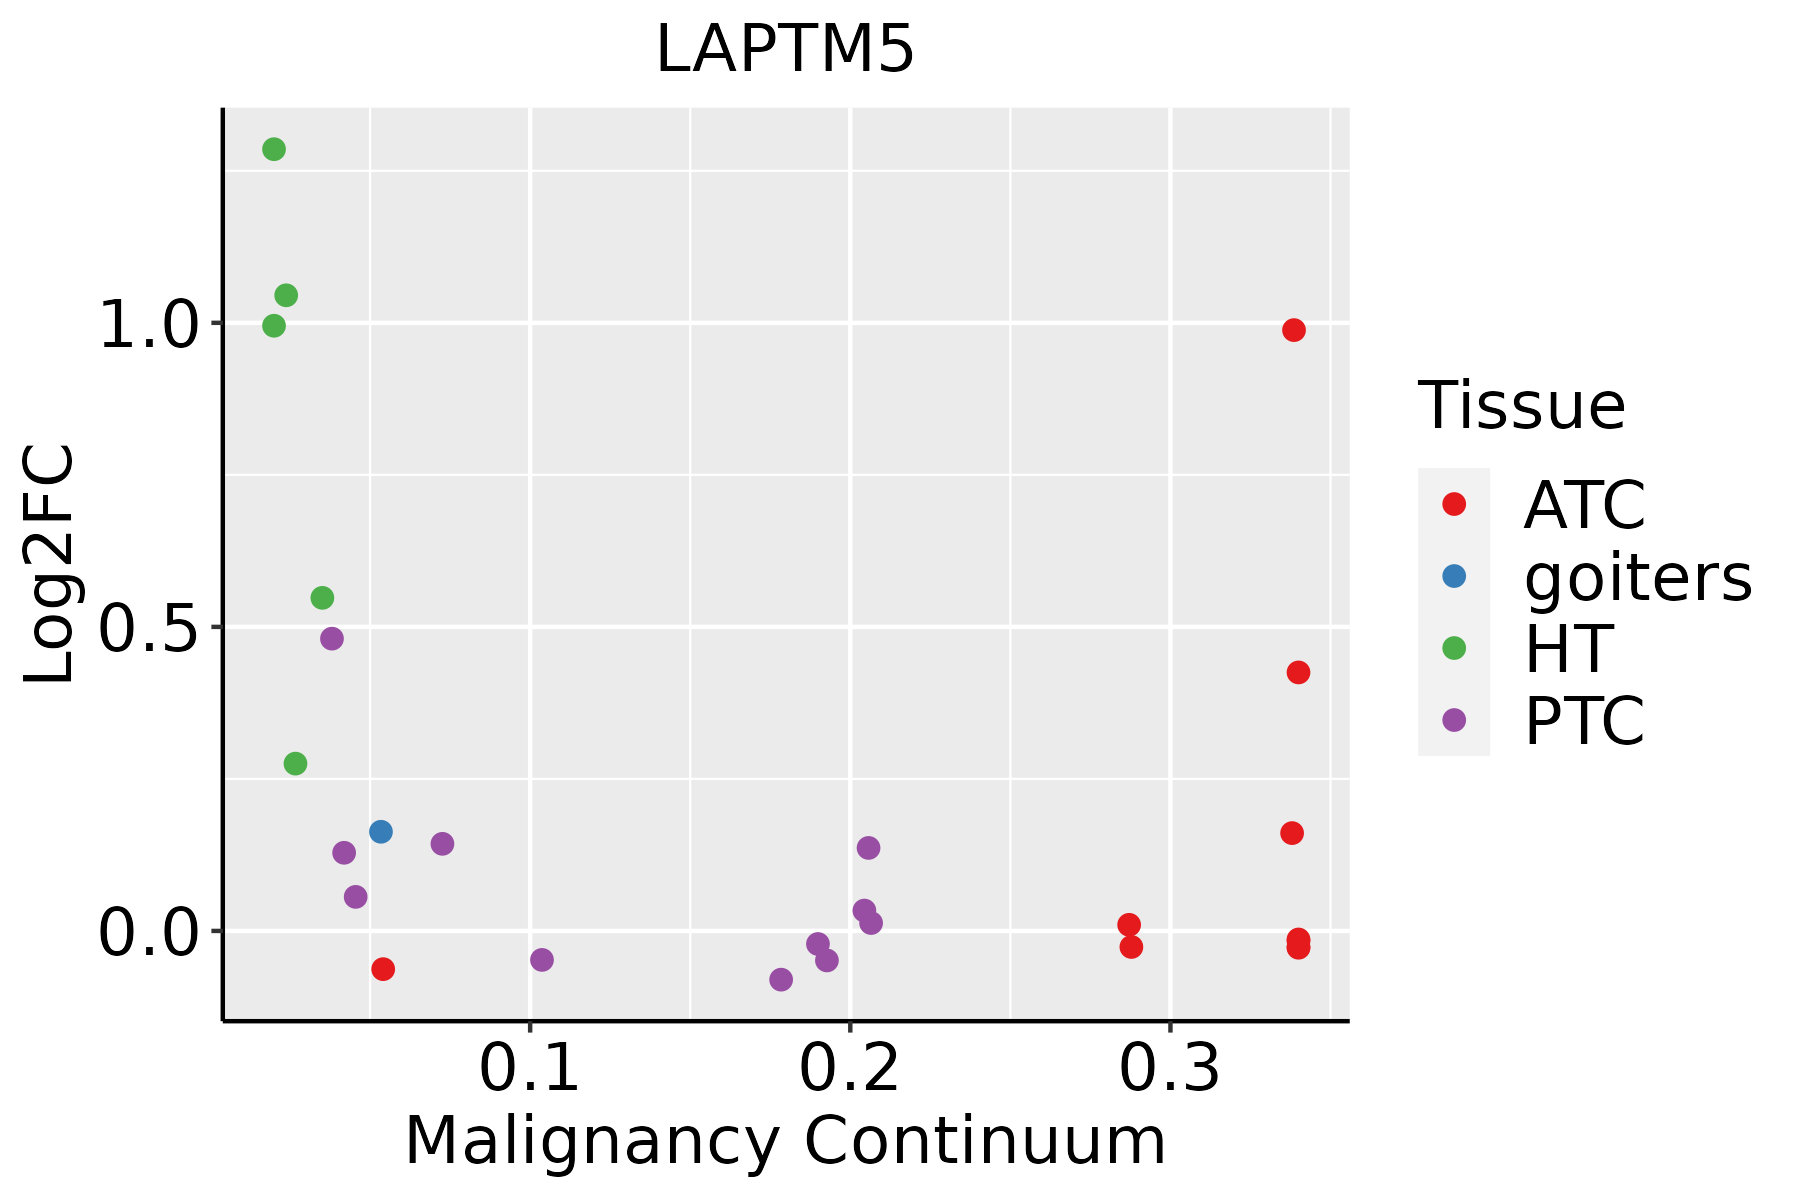 | ATC: Anaplastic thyroid cancer |
| HT: Hashimoto's thyroiditis | ||
| PTC: Papillary thyroid cancer |
| ∗log2FC in expression of this searched gene in stem-like cells from each diseased tissue sample relative to stem-like cells in normal samples in each tissue plotted against the malignancy continuum. Samples are colored based on if they are from different disease stage. |
Top |
Malignant transformation related pathway analysis |
| Find out the enriched GO biological processes and KEGG pathways involved in transition from healthy to precancer to cancer |
| Tissue | Disease Stage | Enriched GO biological Processes |
| Colorectum | AD |  |
| Colorectum | SER |  |
| Colorectum | MSS |  |
| Colorectum | MSI-H |  |
| Colorectum | FAP |  |
| ∗Top 15 enriched GO BP terms are showed in the bar plot of each disease state in each tissue. Each row represents a significant GO biological process which is colored according to the -log10(p.adjust). |
| Page: 1 2 3 4 5 6 7 8 9 |
| GO ID | Tissue | Disease Stage | Description | Gene Ratio | Bg Ratio | pvalue | p.adjust | Count |
| GO:00726659 | Esophagus | ESCC | protein localization to vacuole | 52/8552 | 67/18723 | 9.14e-08 | 1.52e-06 | 52 |
| GO:0010950111 | Esophagus | ESCC | positive regulation of endopeptidase activity | 116/8552 | 179/18723 | 1.77e-07 | 2.79e-06 | 116 |
| GO:00905599 | Esophagus | ESCC | regulation of membrane permeability | 58/8552 | 78/18723 | 2.38e-07 | 3.61e-06 | 58 |
| GO:003139816 | Esophagus | ESCC | positive regulation of protein ubiquitination | 82/8552 | 119/18723 | 2.41e-07 | 3.64e-06 | 82 |
| GO:00066238 | Esophagus | ESCC | protein targeting to vacuole | 31/8552 | 37/18723 | 1.95e-06 | 2.26e-05 | 31 |
| GO:00607595 | Esophagus | ESCC | regulation of response to cytokine stimulus | 103/8552 | 162/18723 | 3.14e-06 | 3.53e-05 | 103 |
| GO:00070403 | Esophagus | ESCC | lysosome organization | 53/8552 | 74/18723 | 5.34e-06 | 5.57e-05 | 53 |
| GO:00801713 | Esophagus | ESCC | lytic vacuole organization | 53/8552 | 74/18723 | 5.34e-06 | 5.57e-05 | 53 |
| GO:0043280110 | Esophagus | ESCC | positive regulation of cysteine-type endopeptidase activity involved in apoptotic process | 84/8552 | 129/18723 | 6.38e-06 | 6.55e-05 | 84 |
| GO:004311218 | Esophagus | ESCC | receptor metabolic process | 104/8552 | 166/18723 | 7.44e-06 | 7.37e-05 | 104 |
| GO:003320914 | Esophagus | ESCC | tumor necrosis factor-mediated signaling pathway | 67/8552 | 99/18723 | 7.87e-06 | 7.72e-05 | 67 |
| GO:2001056110 | Esophagus | ESCC | positive regulation of cysteine-type endopeptidase activity | 94/8552 | 148/18723 | 8.87e-06 | 8.59e-05 | 94 |
| GO:19057108 | Esophagus | ESCC | positive regulation of membrane permeability | 37/8552 | 48/18723 | 8.99e-06 | 8.65e-05 | 37 |
| GO:00019595 | Esophagus | ESCC | regulation of cytokine-mediated signaling pathway | 95/8552 | 150/18723 | 9.48e-06 | 9.04e-05 | 95 |
| GO:003461220 | Esophagus | ESCC | response to tumor necrosis factor | 149/8552 | 253/18723 | 1.47e-05 | 1.33e-04 | 149 |
| GO:00726668 | Esophagus | ESCC | establishment of protein localization to vacuole | 37/8552 | 49/18723 | 2.05e-05 | 1.78e-04 | 37 |
| GO:000691915 | Esophagus | ESCC | activation of cysteine-type endopeptidase activity involved in apoptotic process | 54/8552 | 78/18723 | 2.17e-05 | 1.87e-04 | 54 |
| GO:00066226 | Esophagus | ESCC | protein targeting to lysosome | 20/8552 | 23/18723 | 4.97e-05 | 3.86e-04 | 20 |
| GO:00328015 | Esophagus | ESCC | receptor catabolic process | 23/8552 | 28/18723 | 8.23e-05 | 6.01e-04 | 23 |
| GO:00614626 | Esophagus | ESCC | protein localization to lysosome | 34/8552 | 46/18723 | 9.39e-05 | 6.70e-04 | 34 |
| Page: 1 2 3 4 5 6 7 8 9 10 11 12 13 14 15 16 17 18 19 20 21 22 23 24 25 26 27 28 29 30 31 32 33 34 35 36 37 38 39 40 41 42 |
| Pathway ID | Tissue | Disease Stage | Description | Gene Ratio | Bg Ratio | pvalue | p.adjust | qvalue | Count |
| hsa0414222 | Esophagus | ESCC | Lysosome | 102/4205 | 132/8465 | 5.11e-11 | 7.13e-10 | 3.65e-10 | 102 |
| hsa0414232 | Esophagus | ESCC | Lysosome | 102/4205 | 132/8465 | 5.11e-11 | 7.13e-10 | 3.65e-10 | 102 |
| hsa041424 | Liver | Cirrhotic | Lysosome | 68/2530 | 132/8465 | 1.34e-07 | 1.97e-06 | 1.21e-06 | 68 |
| hsa0414211 | Liver | Cirrhotic | Lysosome | 68/2530 | 132/8465 | 1.34e-07 | 1.97e-06 | 1.21e-06 | 68 |
| hsa041422 | Liver | HCC | Lysosome | 100/4020 | 132/8465 | 2.32e-11 | 4.31e-10 | 2.40e-10 | 100 |
| hsa041423 | Liver | HCC | Lysosome | 100/4020 | 132/8465 | 2.32e-11 | 4.31e-10 | 2.40e-10 | 100 |
| hsa041425 | Oral cavity | OSCC | Lysosome | 87/3704 | 132/8465 | 1.97e-07 | 1.35e-06 | 6.86e-07 | 87 |
| hsa0414212 | Oral cavity | OSCC | Lysosome | 87/3704 | 132/8465 | 1.97e-07 | 1.35e-06 | 6.86e-07 | 87 |
| Page: 1 |
Top |
Cell-cell communication analysis |
| Identification of potential cell-cell interactions between two cell types and their ligand-receptor pairs for different disease states |
| Ligand | Receptor | LRpair | Pathway | Tissue | Disease Stage |
| Page: 1 |
Top |
Single-cell gene regulatory network inference analysis |
| Find out the significant the regulons (TFs) and the target genes of each regulon across cell types for different disease states |
| TF | Cell Type | Tissue | Disease Stage | Target Gene | RSS | Regulon Activity |
| ∗The dot plots of a searched regulon are shown for all cell subpopulations in each disease state of each tissue based on the regulon specific score inferred using pySCENIC and by calculating the average expression. |
| Page: 1 |
Top |
Somatic mutation of malignant transformation related genes |
| Annotation of somatic variants for genes involved in malignant transformation |
| Hugo Symbol | Variant Class | Variant Classification | dbSNP RS | HGVSc | HGVSp | HGVSp Short | SWISSPROT | BIOTYPE | SIFT | PolyPhen | Tumor Sample Barcode | Tissue | Histology | Sex | Age | Stage | Therapy Types | Drugs | Outcome |
| LAPTM5 | SNV | Missense_Mutation | rs755216643 | c.67G>A | p.Ala23Thr | p.A23T | Q13571 | protein_coding | tolerated(0.48) | benign(0.079) | TCGA-2W-A8YY-01 | Cervix | cervical & endocervical cancer | Female | <65 | I/II | Chemotherapy | cisplatin | CR |
| LAPTM5 | SNV | Missense_Mutation | rs747955844 | c.382N>T | p.Arg128Cys | p.R128C | Q13571 | protein_coding | tolerated(0.07) | probably_damaging(0.939) | TCGA-VS-A9UL-01 | Cervix | cervical & endocervical cancer | Female | >=65 | III/IV | Unknown | Unknown | PD |
| LAPTM5 | SNV | Missense_Mutation | c.561G>T | p.Met187Ile | p.M187I | Q13571 | protein_coding | tolerated(0.4) | benign(0.003) | TCGA-AA-3977-01 | Colorectum | colon adenocarcinoma | Male | >=65 | I/II | Unknown | Unknown | SD | |
| LAPTM5 | SNV | Missense_Mutation | novel | c.470A>C | p.Glu157Ala | p.E157A | Q13571 | protein_coding | tolerated(0.19) | possibly_damaging(0.771) | TCGA-A5-A1OF-01 | Endometrium | uterine corpus endometrioid carcinoma | Female | <65 | I/II | Unknown | Unknown | SD |
| LAPTM5 | SNV | Missense_Mutation | c.763N>T | p.Ala255Ser | p.A255S | Q13571 | protein_coding | tolerated(0.31) | possibly_damaging(0.818) | TCGA-AP-A059-01 | Endometrium | uterine corpus endometrioid carcinoma | Female | >=65 | I/II | Unknown | Unknown | SD | |
| LAPTM5 | SNV | Missense_Mutation | c.114G>T | p.Glu38Asp | p.E38D | Q13571 | protein_coding | tolerated(0.2) | probably_damaging(0.993) | TCGA-B5-A0JY-01 | Endometrium | uterine corpus endometrioid carcinoma | Female | <65 | III/IV | Chemotherapy | doxorubicin | SD | |
| LAPTM5 | SNV | Missense_Mutation | novel | c.236N>A | p.Ser79Asn | p.S79N | Q13571 | protein_coding | tolerated(0.35) | benign(0.015) | TCGA-B5-A3FA-01 | Endometrium | uterine corpus endometrioid carcinoma | Female | >=65 | I/II | Unknown | Unknown | SD |
| LAPTM5 | SNV | Missense_Mutation | rs369470045 | c.58N>A | p.Ala20Thr | p.A20T | Q13571 | protein_coding | deleterious(0.01) | possibly_damaging(0.794) | TCGA-BS-A0UV-01 | Endometrium | uterine corpus endometrioid carcinoma | Female | <65 | III/IV | Unknown | Unknown | SD |
| LAPTM5 | SNV | Missense_Mutation | c.558N>T | p.Lys186Asn | p.K186N | Q13571 | protein_coding | tolerated(0.09) | benign(0.009) | TCGA-D1-A103-01 | Endometrium | uterine corpus endometrioid carcinoma | Female | >=65 | I/II | Unknown | Unknown | SD | |
| LAPTM5 | SNV | Missense_Mutation | rs183822203 | c.250N>A | p.Val84Ile | p.V84I | Q13571 | protein_coding | tolerated(0.1) | possibly_damaging(0.472) | TCGA-D1-A103-01 | Endometrium | uterine corpus endometrioid carcinoma | Female | >=65 | I/II | Unknown | Unknown | SD |
| Page: 1 2 3 |
Top |
Related drugs of malignant transformation related genes |
| Identification of chemicals and drugs interact with genes involved in malignant transfromation |
| (DGIdb 4.0) |
| Entrez ID | Symbol | Category | Interaction Types | Drug Claim Name | Drug Name | PMIDs |
| Page: 1 |

Copyright 2023-Present -The University of Texas Health Science Center at Houston |