
|
|||||
|
 | |
| |
| |
| |
| |
| |
|
Gene: KYNU |
Gene summary for KYNU |
| Gene information | Species | Human | Gene symbol | KYNU | Gene ID | 8942 |
| Gene name | kynureninase | |
| Gene Alias | KYNUU | |
| Cytomap | 2q22.2 | |
| Gene Type | protein-coding | GO ID | GO:0002376 | UniProtAcc | Q16719 |
Top |
Malignant transformation analysis |
| Identification of the aberrant gene expression in precancerous and cancerous lesions by comparing the gene expression of stem-like cells in diseased tissues with normal stem cells |
| Entrez ID | Symbol | Replicates | Species | Organ | Tissue | Adj P-value | Log2FC | Malignancy |
| 8942 | KYNU | N_HPV_2 | Human | Cervix | N_HPV | 3.00e-03 | 2.19e-01 | -0.0131 |
| 8942 | KYNU | CCI_3 | Human | Cervix | CC | 1.48e-19 | 1.33e+00 | 0.516 |
| 8942 | KYNU | CCII_1 | Human | Cervix | CC | 9.37e-04 | 3.41e-01 | 0.3249 |
| 8942 | KYNU | Tumor | Human | Cervix | CC | 2.59e-14 | 3.87e-01 | 0.1241 |
| 8942 | KYNU | sample1 | Human | Cervix | CC | 2.68e-02 | 3.04e-01 | 0.0959 |
| 8942 | KYNU | sample3 | Human | Cervix | CC | 2.37e-20 | 3.80e-01 | 0.1387 |
| 8942 | KYNU | T1 | Human | Cervix | CC | 1.04e-03 | 2.78e-01 | 0.0918 |
| 8942 | KYNU | T3 | Human | Cervix | CC | 1.59e-16 | 4.24e-01 | 0.1389 |
| 8942 | KYNU | AEH-subject1 | Human | Endometrium | AEH | 5.84e-24 | 7.13e-01 | -0.3059 |
| 8942 | KYNU | AEH-subject2 | Human | Endometrium | AEH | 1.81e-18 | 5.69e-01 | -0.2525 |
| 8942 | KYNU | AEH-subject4 | Human | Endometrium | AEH | 1.20e-07 | 3.66e-01 | -0.2657 |
| 8942 | KYNU | EEC-subject2 | Human | Endometrium | EEC | 2.13e-09 | 4.10e-01 | -0.2607 |
| 8942 | KYNU | LZE2D | Human | Esophagus | HGIN | 1.86e-02 | 3.02e-01 | 0.0642 |
| 8942 | KYNU | LZE4T | Human | Esophagus | ESCC | 2.35e-08 | 4.54e-01 | 0.0811 |
| 8942 | KYNU | LZE5T | Human | Esophagus | ESCC | 1.70e-02 | 3.69e-01 | 0.0514 |
| 8942 | KYNU | LZE8T | Human | Esophagus | ESCC | 9.18e-20 | 6.79e-01 | 0.067 |
| 8942 | KYNU | LZE22T | Human | Esophagus | ESCC | 4.81e-07 | 5.88e-01 | 0.068 |
| 8942 | KYNU | LZE24T | Human | Esophagus | ESCC | 2.86e-07 | 2.91e-01 | 0.0596 |
| 8942 | KYNU | P1T-E | Human | Esophagus | ESCC | 1.12e-02 | 4.28e-01 | 0.0875 |
| 8942 | KYNU | P2T-E | Human | Esophagus | ESCC | 3.91e-14 | 2.88e-01 | 0.1177 |
| Page: 1 2 3 4 |
| Tissue | Expression Dynamics | Abbreviation |
| Cervix | 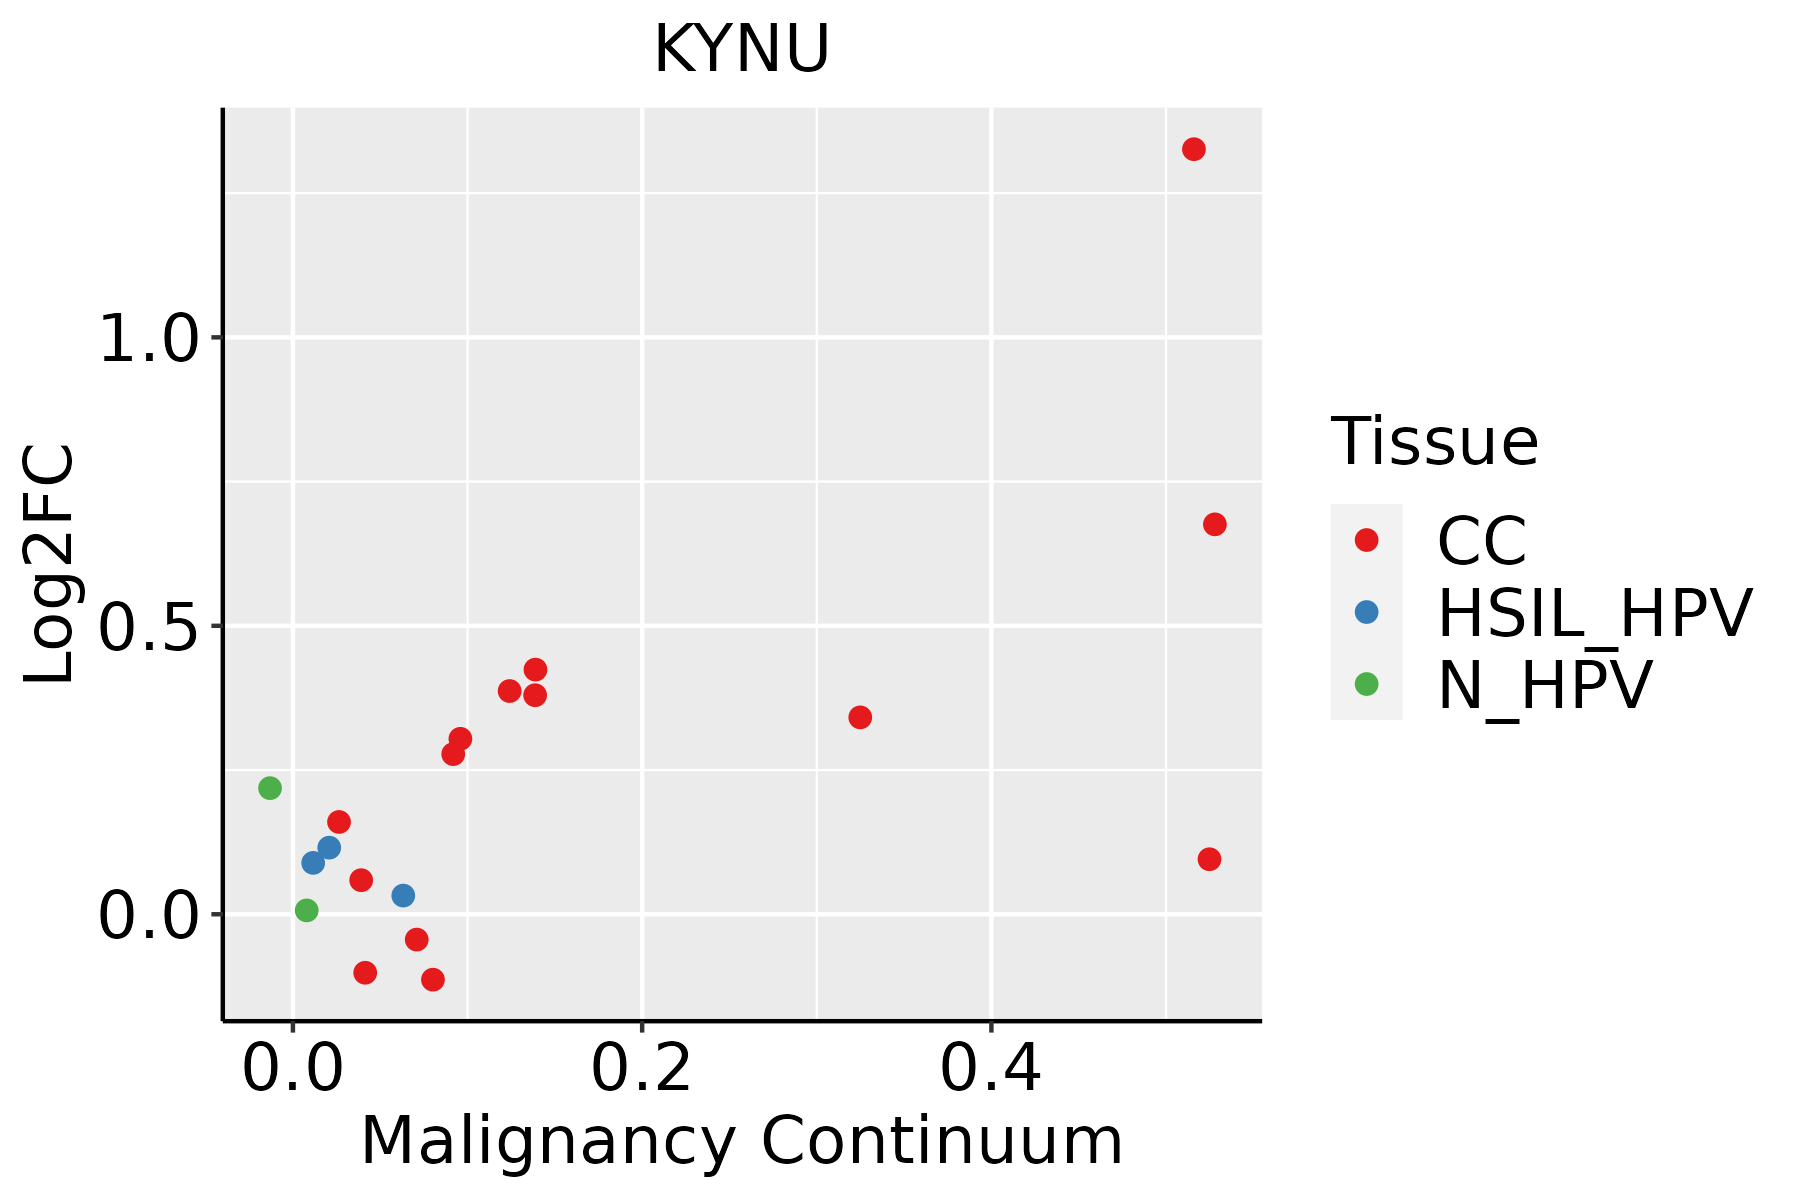 | CC: Cervix cancer |
| HSIL_HPV: HPV-infected high-grade squamous intraepithelial lesions | ||
| N_HPV: HPV-infected normal cervix | ||
| Endometrium |  | AEH: Atypical endometrial hyperplasia |
| EEC: Endometrioid Cancer | ||
| Esophagus |  | ESCC: Esophageal squamous cell carcinoma |
| HGIN: High-grade intraepithelial neoplasias | ||
| LGIN: Low-grade intraepithelial neoplasias | ||
| Liver |  | HCC: Hepatocellular carcinoma |
| NAFLD: Non-alcoholic fatty liver disease | ||
| Oral Cavity | 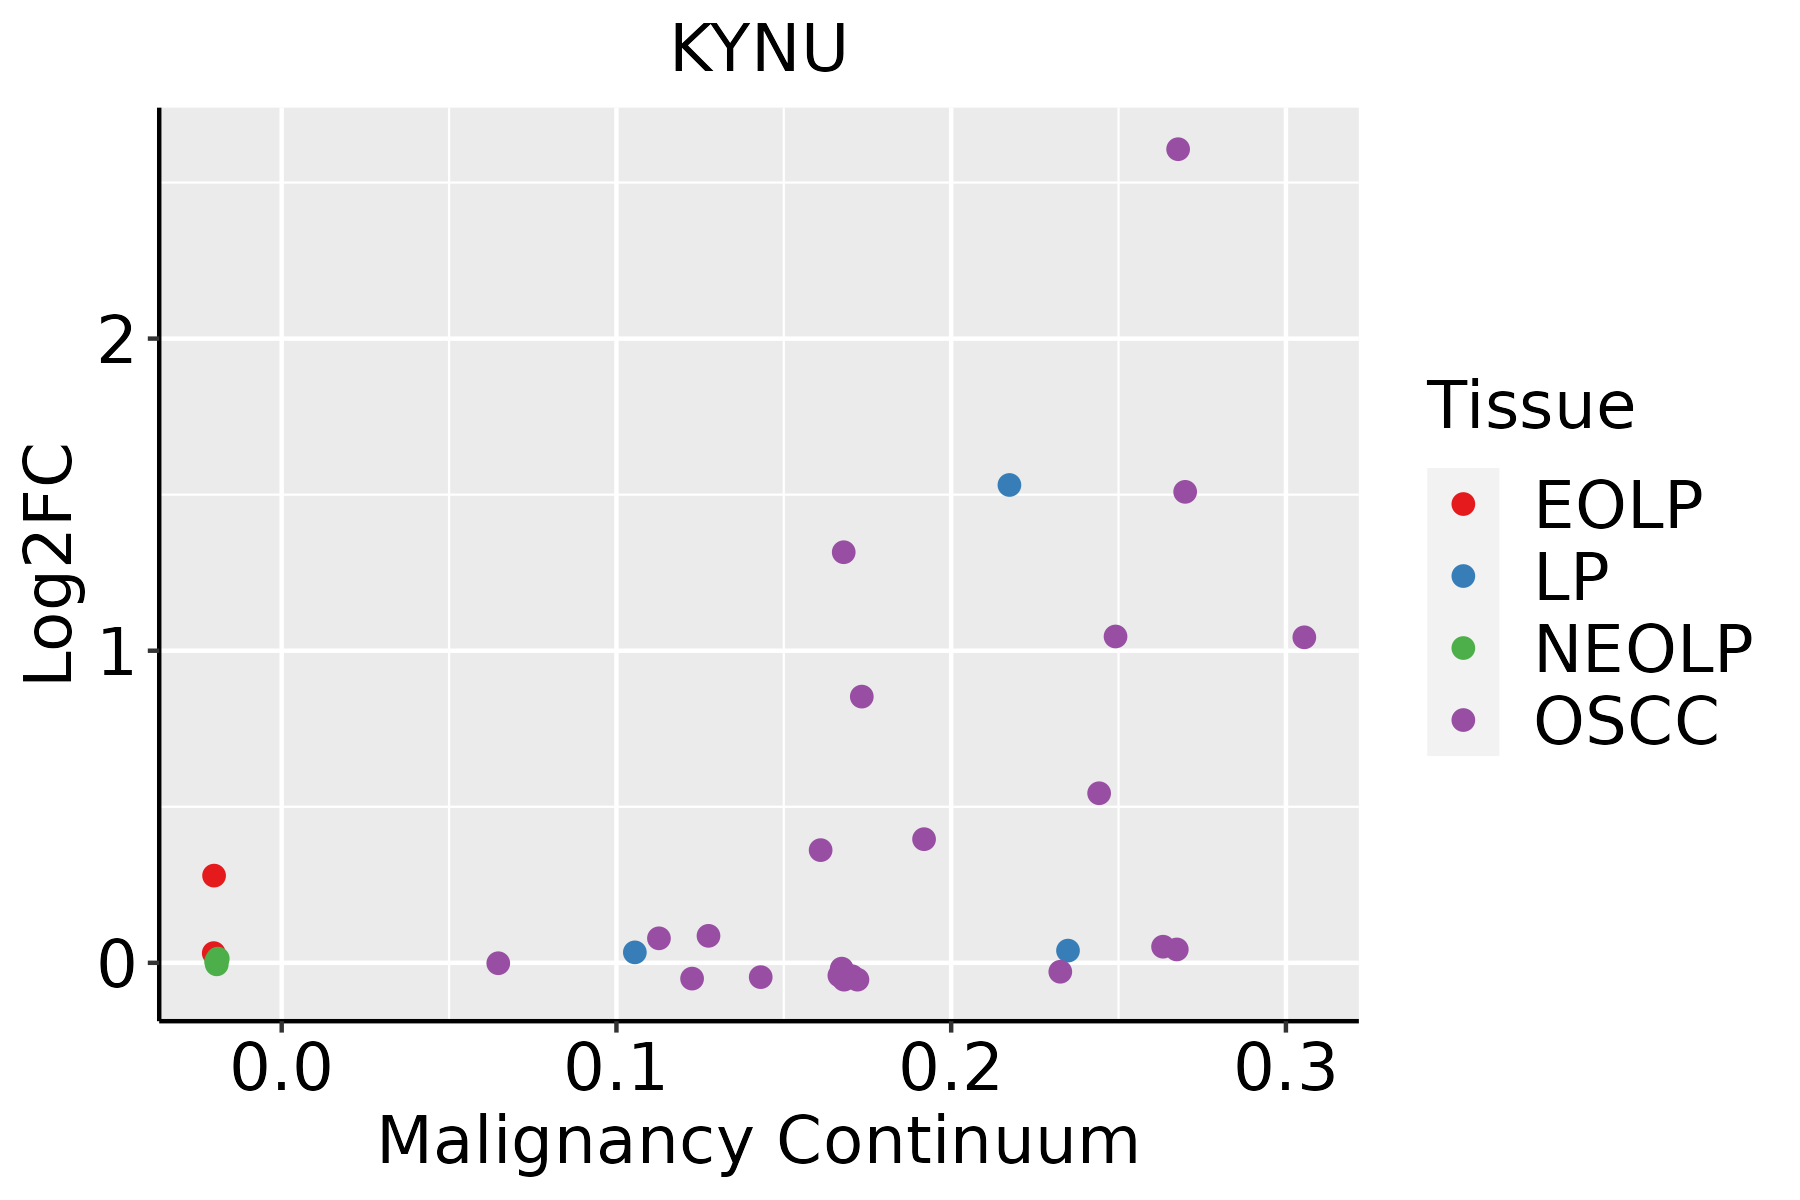 | EOLP: Erosive Oral lichen planus |
| LP: leukoplakia | ||
| NEOLP: Non-erosive oral lichen planus | ||
| OSCC: Oral squamous cell carcinoma | ||
| Skin |  | AK: Actinic keratosis |
| cSCC: Cutaneous squamous cell carcinoma | ||
| SCCIS:squamous cell carcinoma in situ |
| ∗log2FC in expression of this searched gene in stem-like cells from each diseased tissue sample relative to stem-like cells in normal samples in each tissue plotted against the malignancy continuum. Samples are colored based on if they are from different disease stage. |
Top |
Malignant transformation related pathway analysis |
| Find out the enriched GO biological processes and KEGG pathways involved in transition from healthy to precancer to cancer |
| Tissue | Disease Stage | Enriched GO biological Processes |
| Colorectum | AD |  |
| Colorectum | SER |  |
| Colorectum | MSS |  |
| Colorectum | MSI-H |  |
| Colorectum | FAP |  |
| ∗Top 15 enriched GO BP terms are showed in the bar plot of each disease state in each tissue. Each row represents a significant GO biological process which is colored according to the -log10(p.adjust). |
| Page: 1 2 3 4 5 6 7 8 9 |
| GO ID | Tissue | Disease Stage | Description | Gene Ratio | Bg Ratio | pvalue | p.adjust | Count |
| GO:00332733 | Oral cavity | OSCC | response to vitamin | 50/7305 | 93/18723 | 2.71e-03 | 1.18e-02 | 50 |
| GO:00060842 | Oral cavity | OSCC | acetyl-CoA metabolic process | 22/7305 | 35/18723 | 3.65e-03 | 1.51e-02 | 22 |
| GO:00066373 | Oral cavity | OSCC | acyl-CoA metabolic process | 50/7305 | 96/18723 | 6.24e-03 | 2.35e-02 | 50 |
| GO:00353833 | Oral cavity | OSCC | thioester metabolic process | 50/7305 | 96/18723 | 6.24e-03 | 2.35e-02 | 50 |
| GO:00436484 | Oral cavity | OSCC | dicarboxylic acid metabolic process | 50/7305 | 96/18723 | 6.24e-03 | 2.35e-02 | 50 |
| GO:001943916 | Oral cavity | LP | aromatic compound catabolic process | 176/4623 | 467/18723 | 1.96e-10 | 1.08e-08 | 176 |
| GO:004427017 | Oral cavity | LP | cellular nitrogen compound catabolic process | 170/4623 | 451/18723 | 3.93e-10 | 2.02e-08 | 170 |
| GO:004670016 | Oral cavity | LP | heterocycle catabolic process | 168/4623 | 445/18723 | 4.35e-10 | 2.20e-08 | 168 |
| GO:190136116 | Oral cavity | LP | organic cyclic compound catabolic process | 180/4623 | 495/18723 | 3.11e-09 | 1.35e-07 | 180 |
| GO:000756819 | Oral cavity | LP | aging | 125/4623 | 339/18723 | 3.29e-07 | 9.62e-06 | 125 |
| GO:0031667110 | Oral cavity | LP | response to nutrient levels | 165/4623 | 474/18723 | 3.87e-07 | 1.12e-05 | 165 |
| GO:003434114 | Oral cavity | LP | response to interferon-gamma | 57/4623 | 141/18723 | 2.63e-05 | 4.21e-04 | 57 |
| GO:000675319 | Oral cavity | LP | nucleoside phosphate metabolic process | 161/4623 | 497/18723 | 5.31e-05 | 7.39e-04 | 161 |
| GO:0009117110 | Oral cavity | LP | nucleotide metabolic process | 158/4623 | 489/18723 | 7.17e-05 | 9.49e-04 | 158 |
| GO:000758414 | Oral cavity | LP | response to nutrient | 65/4623 | 174/18723 | 1.31e-04 | 1.52e-03 | 65 |
| GO:0019693110 | Oral cavity | LP | ribose phosphate metabolic process | 128/4623 | 396/18723 | 3.26e-04 | 3.28e-03 | 128 |
| GO:003327311 | Oral cavity | LP | response to vitamin | 37/4623 | 93/18723 | 9.14e-04 | 7.79e-03 | 37 |
| GO:0072521110 | Oral cavity | LP | purine-containing compound metabolic process | 130/4623 | 416/18723 | 1.30e-03 | 1.05e-02 | 130 |
| GO:190129315 | Oral cavity | LP | nucleoside phosphate biosynthetic process | 84/4623 | 256/18723 | 1.98e-03 | 1.47e-02 | 84 |
| GO:0009259110 | Oral cavity | LP | ribonucleotide metabolic process | 120/4623 | 385/18723 | 2.15e-03 | 1.57e-02 | 120 |
| Page: 1 2 3 4 5 6 7 8 9 10 11 12 13 14 15 |
| Pathway ID | Tissue | Disease Stage | Description | Gene Ratio | Bg Ratio | pvalue | p.adjust | qvalue | Count |
| hsa012405 | Esophagus | ESCC | Biosynthesis of cofactors | 97/4205 | 153/8465 | 3.88e-04 | 1.35e-03 | 6.94e-04 | 97 |
| hsa0124012 | Esophagus | ESCC | Biosynthesis of cofactors | 97/4205 | 153/8465 | 3.88e-04 | 1.35e-03 | 6.94e-04 | 97 |
| hsa01240 | Liver | Cirrhotic | Biosynthesis of cofactors | 66/2530 | 153/8465 | 3.11e-04 | 1.99e-03 | 1.23e-03 | 66 |
| hsa003802 | Liver | Cirrhotic | Tryptophan metabolism | 22/2530 | 42/8465 | 1.85e-03 | 8.37e-03 | 5.16e-03 | 22 |
| hsa012401 | Liver | Cirrhotic | Biosynthesis of cofactors | 66/2530 | 153/8465 | 3.11e-04 | 1.99e-03 | 1.23e-03 | 66 |
| hsa0038011 | Liver | Cirrhotic | Tryptophan metabolism | 22/2530 | 42/8465 | 1.85e-03 | 8.37e-03 | 5.16e-03 | 22 |
| hsa012402 | Liver | HCC | Biosynthesis of cofactors | 103/4020 | 153/8465 | 4.67e-07 | 5.05e-06 | 2.81e-06 | 103 |
| hsa012403 | Liver | HCC | Biosynthesis of cofactors | 103/4020 | 153/8465 | 4.67e-07 | 5.05e-06 | 2.81e-06 | 103 |
| hsa012404 | Oral cavity | OSCC | Biosynthesis of cofactors | 88/3704 | 153/8465 | 3.84e-04 | 1.20e-03 | 6.12e-04 | 88 |
| hsa0124011 | Oral cavity | OSCC | Biosynthesis of cofactors | 88/3704 | 153/8465 | 3.84e-04 | 1.20e-03 | 6.12e-04 | 88 |
| hsa0124021 | Oral cavity | LP | Biosynthesis of cofactors | 57/2418 | 153/8465 | 1.17e-02 | 3.91e-02 | 2.52e-02 | 57 |
| hsa0124031 | Oral cavity | LP | Biosynthesis of cofactors | 57/2418 | 153/8465 | 1.17e-02 | 3.91e-02 | 2.52e-02 | 57 |
| Page: 1 |
Top |
Cell-cell communication analysis |
| Identification of potential cell-cell interactions between two cell types and their ligand-receptor pairs for different disease states |
| Ligand | Receptor | LRpair | Pathway | Tissue | Disease Stage |
| Page: 1 |
Top |
Single-cell gene regulatory network inference analysis |
| Find out the significant the regulons (TFs) and the target genes of each regulon across cell types for different disease states |
| TF | Cell Type | Tissue | Disease Stage | Target Gene | RSS | Regulon Activity |
| ∗The dot plots of a searched regulon are shown for all cell subpopulations in each disease state of each tissue based on the regulon specific score inferred using pySCENIC and by calculating the average expression. |
| Page: 1 |
Top |
Somatic mutation of malignant transformation related genes |
| Annotation of somatic variants for genes involved in malignant transformation |
| Hugo Symbol | Variant Class | Variant Classification | dbSNP RS | HGVSc | HGVSp | HGVSp Short | SWISSPROT | BIOTYPE | SIFT | PolyPhen | Tumor Sample Barcode | Tissue | Histology | Sex | Age | Stage | Therapy Types | Drugs | Outcome |
| KYNU | SNV | Missense_Mutation | c.1238N>T | p.Asp413Val | p.D413V | Q16719 | protein_coding | tolerated(0.32) | benign(0.003) | TCGA-AC-A2FG-01 | Breast | breast invasive carcinoma | Female | >=65 | I/II | Hormone Therapy | arimidex | CR | |
| KYNU | insertion | Frame_Shift_Ins | novel | c.1160_1161insCCAAGATATCAGCCTCTACTTGAGCTGTCTC | p.Val388GlnfsTer49 | p.V388Qfs*49 | Q16719 | protein_coding | TCGA-A2-A0CT-01 | Breast | breast invasive carcinoma | Female | >=65 | I/II | Chemotherapy | cytoxan | SD | ||
| KYNU | SNV | Missense_Mutation | rs141632644 | c.725N>T | p.Ala242Val | p.A242V | Q16719 | protein_coding | tolerated(0.09) | benign(0.068) | TCGA-AA-3818-01 | Colorectum | colon adenocarcinoma | Female | >=65 | I/II | Unknown | Unknown | PD |
| KYNU | SNV | Missense_Mutation | c.16N>A | p.Leu6Ile | p.L6I | Q16719 | protein_coding | tolerated_low_confidence(0.39) | benign(0.024) | TCGA-AA-A010-01 | Colorectum | colon adenocarcinoma | Female | <65 | I/II | Chemotherapy | folinic | CR | |
| KYNU | SNV | Missense_Mutation | c.827N>C | p.Lys276Thr | p.K276T | Q16719 | protein_coding | deleterious(0) | probably_damaging(1) | TCGA-AA-A010-01 | Colorectum | colon adenocarcinoma | Female | <65 | I/II | Chemotherapy | folinic | CR | |
| KYNU | SNV | Missense_Mutation | rs140239671 | c.1072N>T | p.Arg358Trp | p.R358W | Q16719 | protein_coding | deleterious(0) | probably_damaging(0.984) | TCGA-AA-A010-01 | Colorectum | colon adenocarcinoma | Female | <65 | I/II | Chemotherapy | folinic | CR |
| KYNU | SNV | Missense_Mutation | c.268N>A | p.Glu90Lys | p.E90K | Q16719 | protein_coding | deleterious(0.04) | probably_damaging(0.988) | TCGA-CA-6718-01 | Colorectum | colon adenocarcinoma | Male | <65 | I/II | Unknown | Unknown | PD | |
| KYNU | SNV | Missense_Mutation | c.46N>G | p.Ile16Val | p.I16V | Q16719 | protein_coding | tolerated(0.61) | benign(0) | TCGA-NH-A5IV-01 | Colorectum | colon adenocarcinoma | Female | >=65 | I/II | Unknown | Unknown | SD | |
| KYNU | SNV | Missense_Mutation | novel | c.402N>T | p.Met134Ile | p.M134I | Q16719 | protein_coding | deleterious(0) | probably_damaging(0.986) | TCGA-AG-A002-01 | Colorectum | rectum adenocarcinoma | Male | <65 | I/II | Unknown | Unknown | SD |
| KYNU | SNV | Missense_Mutation | rs377612575 | c.1073N>A | p.Arg358Gln | p.R358Q | Q16719 | protein_coding | deleterious(0.03) | probably_damaging(0.995) | TCGA-EI-6513-01 | Colorectum | rectum adenocarcinoma | Male | <65 | III/IV | Unknown | Unknown | SD |
| Page: 1 2 3 4 5 6 7 8 |
Top |
Related drugs of malignant transformation related genes |
| Identification of chemicals and drugs interact with genes involved in malignant transfromation |
| (DGIdb 4.0) |
| Entrez ID | Symbol | Category | Interaction Types | Drug Claim Name | Drug Name | PMIDs |
| Page: 1 |

Copyright 2023-Present -The University of Texas Health Science Center at Houston |