| Tissue | Expression Dynamics | Abbreviation |
| Esophagus | 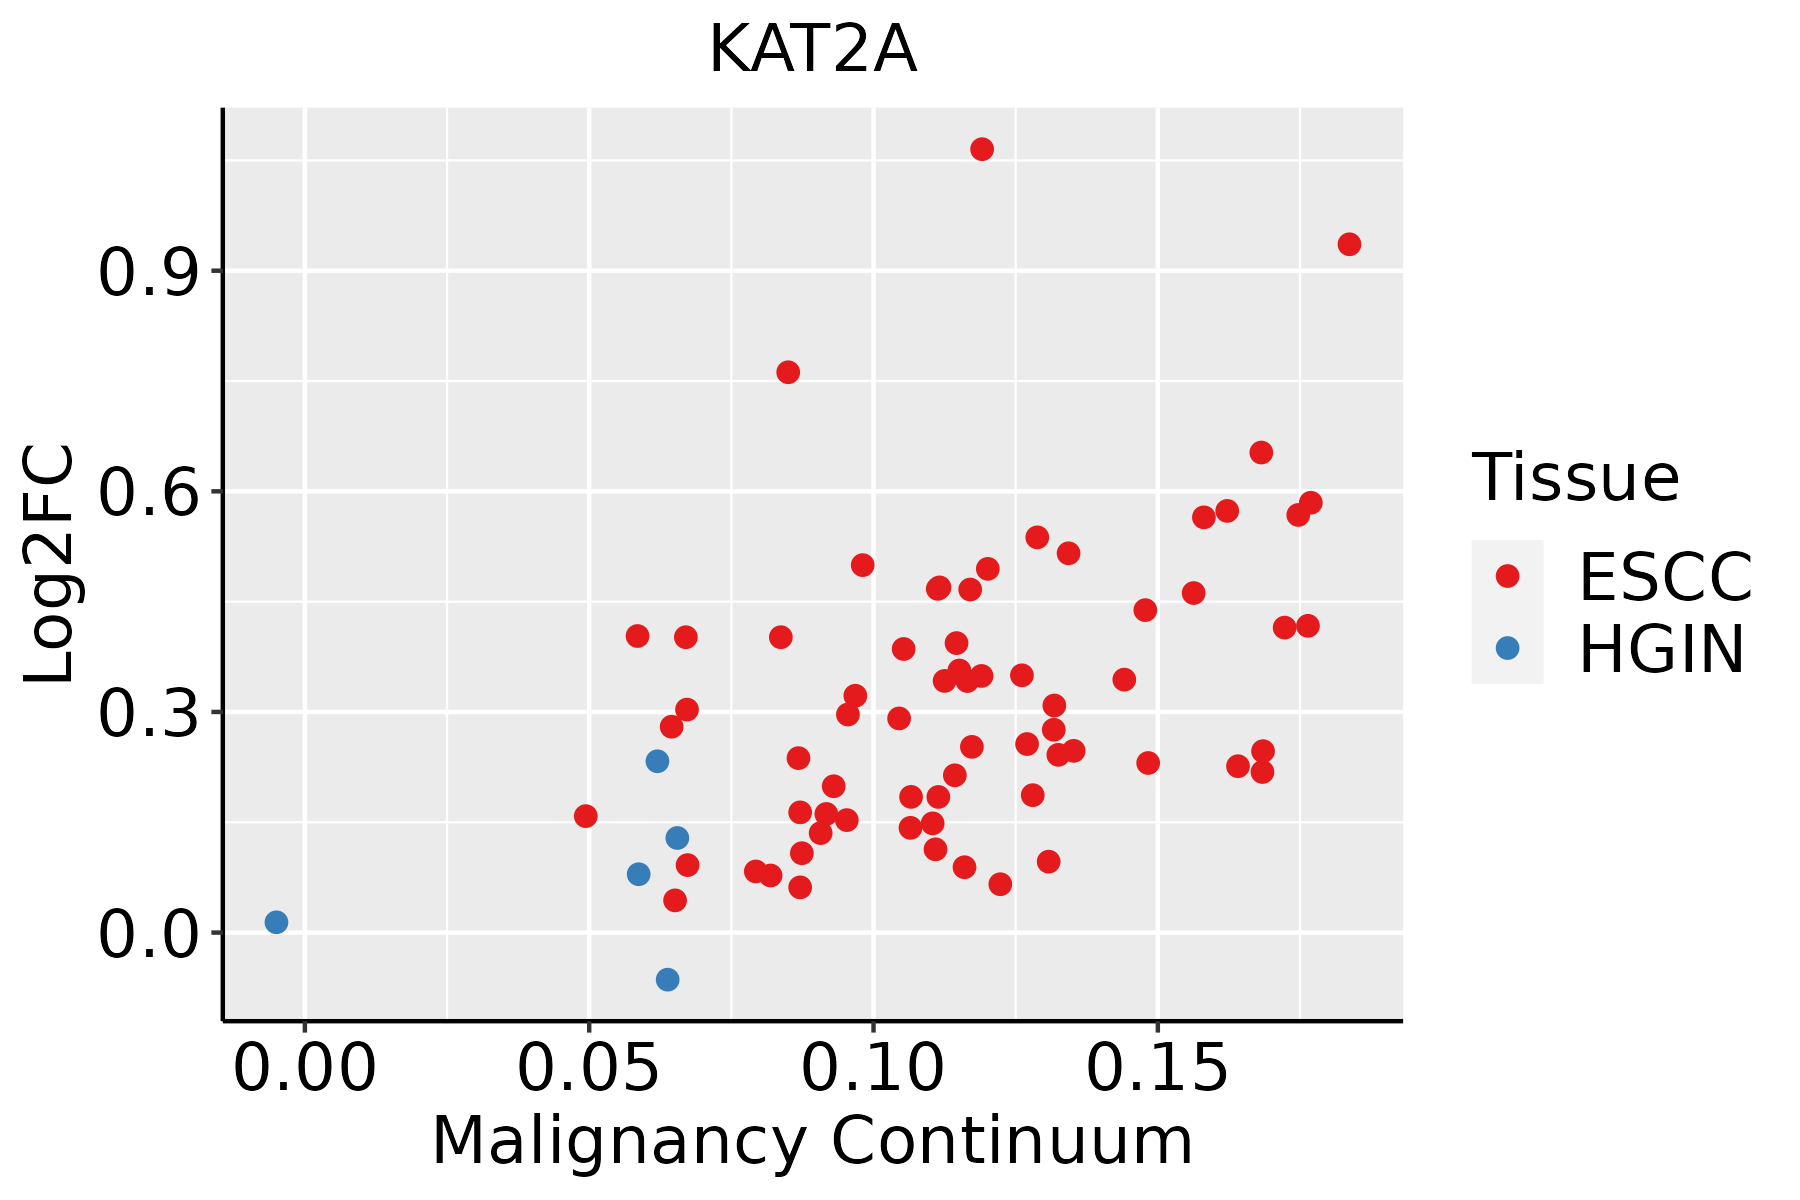 | ESCC: Esophageal squamous cell carcinoma |
| HGIN: High-grade intraepithelial neoplasias |
| LGIN: Low-grade intraepithelial neoplasias |
| Liver | 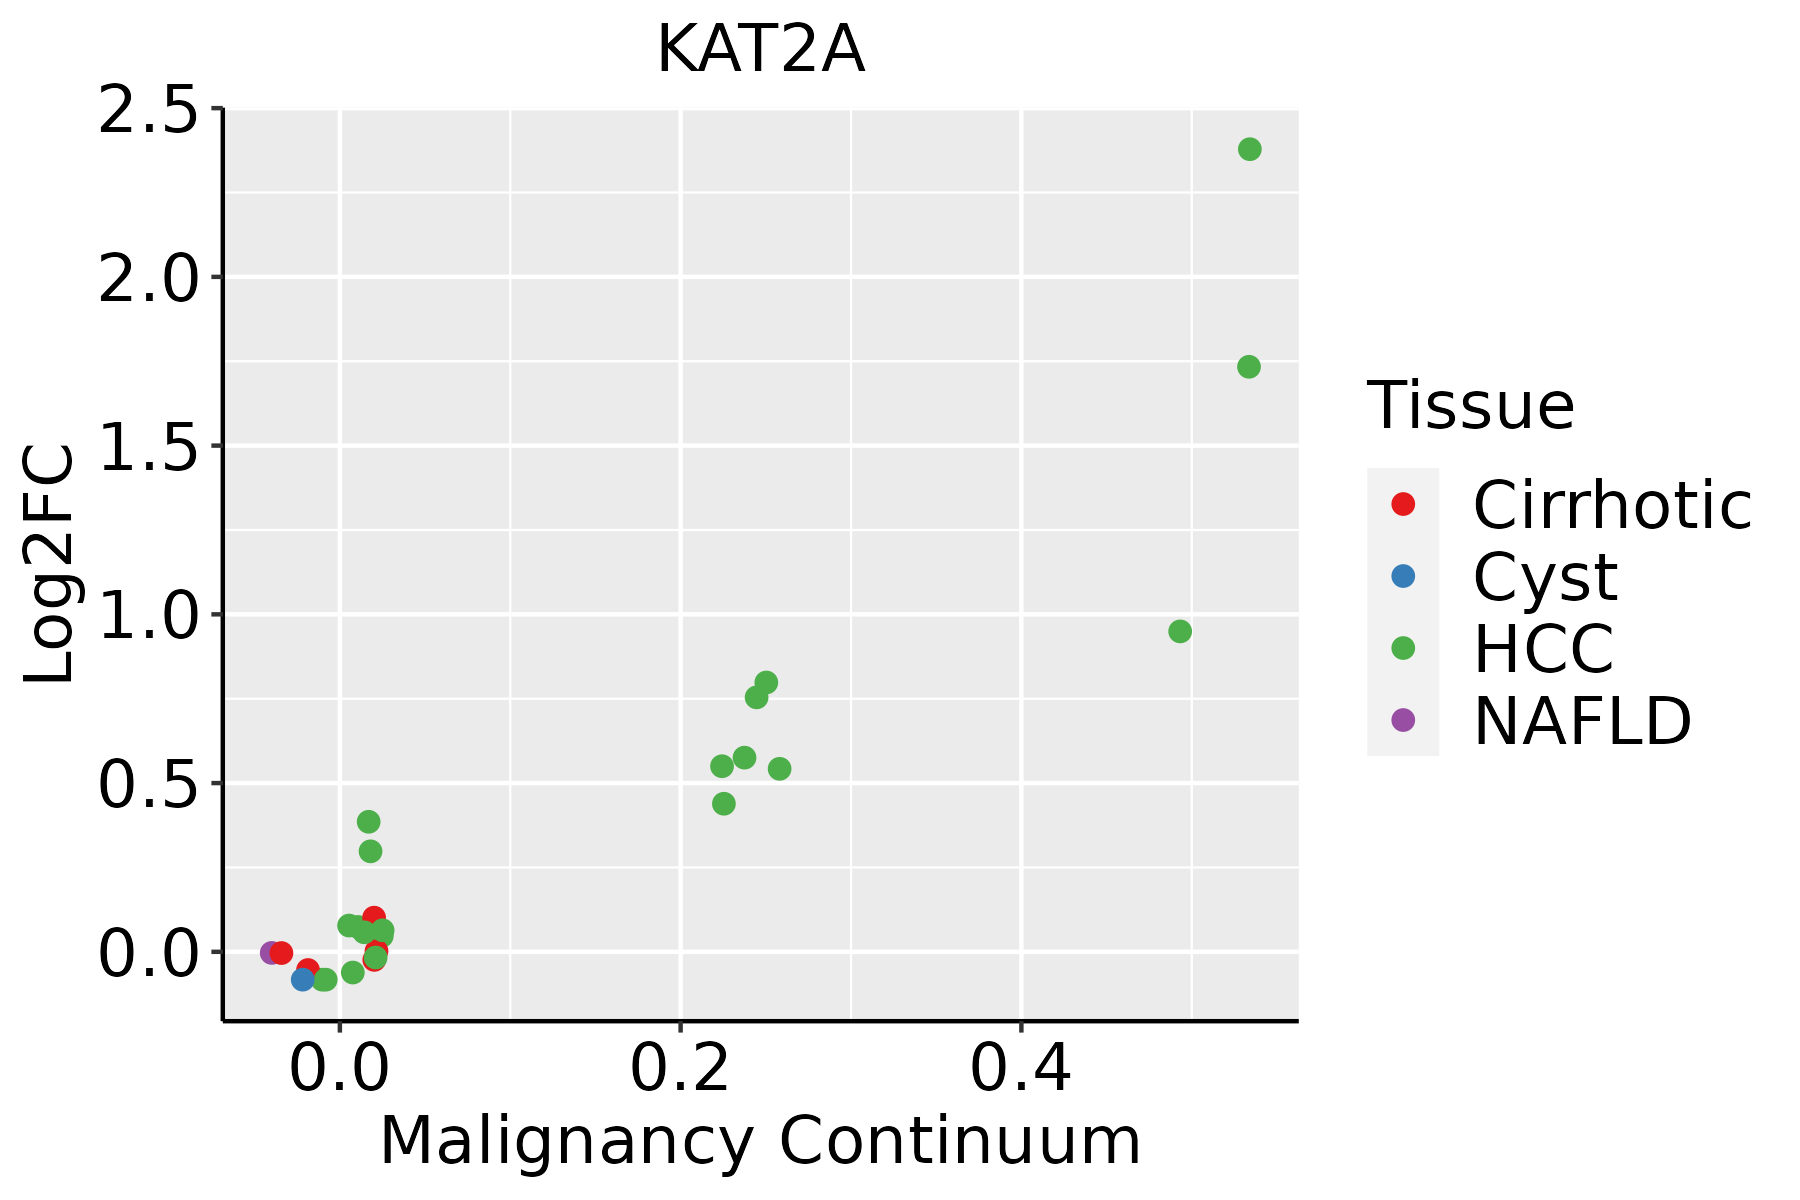 | HCC: Hepatocellular carcinoma |
| NAFLD: Non-alcoholic fatty liver disease |
| Oral Cavity | 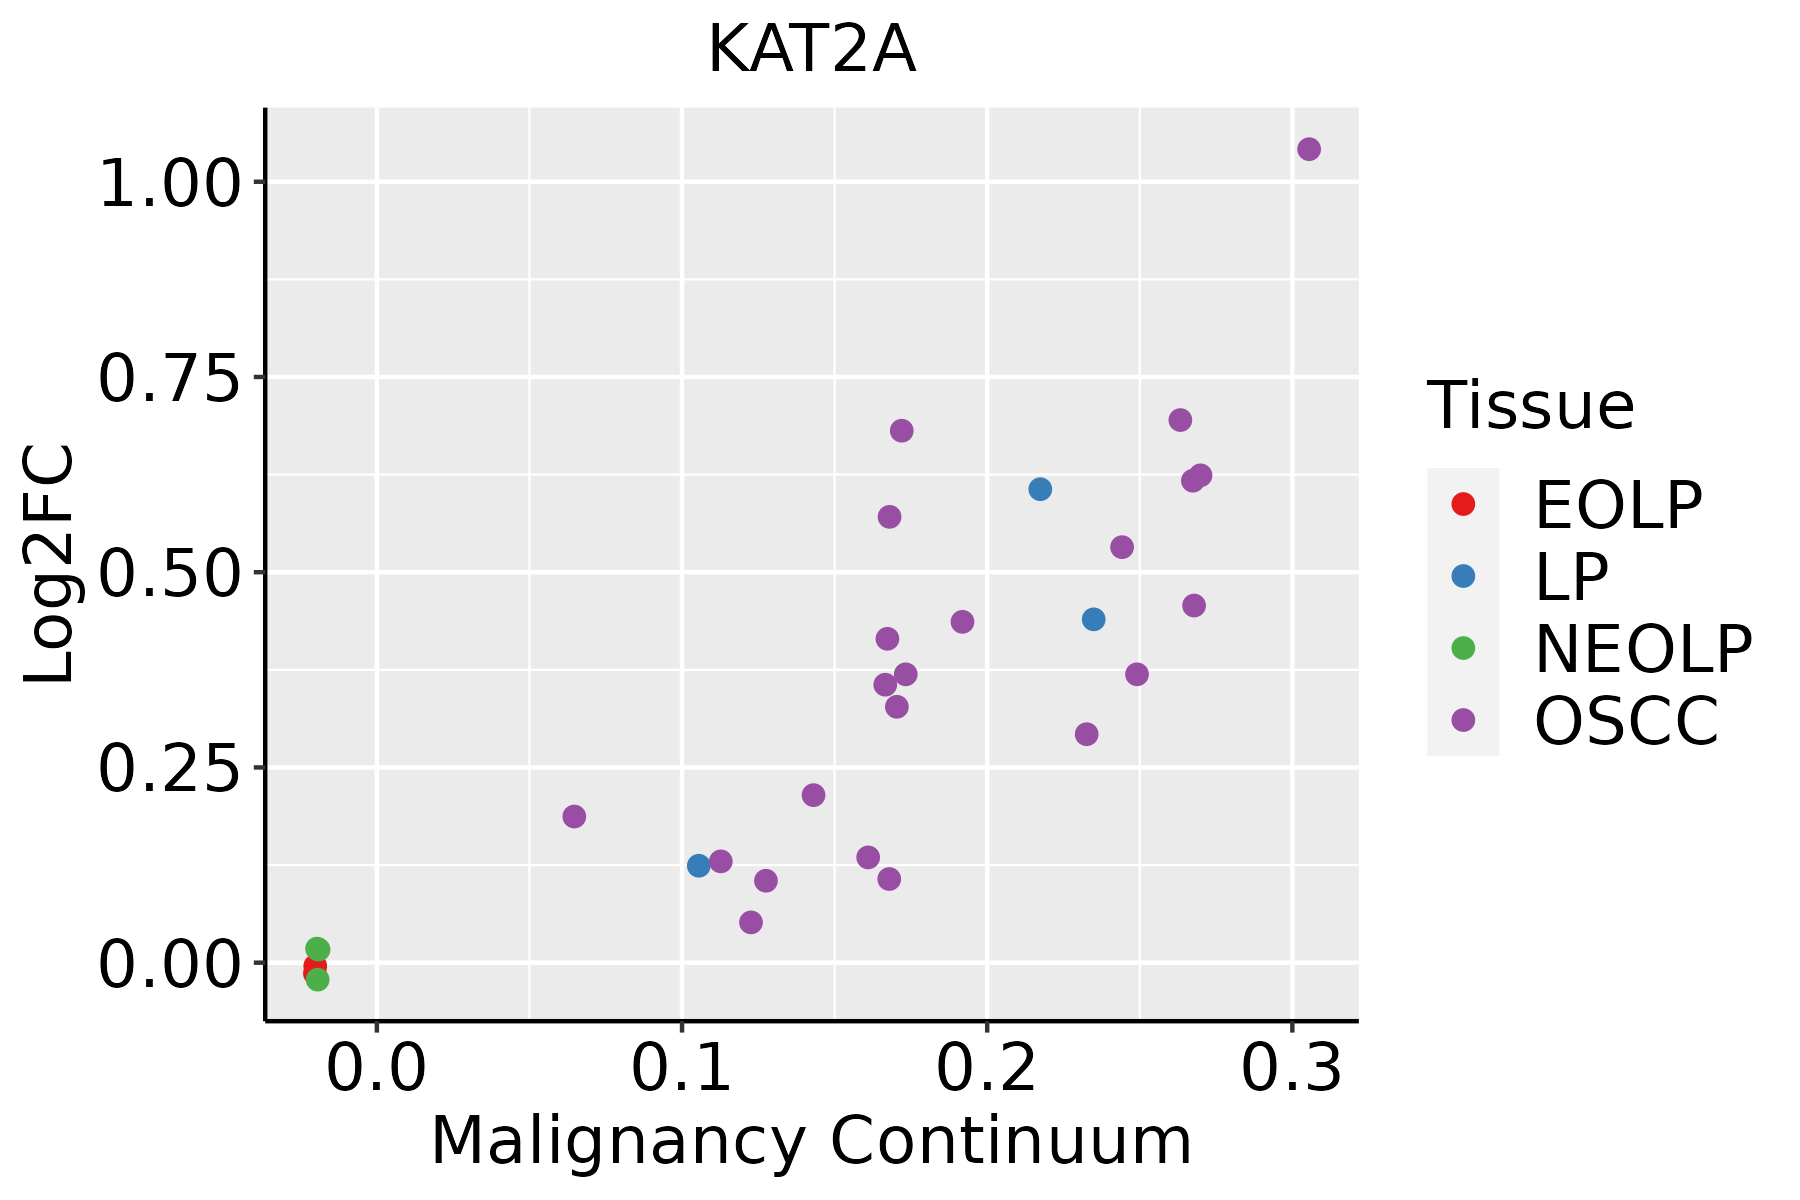 | EOLP: Erosive Oral lichen planus |
| LP: leukoplakia |
| NEOLP: Non-erosive oral lichen planus |
| OSCC: Oral squamous cell carcinoma |
| Skin |  | AK: Actinic keratosis |
| cSCC: Cutaneous squamous cell carcinoma |
| SCCIS:squamous cell carcinoma in situ |
| GO ID | Tissue | Disease Stage | Description | Gene Ratio | Bg Ratio | pvalue | p.adjust | Count |
| GO:000184313 | Oral cavity | LP | neural tube closure | 33/4623 | 88/18723 | 5.09e-03 | 3.16e-02 | 33 |
| GO:006060613 | Oral cavity | LP | tube closure | 33/4623 | 89/18723 | 6.20e-03 | 3.67e-02 | 33 |
| GO:000600614 | Oral cavity | LP | glucose metabolic process | 64/4623 | 196/18723 | 7.09e-03 | 3.98e-02 | 64 |
| GO:190370619 | Oral cavity | LP | regulation of hemopoiesis | 111/4623 | 367/18723 | 8.48e-03 | 4.60e-02 | 111 |
| GO:003164729 | Skin | cSCC | regulation of protein stability | 144/4864 | 298/18723 | 6.51e-17 | 6.80e-15 | 144 |
| GO:000170124 | Skin | cSCC | in utero embryonic development | 150/4864 | 367/18723 | 2.47e-10 | 1.04e-08 | 150 |
| GO:001657024 | Skin | cSCC | histone modification | 179/4864 | 463/18723 | 9.65e-10 | 3.74e-08 | 179 |
| GO:0010639111 | Skin | cSCC | negative regulation of organelle organization | 140/4864 | 348/18723 | 3.35e-09 | 1.15e-07 | 140 |
| GO:003105615 | Skin | cSCC | regulation of histone modification | 68/4864 | 152/18723 | 4.07e-07 | 7.93e-06 | 68 |
| GO:000647314 | Skin | cSCC | protein acetylation | 84/4864 | 201/18723 | 6.94e-07 | 1.29e-05 | 84 |
| GO:0030901110 | Skin | cSCC | midbrain development | 45/4864 | 90/18723 | 8.81e-07 | 1.63e-05 | 45 |
| GO:001839414 | Skin | cSCC | peptidyl-lysine acetylation | 72/4864 | 169/18723 | 1.81e-06 | 3.02e-05 | 72 |
| GO:00310584 | Skin | cSCC | positive regulation of histone modification | 45/4864 | 92/18723 | 1.92e-06 | 3.17e-05 | 45 |
| GO:004578613 | Skin | cSCC | negative regulation of cell cycle | 140/4864 | 385/18723 | 3.64e-06 | 5.50e-05 | 140 |
| GO:001820515 | Skin | cSCC | peptidyl-lysine modification | 137/4864 | 376/18723 | 4.09e-06 | 6.09e-05 | 137 |
| GO:001982715 | Skin | cSCC | stem cell population maintenance | 58/4864 | 131/18723 | 4.20e-06 | 6.24e-05 | 58 |
| GO:000632519 | Skin | cSCC | chromatin organization | 147/4864 | 409/18723 | 4.41e-06 | 6.52e-05 | 147 |
| GO:004354314 | Skin | cSCC | protein acylation | 95/4864 | 243/18723 | 4.56e-06 | 6.71e-05 | 95 |
| GO:009872715 | Skin | cSCC | maintenance of cell number | 58/4864 | 134/18723 | 9.83e-06 | 1.29e-04 | 58 |
| GO:000647514 | Skin | cSCC | internal protein amino acid acetylation | 66/4864 | 160/18723 | 1.72e-05 | 2.07e-04 | 66 |
| Pathway ID | Tissue | Disease Stage | Description | Gene Ratio | Bg Ratio | pvalue | p.adjust | qvalue | Count |
| hsa05166211 | Esophagus | ESCC | Human T-cell leukemia virus 1 infection | 164/4205 | 222/8465 | 8.13e-14 | 2.09e-12 | 1.07e-12 | 164 |
| hsa032509 | Esophagus | ESCC | Viral life cycle - HIV-1 | 54/4205 | 63/8465 | 2.01e-09 | 2.17e-08 | 1.11e-08 | 54 |
| hsa0520325 | Esophagus | ESCC | Viral carcinogenesis | 137/4205 | 204/8465 | 2.47e-07 | 1.88e-06 | 9.62e-07 | 137 |
| hsa0491928 | Esophagus | ESCC | Thyroid hormone signaling pathway | 78/4205 | 121/8465 | 6.79e-04 | 2.23e-03 | 1.14e-03 | 78 |
| hsa043306 | Esophagus | ESCC | Notch signaling pathway | 42/4205 | 62/8465 | 2.97e-03 | 7.97e-03 | 4.08e-03 | 42 |
| hsa05166310 | Esophagus | ESCC | Human T-cell leukemia virus 1 infection | 164/4205 | 222/8465 | 8.13e-14 | 2.09e-12 | 1.07e-12 | 164 |
| hsa0325014 | Esophagus | ESCC | Viral life cycle - HIV-1 | 54/4205 | 63/8465 | 2.01e-09 | 2.17e-08 | 1.11e-08 | 54 |
| hsa0520335 | Esophagus | ESCC | Viral carcinogenesis | 137/4205 | 204/8465 | 2.47e-07 | 1.88e-06 | 9.62e-07 | 137 |
| hsa04919113 | Esophagus | ESCC | Thyroid hormone signaling pathway | 78/4205 | 121/8465 | 6.79e-04 | 2.23e-03 | 1.14e-03 | 78 |
| hsa0433013 | Esophagus | ESCC | Notch signaling pathway | 42/4205 | 62/8465 | 2.97e-03 | 7.97e-03 | 4.08e-03 | 42 |
| hsa0516622 | Liver | HCC | Human T-cell leukemia virus 1 infection | 139/4020 | 222/8465 | 3.17e-06 | 2.79e-05 | 1.55e-05 | 139 |
| hsa032502 | Liver | HCC | Viral life cycle - HIV-1 | 46/4020 | 63/8465 | 3.25e-05 | 1.88e-04 | 1.04e-04 | 46 |
| hsa0491912 | Liver | HCC | Thyroid hormone signaling pathway | 75/4020 | 121/8465 | 8.76e-04 | 3.38e-03 | 1.88e-03 | 75 |
| hsa052032 | Liver | HCC | Viral carcinogenesis | 117/4020 | 204/8465 | 2.68e-03 | 8.98e-03 | 5.00e-03 | 117 |
| hsa0516632 | Liver | HCC | Human T-cell leukemia virus 1 infection | 139/4020 | 222/8465 | 3.17e-06 | 2.79e-05 | 1.55e-05 | 139 |
| hsa0325011 | Liver | HCC | Viral life cycle - HIV-1 | 46/4020 | 63/8465 | 3.25e-05 | 1.88e-04 | 1.04e-04 | 46 |
| hsa0491913 | Liver | HCC | Thyroid hormone signaling pathway | 75/4020 | 121/8465 | 8.76e-04 | 3.38e-03 | 1.88e-03 | 75 |
| hsa052033 | Liver | HCC | Viral carcinogenesis | 117/4020 | 204/8465 | 2.68e-03 | 8.98e-03 | 5.00e-03 | 117 |
| hsa0516630 | Oral cavity | OSCC | Human T-cell leukemia virus 1 infection | 150/3704 | 222/8465 | 3.68e-13 | 7.26e-12 | 3.70e-12 | 150 |
| hsa052038 | Oral cavity | OSCC | Viral carcinogenesis | 124/3704 | 204/8465 | 5.57e-07 | 3.28e-06 | 1.67e-06 | 124 |
| TF | Cell Type | Tissue | Disease Stage | Target Gene | RSS | Regulon Activity |
| KAT2A | DC | Breast | ADJ | CMTM8,DNAJC4,ATP8B4, etc. | 3.21e-02 |  |
| KAT2A | CD8TEX | Breast | ADJ | CMTM8,DNAJC4,ATP8B4, etc. | 4.29e-02 | |
| KAT2A | GC | Breast | ADJ | CMTM8,DNAJC4,ATP8B4, etc. | 3.26e-02 | |
| KAT2A | CD8TEXP | Breast | Precancer | CMTM8,DNAJC4,ATP8B4, etc. | 4.80e-02 |  |
| KAT2A | INCAF | Colorectum | SER | PCNP,SLC35F2,DHX37, etc. | 1.92e-01 |  |
| KAT2A | LUM | Endometrium | EEC | CCNL2,WASHC1,UBA7, etc. | 3.37e-02 |  |
| KAT2A | CD8TEX | Endometrium | Healthy | PLEKHG2,MRM2,CENPS, etc. | 1.22e-01 |  |
| KAT2A | PSC | Pancreas | Healthy | NUDT12,TMEM156,RGS9, etc. | 2.43e-02 |  |
| KAT2A | M1MAC | Stomach | ADJ | VPS54,APOC3,CD14, etc. | 1.61e-01 |  |
| KAT2A | M1MAC | Stomach | CAG | VPS54,APOC3,CD14, etc. | 2.23e-01 |  |
| Hugo Symbol | Variant Class | Variant Classification | dbSNP RS | HGVSc | HGVSp | HGVSp Short | SWISSPROT | BIOTYPE | SIFT | PolyPhen | Tumor Sample Barcode | Tissue | Histology | Sex | Age | Stage | Therapy Types | Drugs | Outcome |
| KAT2A | SNV | Missense_Mutation | | c.1216N>G | p.Ile406Val | p.I406V | Q92830 | protein_coding | tolerated(0.68) | benign(0) | TCGA-BH-A18G-01 | Breast | breast invasive carcinoma | Female | >=65 | I/II | Unknown | Unknown | SD |
| KAT2A | SNV | Missense_Mutation | | c.2396G>A | p.Arg799Gln | p.R799Q | Q92830 | protein_coding | deleterious(0) | probably_damaging(0.995) | TCGA-D8-A1XK-01 | Breast | breast invasive carcinoma | Female | <65 | I/II | Chemotherapy | doxorubicine+cyclophosphamide | SD |
| KAT2A | SNV | Missense_Mutation | novel | c.1213N>A | p.Pro405Thr | p.P405T | Q92830 | protein_coding | tolerated(0.15) | benign(0.01) | TCGA-E2-A1LS-01 | Breast | breast invasive carcinoma | Female | <65 | I/II | Unspecific | Cyclophosphamide | SD |
| KAT2A | insertion | In_Frame_Ins | novel | c.2155_2156insCCCCACACCTGCTCCTGCCCTCACTGCGCCCTGCAG | p.Leu719delinsSerProHisLeuLeuLeuProSerLeuArgProAlaVal | p.L719delinsSPHLLLPSLRPAV | Q92830 | protein_coding | | | TCGA-A2-A0T0-01 | Breast | breast invasive carcinoma | Female | <65 | I/II | Chemotherapy | taxotere | SD |
| KAT2A | insertion | Frame_Shift_Ins | novel | c.1664_1665insTGAGGGCCTGTGGGGCC | p.Lys555AsnfsTer46 | p.K555Nfs*46 | Q92830 | protein_coding | | | TCGA-AN-A0FS-01 | Breast | breast invasive carcinoma | Female | <65 | I/II | Unknown | Unknown | SD |
| KAT2A | SNV | Missense_Mutation | novel | c.1096N>C | p.Glu366Gln | p.E366Q | Q92830 | protein_coding | deleterious(0) | probably_damaging(0.996) | TCGA-C5-A2LZ-01 | Cervix | cervical & endocervical cancer | Female | >=65 | III/IV | Unknown | Unknown | PD |
| KAT2A | SNV | Missense_Mutation | | c.1442N>T | p.Ser481Leu | p.S481L | Q92830 | protein_coding | deleterious(0.03) | benign(0.371) | TCGA-EA-A3HU-01 | Cervix | cervical & endocervical cancer | Female | <65 | I/II | Unknown | Unknown | SD |
| KAT2A | SNV | Missense_Mutation | rs373255391 | c.2299G>A | p.Glu767Lys | p.E767K | Q92830 | protein_coding | deleterious(0) | benign(0.108) | TCGA-LP-A4AU-01 | Cervix | cervical & endocervical cancer | Female | <65 | III/IV | Chemotherapy | cisplatin | CR |
| KAT2A | SNV | Missense_Mutation | novel | c.1018G>C | p.Glu340Gln | p.E340Q | Q92830 | protein_coding | deleterious(0.01) | probably_damaging(0.969) | TCGA-MA-AA41-01 | Cervix | cervical & endocervical cancer | Female | <65 | I/II | Unknown | Unknown | SD |
| KAT2A | SNV | Missense_Mutation | novel | c.2338G>A | p.Glu780Lys | p.E780K | Q92830 | protein_coding | tolerated(0.06) | probably_damaging(0.988) | TCGA-VS-A8EK-01 | Cervix | cervical & endocervical cancer | Female | >=65 | I/II | Chemotherapy | cisplatin | PD |


